
bloodbound696
@t_bloodbound696
What symbols does the trader recommend buying?
Purchase History
پیام های تریدر
Filter

bloodbound696
BTC/USD 3HR Inverse head and shoulders idea.
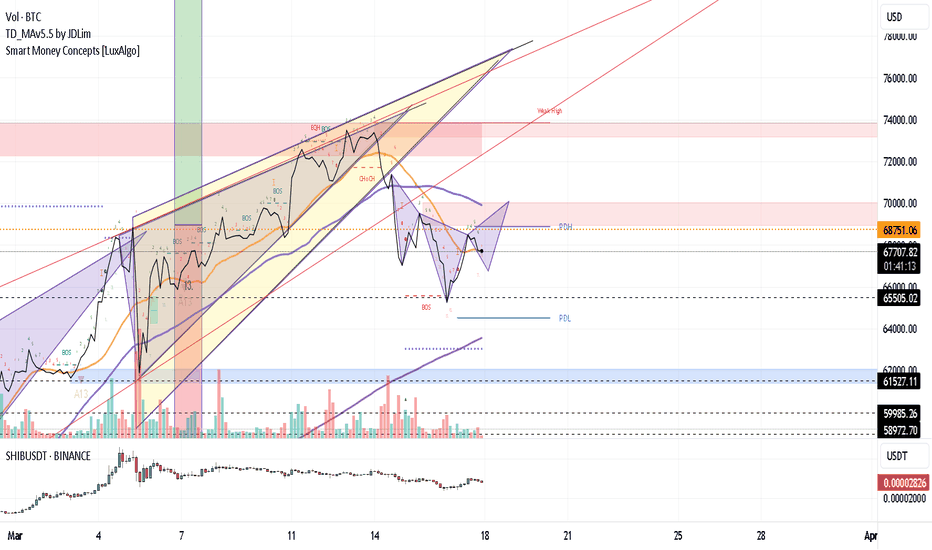
There could be an inverse head and shoulders forming on BTC/USD 3hr. Maybe it happens, maybe it doesn't. We shall see.

bloodbound696
Possible Ascending Triangle Make it or Break it moment. BTC/USD
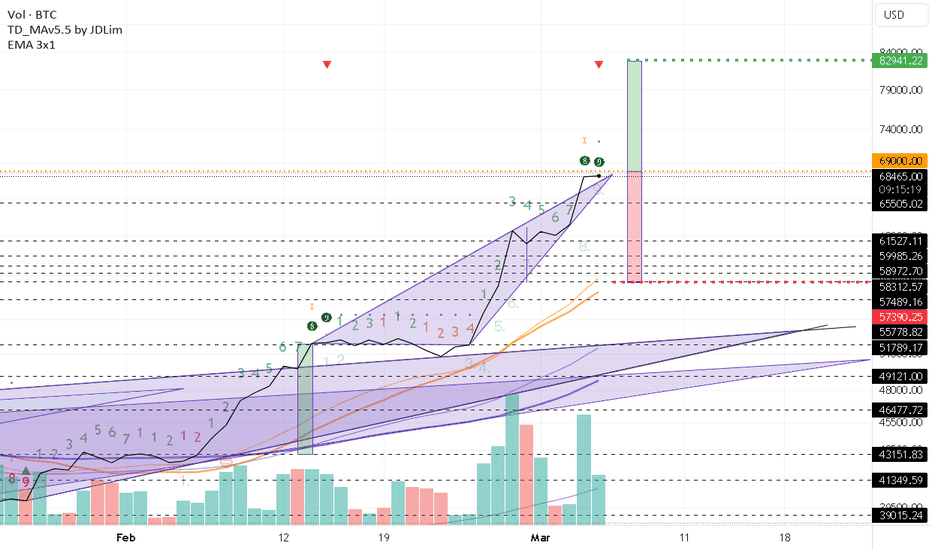
-Ascending Triangle on the daily-TD 9 confluence with Apex of the triangle-Triangle serves as a synthetic A13-Targets are either. 82941 for the Long::::57390 for the short.-Suspicious after a possible structural interruption making the pole smaller than originally perceived at 49k-ish-Watch Short/Longs Indexes Here we have on the Daily an ascending triangle. As you can see we are reaching the end of its life cycle. To me at this price point and all the market anxiety pre-halving and people expecting retraces and such this is an important moment. I think this may be a Bull flag.. as it stands.. but be careful because it could fail. I'm not bearish but I'm not careless either. I have 2 possible targets based on the measurements of the pole with one problem... if you look around.. 49k-ish on the daily.. that red candle is kind of throwing me off not gonna lie so the target may be... way and laughably shorter than what we may think due to structural interruption. Regardless I'm... almost certain everything is good though in regards to that but I will remain suspicious until proven otherwise. The triangle at these prices is the equivalent of an A13? Why? Easy Structure that points to volatility in the soon-to-be future. How incredible we also have arrived at a TD 9 at the daily. Out of all the numbers.. This is the one with the highest chance of volatility than the rest because it is the most likely "predict" so to speak that price action will NOT range. Rather Make it or Break it. This is why this makes sense to me right the edge of the Apex of this structure. My targets for this are if we go up 82941 and if we go down 57390. By the way, if we do go down... This may be a catalyst for a much stronger retracement so watch out. If we go up... the likelihood of going higher... in my opinion is greater... and the retracement is in my head much higher than we are right now, rest assured those shorts will give you know warning to check any indexes in regards to that.Things are not looking too hot for the bulls right now, all I'm saying my major concern is closing... under the 200ma and ema on macro timeframes.. That is going to be killer if we do that.

bloodbound696
Very Possible bull flag on BTC/USD Coinbase
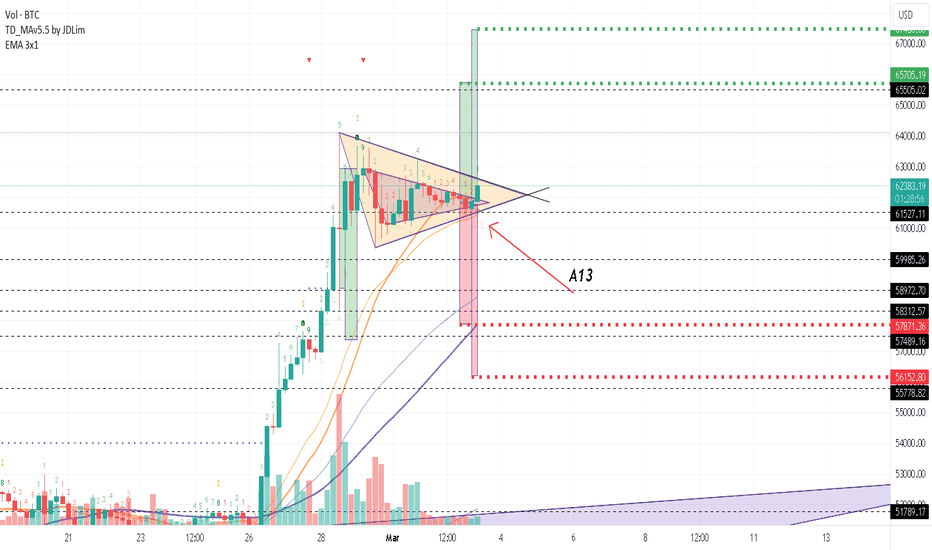
BTC/USD Coinbase-Possible Bull flag-Possible Targets include...-Short: 57.8 - 56.1-Long: 65.7- 67.4- Close to close triangle on 4 hour- High to low triangle on 4 hour-A13 Signal of high volatility comingWell as it stands let's get this out of the way. So far we have gotten a massive rally followed by an incredibly well-defined pennant on the 4-hour. After its creation bulls and bears have been loosely trading the ranges tighter and tighter forming what we now have. With the bull market around the corner? Everyone will go bullish eventually but you have to have the question of the pre-halving activity. One of really 2 things was going to happen I think here. Either a retest of the 50sma on the 4-hour was probably going to occur or a pump of a bull flag. Now I have measured both realistic possibilities based on concepts on harmonics and very common T/A nothing special here. The measurements are for the upside, 65.7 or 67.4. For the downside, 57.8 or 56.1. I think that for every dollar we go up we are going to fomo more people in. I figure this because when you are out of an accumulative structure, You better be right and people tend to be biased towards the side it's already going. Now, btw I have pointed out an A13 my most significant signal for Volatility to come. With the scale of the 4 hour timeframe it tells me we are finally leaving this very boring range, to be honest, I was getting a little tired myself. I will say one thing while we are trying... to get out of the pennant from the close-to-close perspective this has another "final" triangle that exists from the High and Low of the candles on the 4 hour.. Meanwhile, I'm curious if within that space the price action may have a rejection of a level of slanted trendline, maybe a tweezer top not to mention risking a possible "Long" on the discount of the price action testing the top part of the triangle from close to close... and worse high to low triangle. Not all structures "Go with the flow" perfectly so be careful out there. So basically there is still work to do to go higher properly. If we reach those higher levels. I'm just gonna go and say it... There is no T/A up there trust me, 2020 is an example if the market wants to throw BTC down it will but the difference is, You didn't predict it, You are confusing intelligence with pure luck. This goes both ways for bulls. I'm not even joking the most accurate thing you can look at those highs is the order books. That's it.-So anyway set your stops, there is a time and a place to wait for pull back but don't get greedy. -Today.. as of now Unless the candlesticks show something different, with Bullish divergence going around on the daily and the 4 hour like 1 candle ago, and the A13 as a catalyst... I am going to say I am long on this personally. Usually, I am neutral but *sigh..* Today is the day I guess and it is what it is. Choo Choo bois. Choo Choo 🚂🚂🚂Stay safe, Happy Trading.I would be one Cautious boy after the daily candle closes because it's also the weekly close and that may kick start some more movement sooner than later.😩 Just barely touched T1. Still Good stuff, hopefully we get to T2 without too many interruptions.Target 2 got hit, Welp that's all I got I guess..The weekly bull flag in one of my other posts got completed at the end of sunday so... I got nothing lol good luck.

bloodbound696
Tweezer top may form by the end of the week BTC/USD
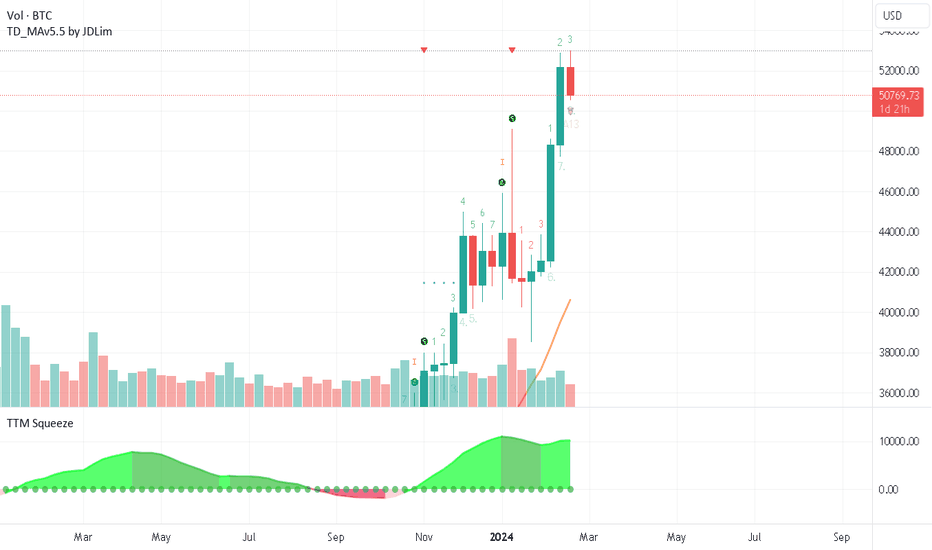
With a diamond on the 4-hour of Indecision, it's a pivotal moment for the intra-day moves.I offer a bearish Idea. What if we form a tweezer top on the weekly close? This involves the previous candle on the weekly.If you look up what qualifies as a tweezer top and what they do, first of all, they are a reversal candle stick pattern. There are a couple of variants that match up with what we have going on right now. The best-case scenario is that we close the weekly at 48k and have the craziest Tweezer top the market has ever sent us. Now that's what is ideal but it does not have to be the same perfect size as the previous body of the candle with 1 exception the top wicks are currently matching (with a difference of a small percent just by eying it I have not measured it.) Not to mention we are at resistance on the weekly. We also have 2 wicks currently that are pretty much aligned, it's not super long but.. I think if we can close lower? Like under 50.4k-ish, We can seal the deal as a tweezer top for a better-quality candle stick pattern. With this, I also re-introduce the A13 of my TD Sequential my most prized signal. It is my signal of increased volatility incoming. This was insane to see early in the week and I knew something was up. Now for a bearish scenario, you see the weekly volume wells we have been forming? That same velocity in distribution can also be a supply zone for shorts to the downside on a massive scale. Because of this.. This could send us to 43.8k in no time. Again these zones are like space, no gravity any direction is up for grabs. If you look at the previous structure as a horizontal range, we totally could pull it off and this would be the perfect mix. I doubt we will see an engulfing candle if we do end up going down on the weekly but this would be a fair candle stick and signal-driven possibility to make some serious shorting happen.

bloodbound696
Potential Diamond on the 4HR BTC/USD
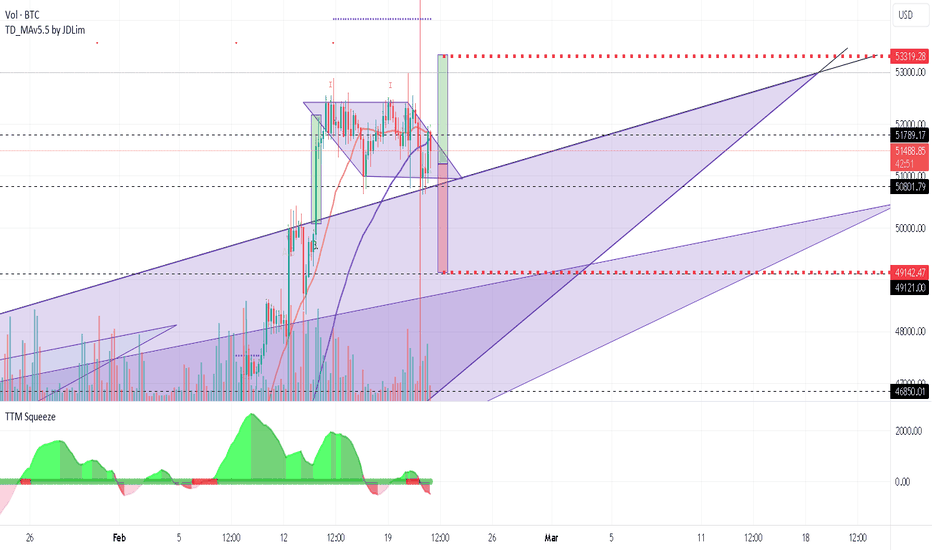
I think we have enough structural information to suggest a diamond might be at play.Options: Continuation Diamond or Diamond top.Harmonically we should expect impulses to one side in particular soon which aligns with the timing and apex of the Triangle which is the right side and part of the diamond pattern.There are potential opposing targets based on the original leg which caused us to consolidate at these levels in the first place.if we go up it will simply be a continuation of the current trend on the daily to the upside and with an A13 on the weekly, that's nothing short of good news for the bulls.If we go down it could be a quick retest of the local lows which happens to be further along the top of the bigger weekly triangle we broke up from and quickly get bought back up aligning with the volatility that should happen this and a couple of weeks to come. Not to mention volume wells... the price we are at. Confluence at this point. Another thing is we can go down... and the diamond becomes a catalyst to go back into the triangle and more than likely mature more into the larger triangle perhaps on an uptrend but perhaps not as fast? The worst case scenario is BTC breaks through the downside of the triangle on the daily and a massive downtrend is possible but.... for that, we are too early to be thinking about this bit for now.In terms of identifying this as a Diamond... I'm not going to lie I'm like.. 78% sure for this instance. I wish I had just a bit more.. touches regarding lines, I never want to force something that's not there you know? Anyway, let's see how this plays out.Small.. adjustment of the shape of the diamond demonstrated by the yellow area rather than the purple area of the previous drawing of the diamond. At least now we have more confirmation due to that small rejected we had previously. Also.. Keep an eye on that 4hr candle. Looks pretty interesting. Might have an influential affect at this point in the squeeze of the diamond since it's so far distributed in into the structure, we have to pop eventually perhaps it will be a catalystWoops forgot the candle stick version of BTC my bad.Were almost out of this just a couple more candles to go.BTC is under an insane amount of pressure right now. Even the troll box is going crazy.I'm so excited to see where this goes off too.PS: Watch out for fake outs, yes they happen even on the 4hr timeframe. Not everything is a wick stay safe out thereOkay. Let's talk it about it. What happened to my idea. Well my diamond was going pretty well actually, but for the first time in a while it actually.. sort of screwed me over not because it was not there... PERHAPS. I'm not afraid of considering the idea. But and I mean 99% of time close to close is better imo.. for better confluence in patterns personally I find them more reliable but maybe I didn't look within on a smaller timeframe, I mean let's be honest if you thought you had everything clear you're mind says it's done and that's that. My issue is... that on the 4 hour like I said, a possible fakeout might come. Looks like it did, You can see on the first purple circle. At that point it's like okay, it's a long. The issue arose when price distribute forward it started off good which was like 1/4 of the expect... bullish move. I thought it was gonna use the volume well and go all the way but it didn't it did 1/4th. How do I know? Because it literally did a 4 hour curve downwards and I was like.. Uh oh.." Then it hit me the Ladder like green candles on the top left of the diamond structure from close to close.. might have been the leg for the move but since on the 4 hour more complex price action is hidden within the candles I just thought we should be fine, because there was no red candles. I should have known that slow down in price was a "Structural interruption" like going from a highway to a bumpy off road trail. It's because it was grinding against the level and that's where my mistake was. Now... when this happened I immediately went, well They either are going to save my idea but barely any excuse for my predicted price action and they are going to call it a small retracement which is still an invalidation for me it's not fooling anyone. Either they do a inverse head and shoulders and it keeps going lower? or they harmonically use the h&s to pop up. When you expand to use lines from wick to wick, a slightly larger diamond appeared and if you see the dump we had on the right side of the inverse H & S, that... retracement of the second purple circle, would be... the fakeout (It didn't HAVE to happen..) and then... the impulse I expected happened. So.. I am just like Okay I can take the L for the close to close diamond today.. fair enough and maybe take a possibly unclaimable w for the wick to wick diamond.Anyway... Here's wonder wall. Just kidding.So I guess now this chart is becoming more and more a reality not the mention the A13 on the weekly so it's straight high volatility on the weeks for at least 4-6,7 more weekly candles. It's either going to be expressed in few.. or many candles in terms of distribution that's for sure.Anyhoo just wanted to clear the air.

bloodbound696
BTC/USD Bullish Tristar?
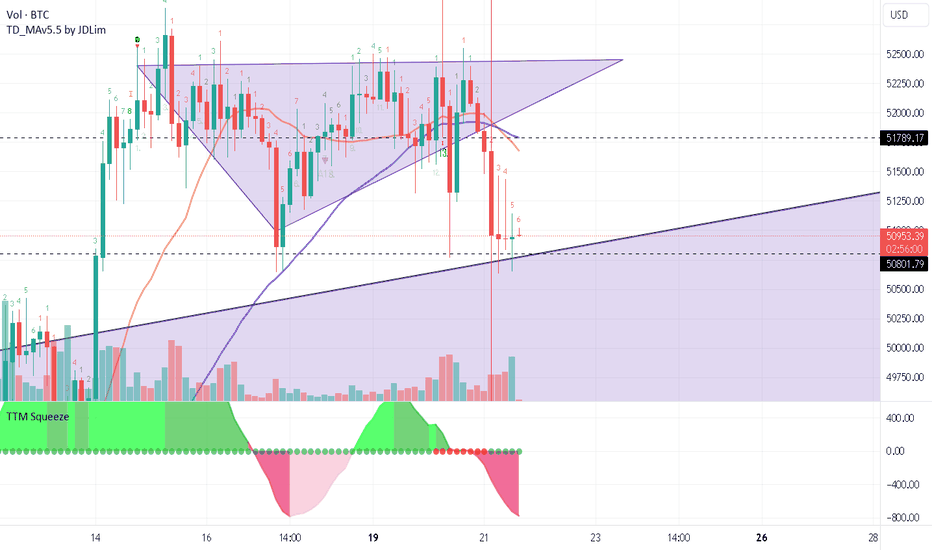
Here we have candle stick formation on the 3HR that in theory should be bullish, identified as a reversal pattern. Regardless expect a strong move on this timeframe because even if it fails harmonically we should get an impulse regardless. Maybe a 1 candle impulse but a consecutive move to one direction in this case, the Bias of this pattern is to the upside.Aw yeah cool, Tristar for the win.

bloodbound696
BTC/USD 1hr Tripple Bottom? Bear Flag?
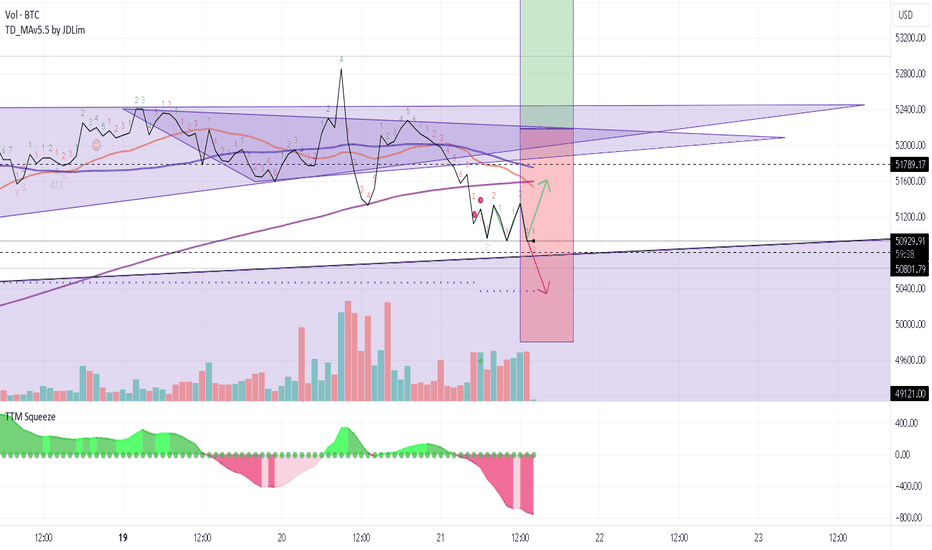
Nothing crazy, it just could be a setup for a tripple bottom or a bear flag. Maybe it does not do either who knows but it's a small idea. Just thought someone might like it.

bloodbound696
BTC/USD Bull flag or Break-down? 4HR
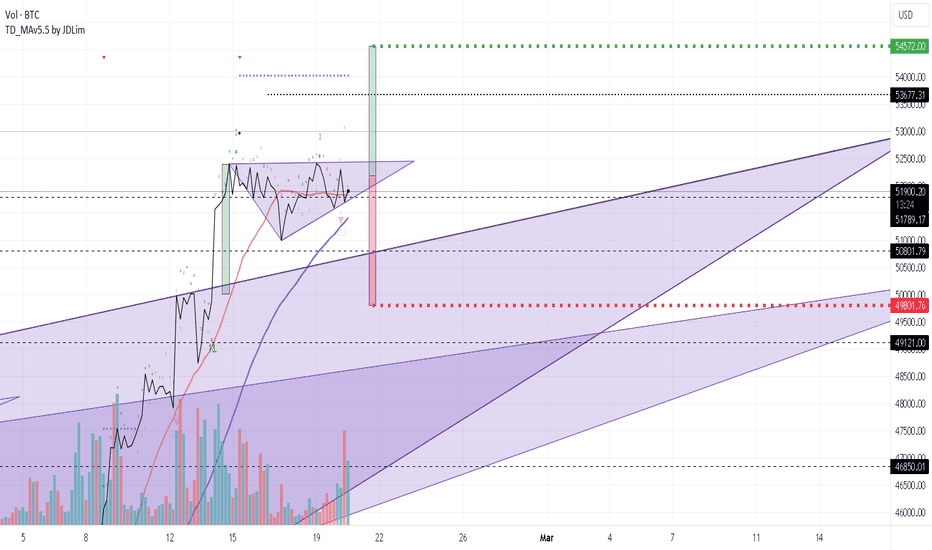
BTC/USD looks like it's forming a flag.We tested the high and failed, we then tested the lower areas of the triangle and also failed to break through.The current local bias is to the upside from rejecting the downside is currently the most recent event.I have 2 rough targets based on harmonics and volume wells close to us.There is some serious shaking in there, fighting for the final say.Enjoy.I'm not bearish per say but... I propose a bearish idea..Similar 2 rejections. One to the upside then to the downside, followed by consolidation followed by a dump.We have 2 rejections One to the upside, then the downside and... now... Maybe be consolidate?... and dump? Idk, it could get throw in the trash of ideas, I wouldn't call it a fractal or something, it just caught me eye.alright not really the fractal but, it did break down.

bloodbound696
Similar situation on the daily BTC/USD
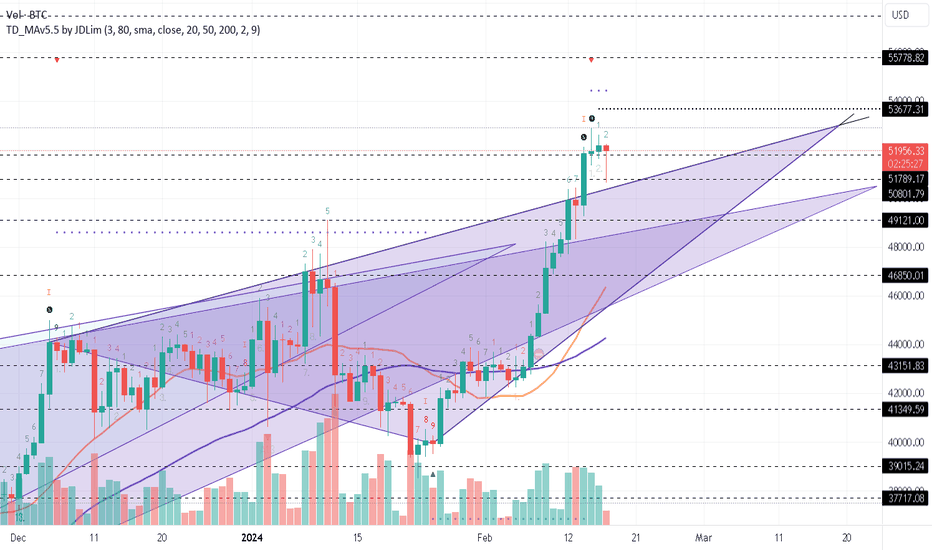
All I'm saying is, that the candle has not closed yet but it looks pretty similar in structure what was once on the weekly is pretty close to being the same thing but with the daily. With those 2 hanging man candlesticks. Looks like 2 rejections instead of exhaustion to me idk. Usually, you treat them like a bearish hammer but with the current trend idk.

bloodbound696
LTC/USD 2 Squeezes in One
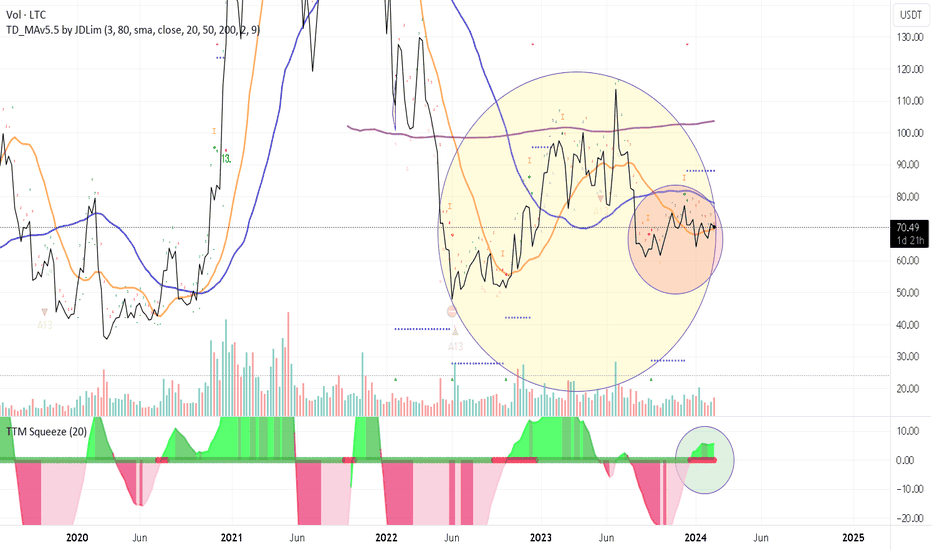
Here we are playing off the harmonic idea of a double confluence of squeezes in terms of structure and timing. The TTM Squeeze indicator has a rare weekly squeeze to the upside and LTC has not moved a muscle yet, which is a rare opportunity. In theory, based on what I have been seeing in the market... if everyone is as long as they say they are, this is a great opportunity the weekly scale I mean great tbh. Not to mention this would mean timely results instead of waiting a very long time for strong trend-like moves.Well well well so the TTM Squeeze finally showing on LTC now. To be fair the structure was sufficient GG.
Disclaimer
Any content and materials included in Sahmeto's website and official communication channels are a compilation of personal opinions and analyses and are not binding. They do not constitute any recommendation for buying, selling, entering or exiting the stock market and cryptocurrency market. Also, all news and analyses included in the website and channels are merely republished information from official and unofficial domestic and foreign sources, and it is obvious that users of the said content are responsible for following up and ensuring the authenticity and accuracy of the materials. Therefore, while disclaiming responsibility, it is declared that the responsibility for any decision-making, action, and potential profit and loss in the capital market and cryptocurrency market lies with the trader.