
bigkid803
@t_bigkid803

What symbols does the trader recommend buying?
Purchase History
پیام های تریدر
Filter
On the 19th Day of ETHmas...A Bullish Bounce from the Daily BOS
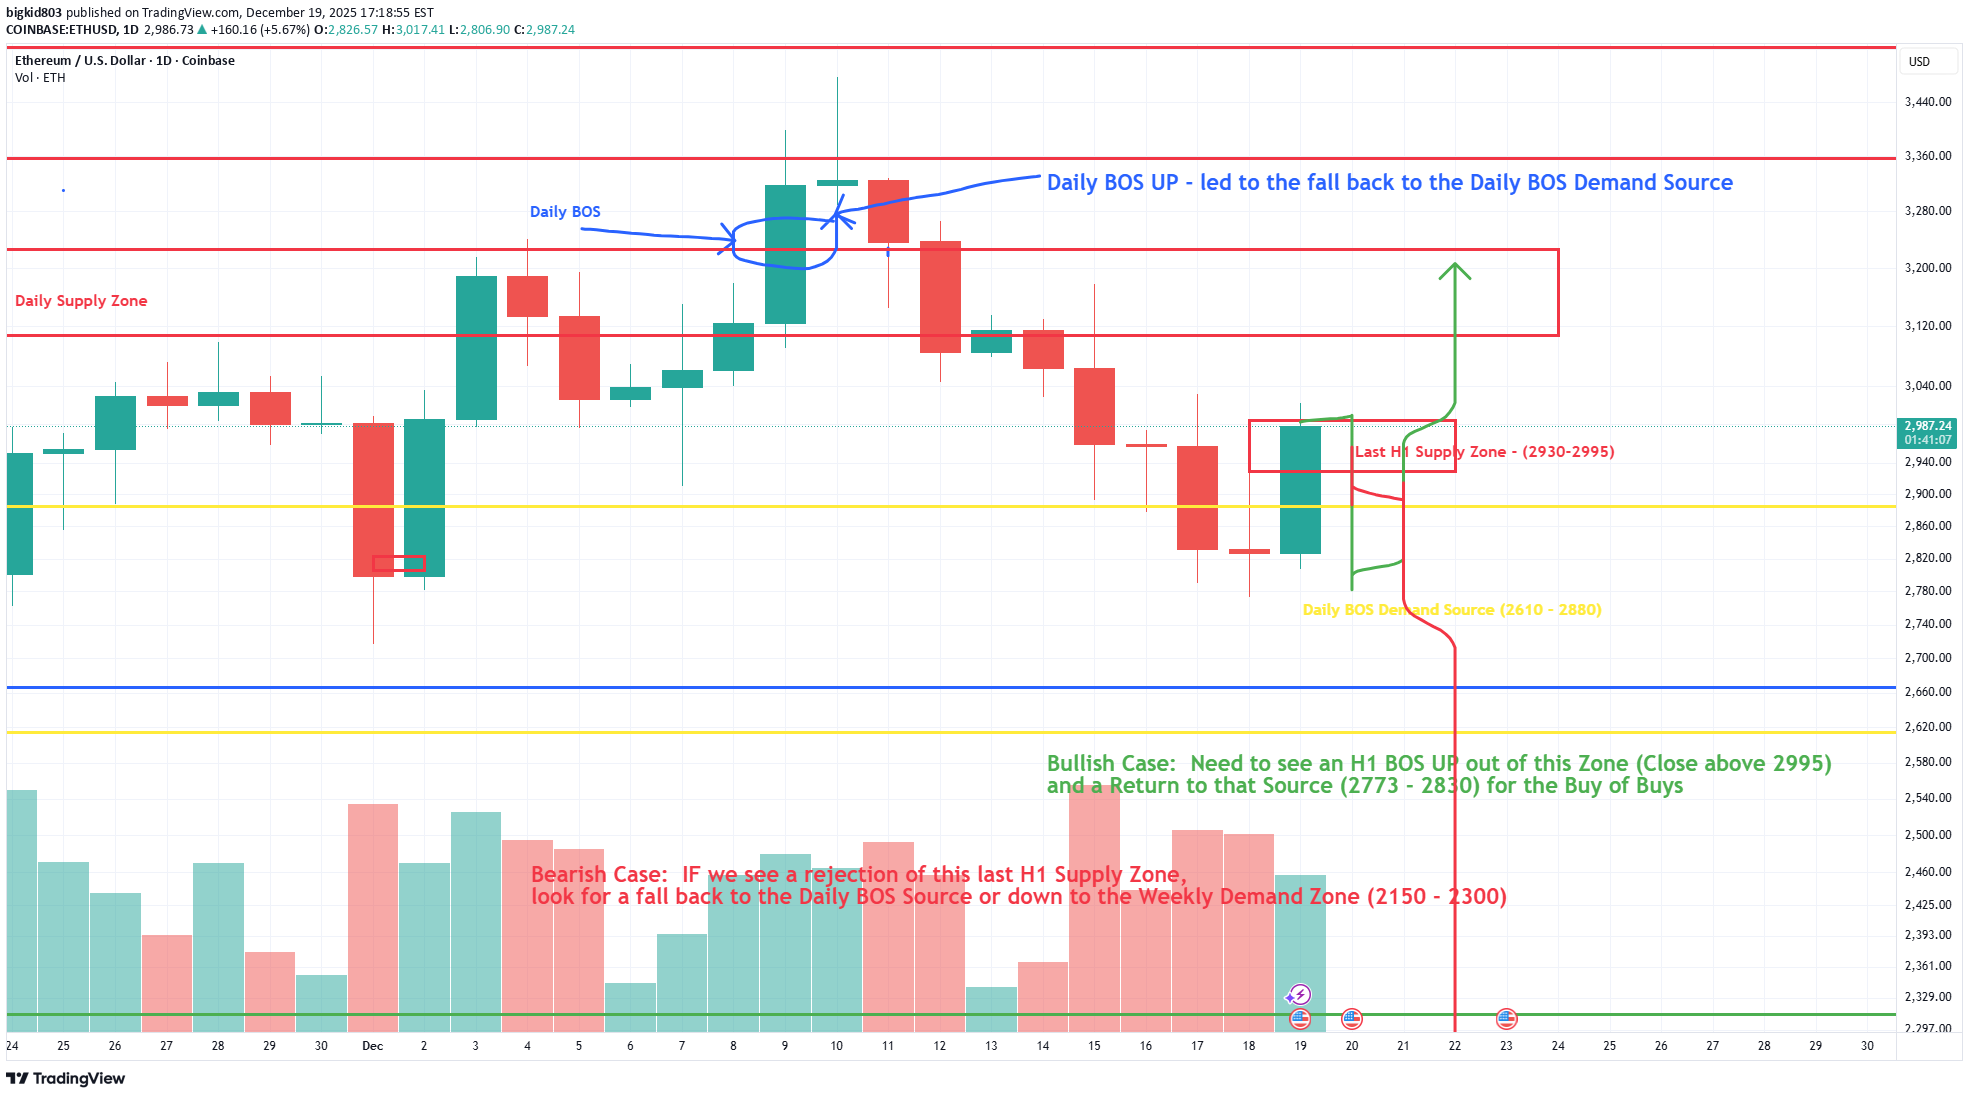
On the 19th Day of ETHmas, my True Love Gave to me....a Strong Bull Candle out of the Daily BOS Source! Hey, Traders. Been away a couple of days, but Ol' Faithful ETH is still playing out according to our reading of the market structure. In our last ETH update, we were focusing on the H4 and the last Structure on that time frame. We had some strong bullish responses from H4 Sources that indicated that ETH is at least ready to start pointing north. We pointed out that the Daily Time frame was becoming a stronger influence now, because we also had a bullish Daily BOS UP. This update is focusing on the Daily Chart and also a deep dive down to the H1 to see what we should be watching more closely. Please see our previous posts throughout November and December to see how we walked through ETH's structure up to this point. So, where are we now?: After the recent low on ~Nov 21st, ETH, we had a daily BOS UP on Dec 9th. That was a critical structural break, and as we have taught here several times, a key BOS like this almost always leads to a return to the BOS Source. That Daily BOS Source zone is at ~2612 - 2886, and ETH retraced exactly back to that area to regain strength. Once we fell back into this zone, we got the expected daily response that played out today. Today saw a strong bullish candle push up from 2825 to over 3000 again. This is a good sign for the bulls, but there are several things that still need to play out before we can get that White (or Green) ETHmas! What to look out for: What we really need out of this Daily BOS Demand Source is an H1 BOS UP and a return to that source. If you dive down to the H1, you will see the last H1 Supply Zone is 2930 - 2995. Today's high did break above that, but we have NOT gotten an H1 candle to close above that level yet. SO...there is no H1 BOS yet. We need to see an H1 Candle close above 2995 to give the BOS, and then we need to look for a retracement again back to the source of that break. This would be the strongest bull case for getting out of this Daily BOS Demand Source. Without a strong enough confirmation out of here, ETH is still not out of the Danger Zone. What are the Dangers from here?: If we do not get a strong enough bull structure coming out of this Daily BOS Demand Source, then this signals that even the Daily Structure is not strong enough to propel ETH back to previous highs. We then would have to look at the higher Weekly Structure which has still been playing out. The last Weekly Demand Zone is HUGE (2150 - 2700). So, if we cannot get the push from this Daily Structure, ETH will likely fall back to this level. The most likely target will be the Daily source inside of that Weekly Zone (2150 - 2300). Are there any good trade opportunities where we are now?: There are still a few good trade opportunities that should play out very well if you have the discipline and patience. There are both bullish and bearish cases from here. For the short-term, it's pretty much bearish: 1. IF ETH does give the H1 BOS UP we're looking for (Close above 2995), then we can short the retracement back to the source of that. The target would be the low inside of the Daily BOS Demand Source (2800-2830). At that point, we should switch to a LONG with an initial target to come back up to the last H1 Supply Source ~3160. 2. IF ETH rejects from here without giving an H1 BOS (no H1 close above 2995), we can still short it, but can expect it to fall farther down into the Daily Demand Source and make a lower low. Target ~ 2660-2760. I hope you all have been following along and trading ETH with us. Please leave me any comments or questions, as I would love to hear your thoughts on my analyses. And if you need any help in better understanding how to read the markets, reach out and we'd be glad to help!
هدیه کریسمس زودرس اتریوم: تارگت رسید، اما ساختار روزانه جدید خطرناک است!
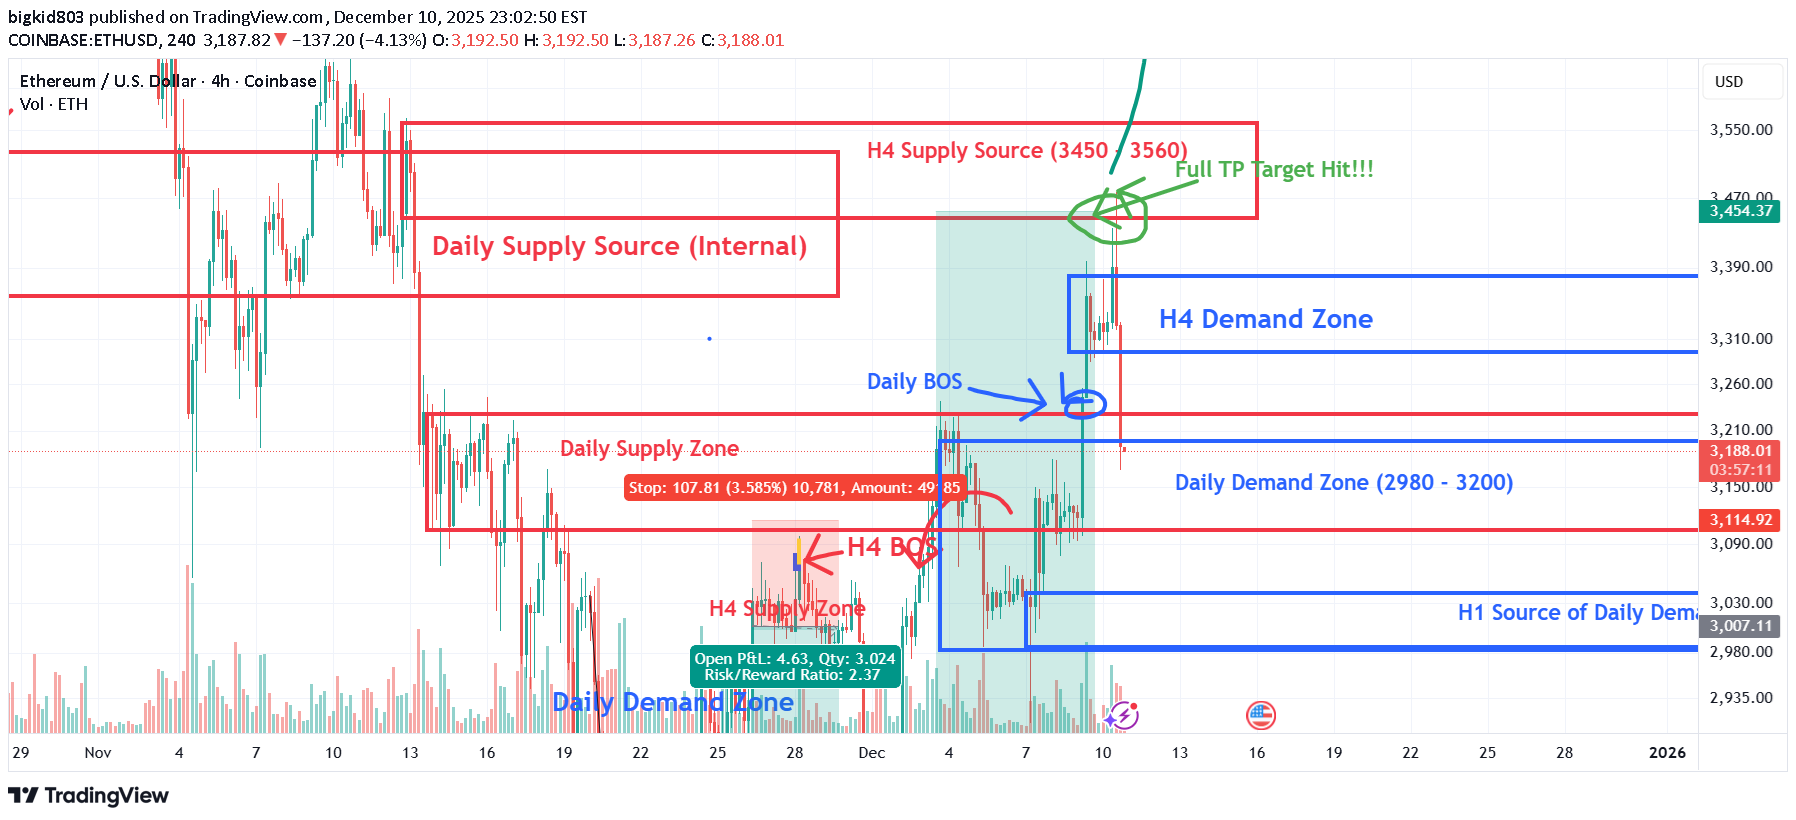
On the 10th day of ETHmas, My True Love gave to me....a Big Push Up to my TP!!!! ....and a new Daily Structure that could be a Game Changer! Wow! This ETH play has been absolutely amazing! Today, we continued playing out just as expected and hit our full TP Target of the H4 Daily Source Zone. Please see our previous posts on ETH over the past month to see exactly how we have walked through a solid Technical and Structural Analysis of ETH, and how it played out perfectly! So, what has happened: The last day or so has seen what appeared to be a choppy back and forth of the market...responding to more completely irrelevant crypto news, Fed Rate Talks, Microstrategy Megabuys and more. All the while, the market has been simply playing out structure that was laid out a month ago. Today saw ETH push extremely hard ($200+ move), making many think that the Bull run was kicking off again. BTC saw a near identical move. Unfortunately, too many traders chased this pump, only to be slapped back down once it hit the H4 Supply Source that we have been targeting. It is a Supply Source, because that is where the market has already told us that it has been waiting to sell. Unfortunately, too many over zealous traders and investors had no clue and got caught in another big TRAP! So, where are we now?: As of this post time, again, we have hit our bullish target for now and got an early Christmas Gift. It was uncertain how long the market would take to push up here, but it did so quickly. At this point, the expected pullback has pushed ETH back down significantly. However, this is still NORMAL MARKET STRUCTURE and no need for alarm. A rejection of an H4 Supply Source is most likely to push the market back down to test a higher time frame support. In this case, it is the last Daily Demand Zone (2980 - 3200). This zone was just created yesterday, December 9th, so it's a new area. BUT, we have to expect the market to pull back to the latest Demand Zone to seek support for moving forward. What to look for next?: Now, that we have pushed down near this Daily Demand Zone, we need to go to the correlating H1 Time frame to look for signs that the fall is ending. This Demand Zone is stacked with buyers waiting to buy ETH, but where in this $220 range will they actually start doing it? The H1 will give us a strong indication. $2980- $3040 is the H1 Source within that bigger daily zone, so that is the most likely target. So, look for an H1 BOS UP coming out of this Daily Demand Zone for the sign that the buyers are ready to step in. Once we see that, I'd expect one more pullback on the H1 (this pullback would need to stay within the Daily Zone) and then we can continue marching upwards. What to look out for? The New Daily Structure!: Now, if we get into this Daily Demand Zone and see an H4 close below it, that is a significant problem. Why? Because all the while we have been carrying out this H4 play....the Daily Time Frame has been making its own structure. A. We got a Daily BOS UP on yesterday when we made a new recent high and created this big Daily Demand Zone. The BOS UP was a close above the previous Daily Supply Zone. SOOOO...we could actually be seeing the same market structure play out on the Daily that we have seen on the H4 this past month. With this Daily BOS UP, the market is likely to return to the Source of that Break...the BOS Demand Source (2610 - 2880). That would be an unwelcomed fall, but it is structure! The only thing preventing that is IF we hold this Daily Demand Zone. That's why I mentioned and H4 close below 2980 is trouble. So, from here, we need to "Read" the market and play accordingly. Hopefully, this analysis helps you all as traders or investors to see where we are going and why. Please drop me your comments, suggestions, and other feedback. Also, if you have a favorite pair that you would like me to analyze, I can take a look at it as well. We'd love to help you gain a solid market analysis strategy that can keep you profitable and out of danger in these markets!
On the 9th Day of ETHmas...Continuation and a New H4 Demand Zone
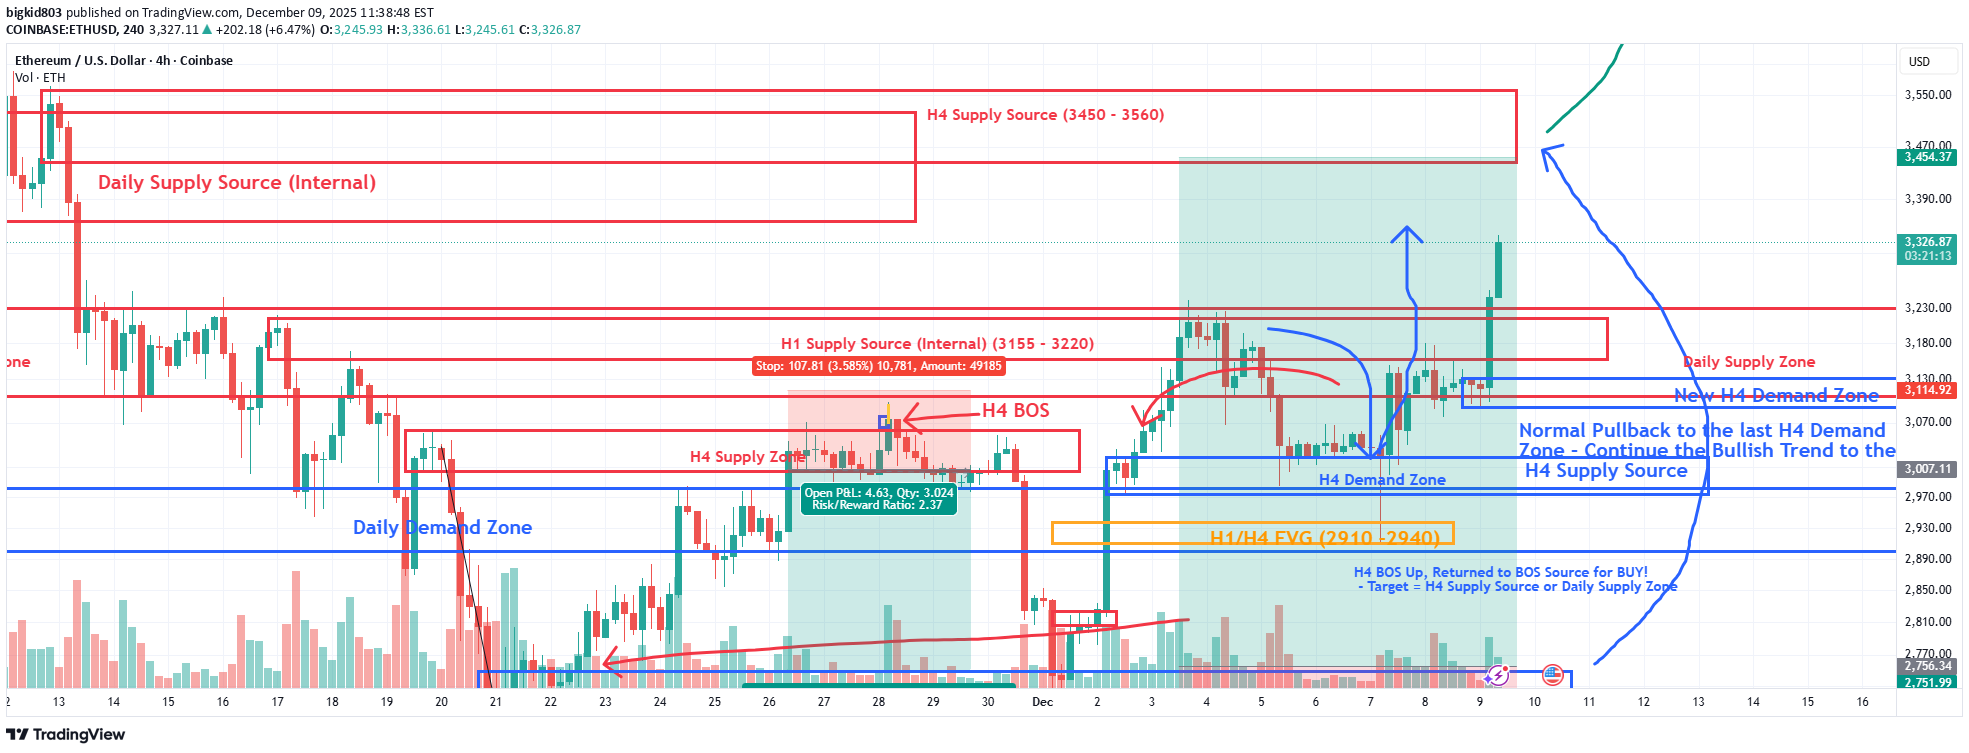
On the 9th Day of ETHmas, my true love gave to me....Continuation of what she has already given me...and a new H4 Demand Zone. Please refer to my previous posts on ETH over this past month or so to see how the market has been playing out EXACTLY as it should. Once again, we have been ignoring the world of Trump News, Microstrategy plans, and every other noisy gong of crypto crashes, tarrifs, etc. We have been focusing on SOLID Technical market structure that I follow and teach. ETH has been following this solid structure and we've endeavored to give you a preview of what to expect, and then followed up with how it actually played out. So what happed in the last few days?: At our last post, ETH was making its pullback to the last H4 Demand Zone. What seemed like another bloody murder episode to many was simply a pullback to gain stronger support for this move up. We had the expected pullback, along with a few strong wicks below this last H4 Demand Zone to take out over leveraged traders. But, when the dust settled, the H4 candle closed above this zone and never showed that we were going bearish again. So...where are we now?: Today, after a few days of consolidating around this H4 Demand Zone, we saw the break out above it and the continuation with the bullish move that started all of this (When we had the first H4 BOS UP on November 28, and the return to the H4 BOS Source on Dec 1). That was the Ultimate Buy Setup on ETH, and projected to take us up to the H4 Supply Source of ~ 3450-3560. So, today, we broke out and continued and are now heading to this zone. What to look for?: As we make our way up, there is still the older Daily Supply Zone (the one that caused the first pull back to the H4 Demand Zone). The top of that zone is ~ 3230. We have broken through that zone, but the top may still need to be retested before we keep pushing on. We need to watch the 15 min chart for any BOS Down structure that would signal that this pullback is coming. Otherwise, we are on the way to 3450 - 3560, just as the plan has been since November 28. Happy Trading, and please leave me your comments. I would LOVE to hear what you all are thinking, hear any challenges or push backs on my analyses, or to just see if you have been following along.
اتریوم در راه بازگشت: فرصت خرید در منطقه تقاضای H4 برای صعود دوباره!
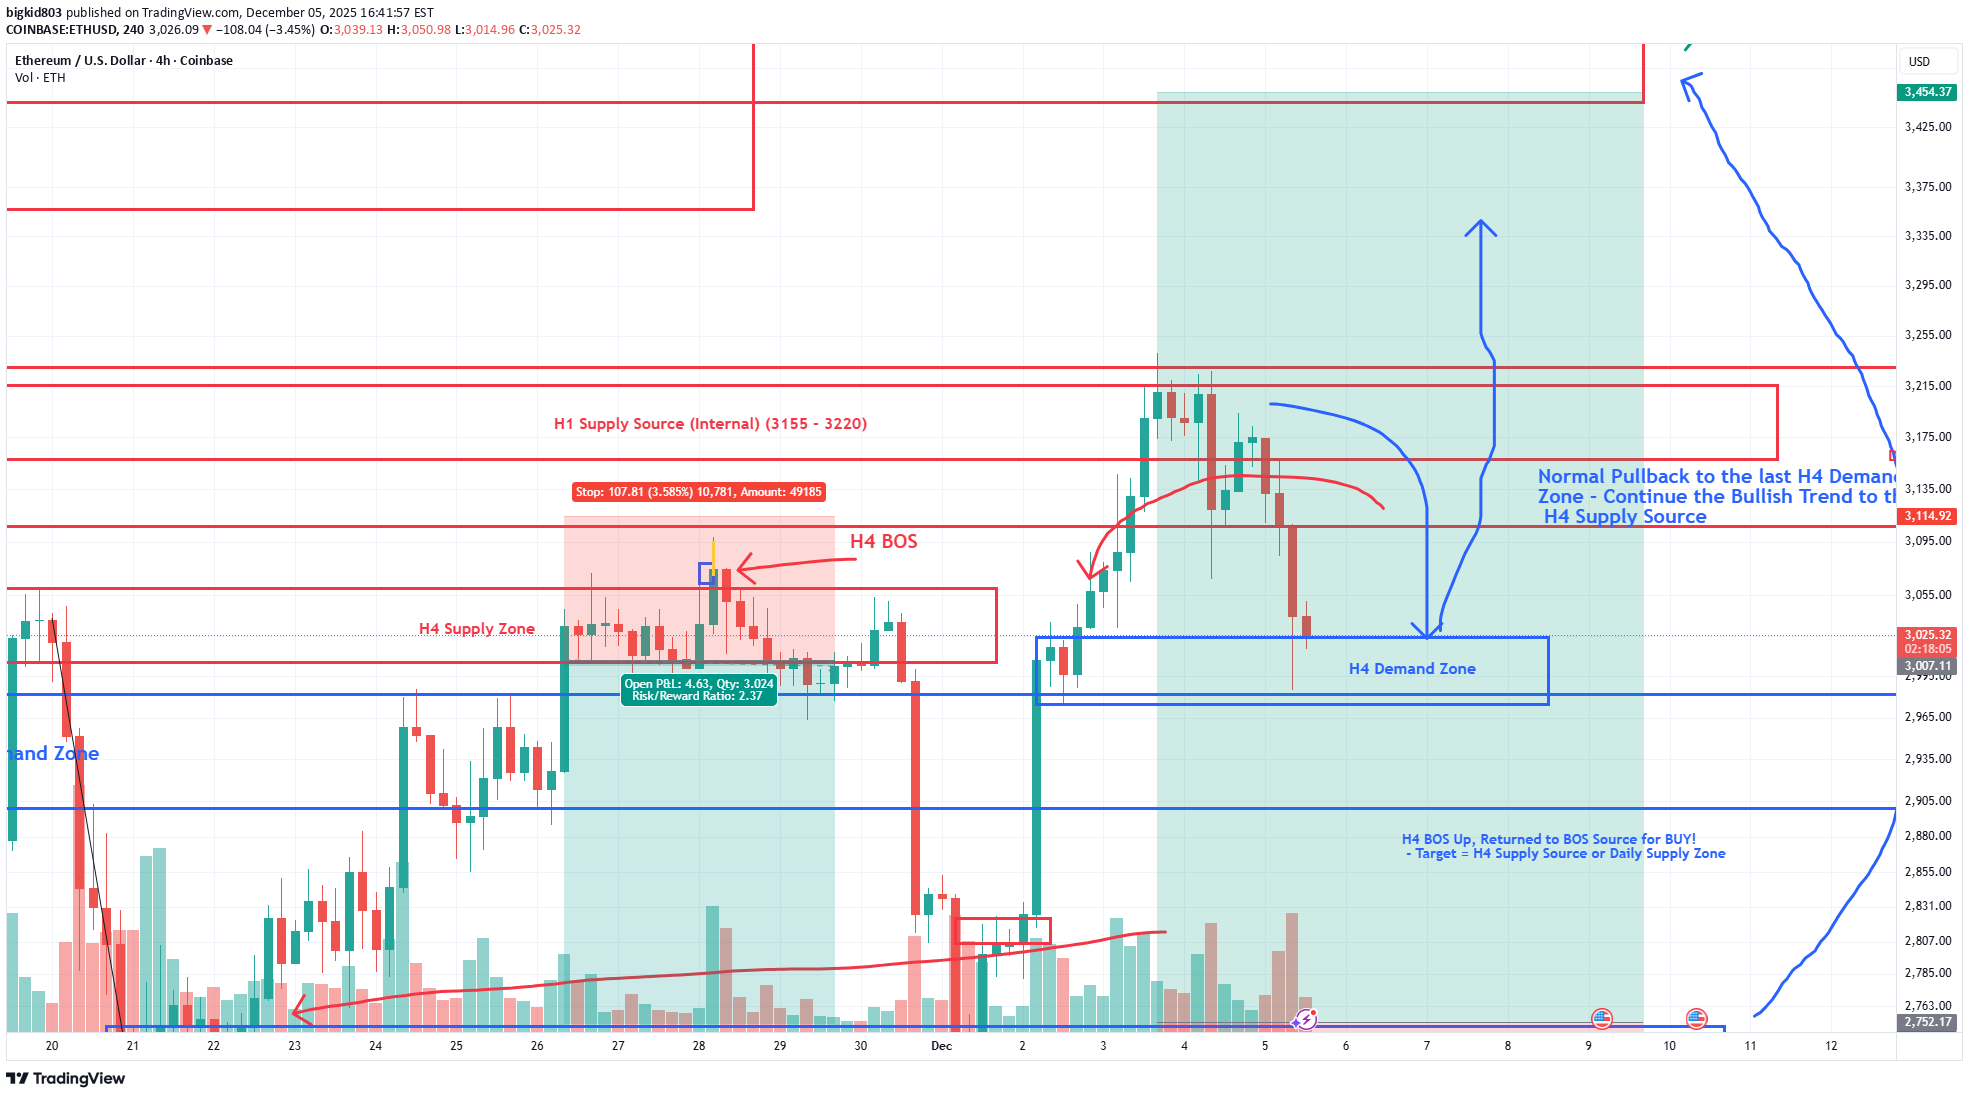
ON THE 5TH DAY OF ETHMAS, MY TRUE LOVE GAVE TO ME....A PULLBACK TO THE H4 DEMAND ZONE.... OK, so our ETH trading plan is playing out as expected. Please see my previous posts from the first part of November until now to see how we got here. Since the last post, we have pushed up to our first TP Target and moved all the way up to the Daily Zone. This is a Daily Supply Zone, so it is expected to show some resistance. Where are we now: At this point, the market is struggling between the H4 BOS UP and Return to the Source that signaled its time to buy again...and this Daily Supply Zone that is saying..."Not so fast...you have to get past ME first". Why This Matters: A Daily Supply Zone is still stacked with sellers waiting to push the price back down. So, it will take some strength from this H4 momentum to break past the Daily Zone. It almost never does this the first time, and is extremely rare to do it without building a solid floor on the way up. All we are seeing right now is ETH pulling back to the H4 Demand Zone. We had several strong H4 bull candles up, and there was not a Demand Zone in place until this one around 2975 -3025. The market HAS to pull back to these type of zones for the strength to continue. What to Expect from here: At or inside of this H4 Demand Zone, we need to see confirmation that the buyers are really ready to push this back up. We need to watch the 15 min time frame and look for a 15 Min BOS UP outside of this H4 Demand Zone, Plus a strong retest and bullish rejection out of the zone. The 15 min will show us this first. Ideally, we also want to see an H4 Candle close back up above this zone and retest as well. With that signal, we are back to the bullish trend and headed for the H4 Supply Source as shown before...(3450 - 3560). Now, the Daily Supply Zone that threw this down to start with will STILL NEED TO BE TESTED AGAIN, so expect more resistance if we push back up to it (3108 - 3215). We need to break through the bottom level first and then retest the top (this recent high of ~3215). A rejection again at this Daily Supply Zone is going to lead to all future Christmas gifts being cancelled. OR a break of this H4 Demand Zone were in now will lead to the same. This is a MUST HOLD area for the bulls now! If this zone fails...."Nobody's Gettin' Nuttin for ETHmas!"
کریسمس سفید اتریوم: آیا قیمت ETH به ۴۰۰۰ دلار میرسد؟
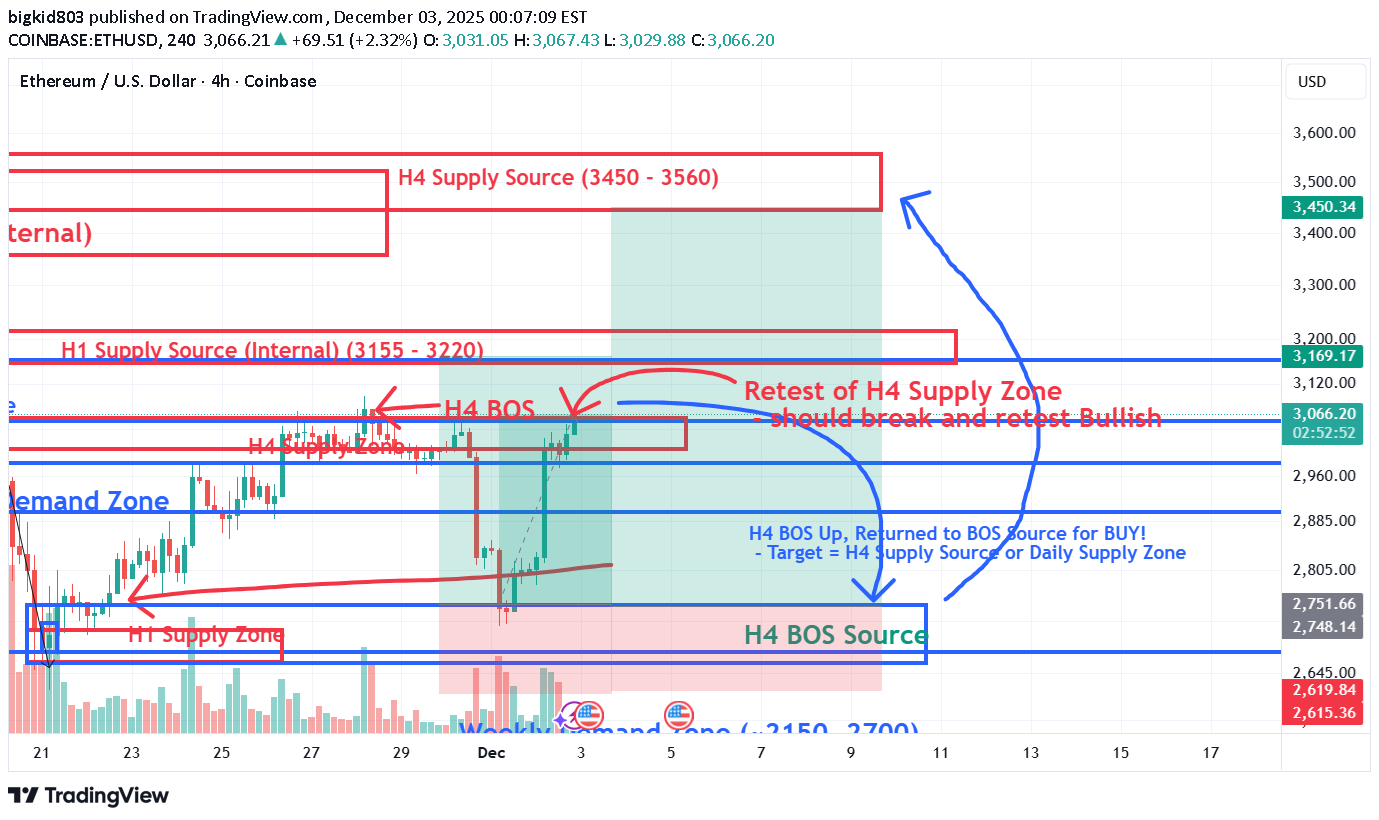
OK, so December is here and ETH has been playing out perfectly. These sharp moves up and down have been all part of the market moving the way the market moves! As we've said before....forget about the talks of Tariffs, Shutdowns, Microstrategy delistings, etc. This market is moving according to solid market structure that we follow and teach. Please see our last Postings on ETH throughout November to see how we've projected these moves almost to a T. Where are we now?: At the last post, ETH had made an H4 Break of Structure (BOS) Up, signaling that we were finally seeing either an end, or at least a significant slow down to this bleeding. As expected, this H4 BOS up was going to drive the price back down once more to the H4 BOS Source (~2650 - 2750) for a strong buy. The market fell exactly to this range, and we saw an immediate bullish response back up. This bull push has led us back up to the top of the H4 Supply Zone for a retest. What to look for next?: Now that we are back to this H4 Supply Zone, many may be expecting another hard slap from the Bears, BUT, the market has already tipped its hand by giving us that initial BOS Up. We returned to the Source of that break for strength, so there is VERY LITTLE chance that this H4 Zone will hold the price anymore. In fact, the next target is the H1 Supply Source (3155 - 3220), which is an internal structure zone that still will not stop the price. The market is headed for the H4 Supply Source (3450 - 3560) for the 1st Real and Significant test of whether the Bull Run has resumed. A Strong test of this area is the determining factor. If we get a break above and retest of this zone, there is literally nothing to stop ETH from returning to the Daily Support - Now Turned Resistance Zone of 4,000 - 4,100. So, Will there be a White Christmas for ETH?: The H4 is pretty much driving the action right now, so any trades should be focused on that time frame until we hit the higher Daily Zone mentioned above. Expect the price of ETH to keep climbing through December, at least up to these zones. It could take a few days or even weeks to make this progress up, but the market has already signaled that it is coming. Shorter trades opportunities should be abundant on the 15 min as the market makes its way up. Look for 15 Min Demand Zones and wait for the pullbacks to those zones to join the trend.
سقوط بزرگ اتریوم: آیا کف قیمتی فعلی پایان ریزش خواهد بود؟
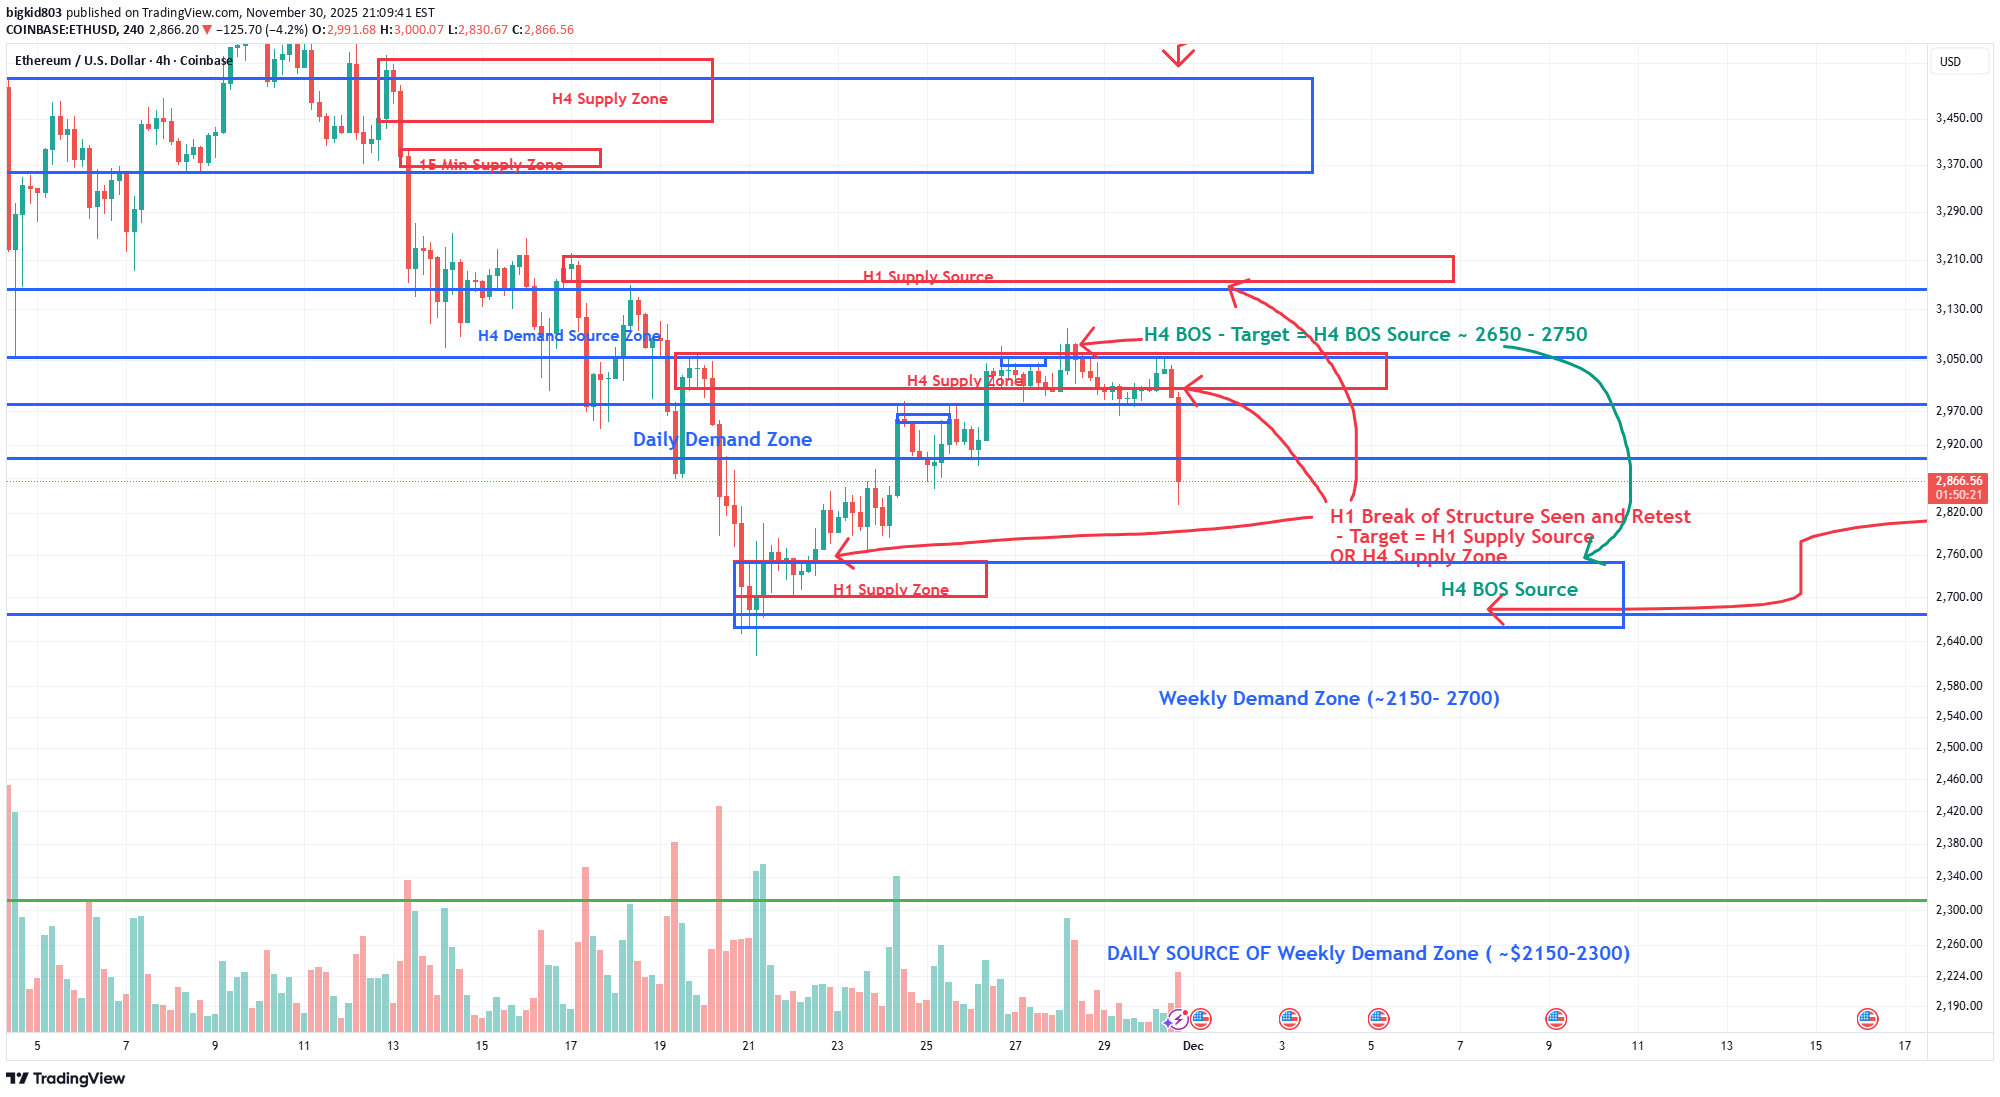
What in the World is going on with ETH, you say??? Well, this is following our market structure almost to a T. See my previous posts on ETH to see how we got here and why the market is moving the way it is. This is Structural Market Making Moves, and has absolutely nothing to do with the News, Tariffs, Fed Reports, etc. What just happened: In the last look, we had an H1 BOS up that led us all the way back up to this H4 Supply Zone. Over the Thanksgiving Holiday and long weekend, the market tried to push up and break out of this zone. BUT...it is an H4 Supply zone, and as mentioned previously, there are a LOT of sellers waiting to sell their ETH here. After failing to overcome those sellers, we have seen the huge rejection expected. What is significant about this move: It is VERY important to note now that during all of this up and down over the weekend, and the ultimate failure to break any higher, we have gotten an H4 BOS Up from the lows....This H4 Supply Zone was broken with a closed H4 Candle. So, at this point we are looking for the market to push back down to the Source of that H4 BOS ~ (2680 - 2750). So, this huge fall we've just seen should take us back down to that area to retest and see IF the overall Fall from All Time Highs is finally over. What to look for: From here, we need to watch as we approach this H4 BOS Source and look for signs on the 15 min that the drop will end there. The H4 BOS could hold, but there is still the prevailing Weekly Demand Zone (~2150 - 2670) that is what is overall pulling the price down. So, this H4 BOS zone is the first attempt to see if the Weekly Zone is satisfied. If this H4 BOS Zone holds and we do not get an H4 close below it, ETH could finally start to regain strength. Otherwise, if this H4 BOS Zone gets broken with an H4 close, then the weekly takes over again, and we're back to looking at the Weekly View. The Daily Source of that large weekly zone is still the target (~2150-2300).
احتمال بازگشت اتریوم به مسیر نزولی: تله خریداران یا شروع پامپ واقعی؟
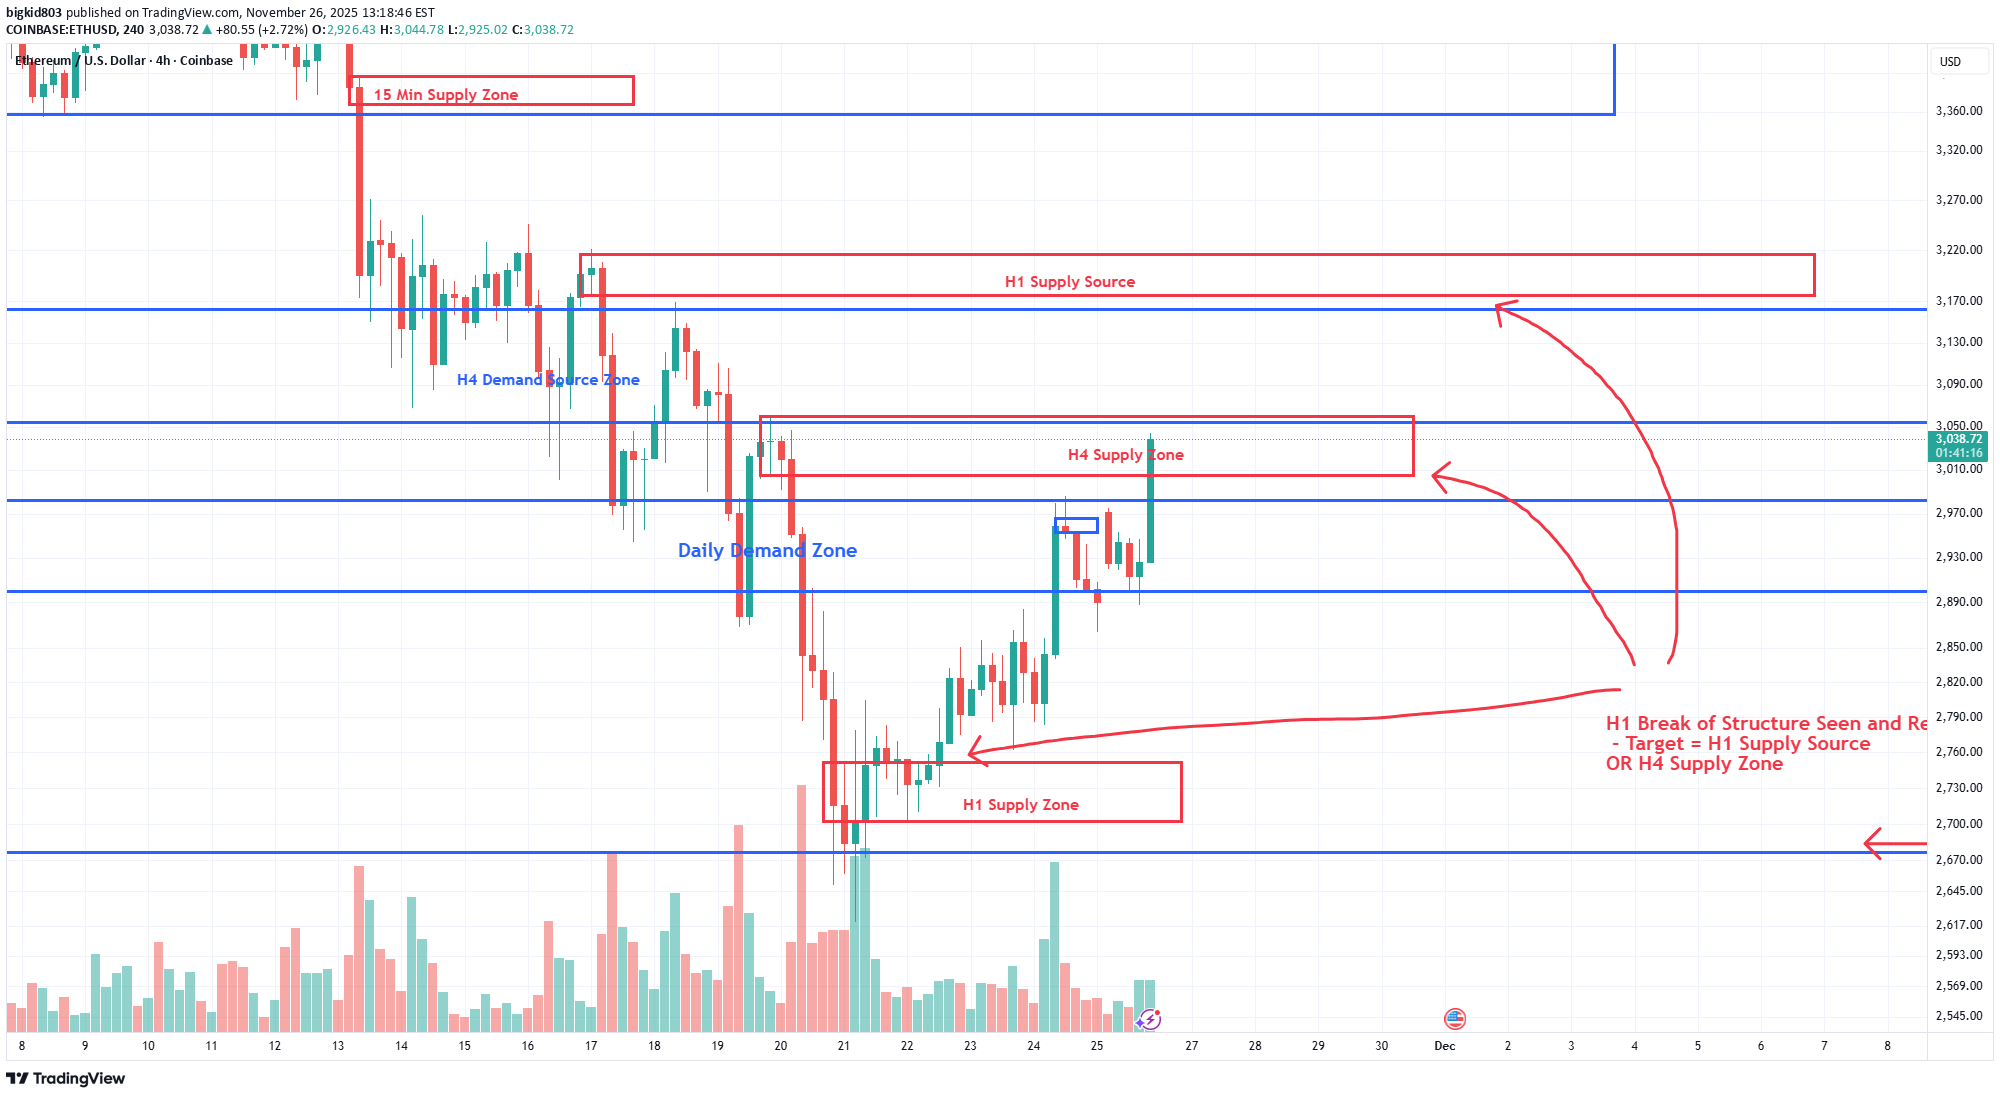
So, ETH has been pushing up quite a bit now these last couple of days, but is this a real pump back up, or is it a TRAP? I'll let you decide. Here's what I see.... As posted previously, we have seen an H1 BOS out of the HUGE Weekly Demand Zone. In fact, it came out of the Daily Source of that Weekly Zone, so this push back up is definitely expected. We have fallen so much and fell down to near the bottom of the Weekly Demand Zone. So, this H1 BOS will nearly always lead to a pullback to the H1 Source of that break, or to the H4 Supply Zone. This is playing out perfectly. We have just pulled back to this H4 supply Zone. So....This is the area to look for any confirmation that the overall sell will continue. This H4 Supply Zone is full of sellers waiting to dump ETH, and it needs to be tested. What to look for here: Inside of this H4 Supply Zone, we need to see a 15 Min BOS down to signal that this whole move was a huge fakeout to trap buyers. IF we see that, look for another fake-out return to the source of that break for the Fall of Falls. What if it doesn't Stop: We are ALWAYS Reading the market, not predicting it. So, if this move up is to continue, we must see a clear break of that H4 Supply Zone. An H4 Candle needs to close above that zone and give us a retest, with a bullish rejection. IF that happens, ETH can keep pushing up to the next target - the H1 Supply Source (3170 - 3200). This is just clear, technical trading, folks, and if you've been following, the market has done almost exactly what it has TOLD us it would do.
اصلاح بیت کوین: آیا این یک فریب است؟ تحلیل دقیق سطوح کلیدی BTC
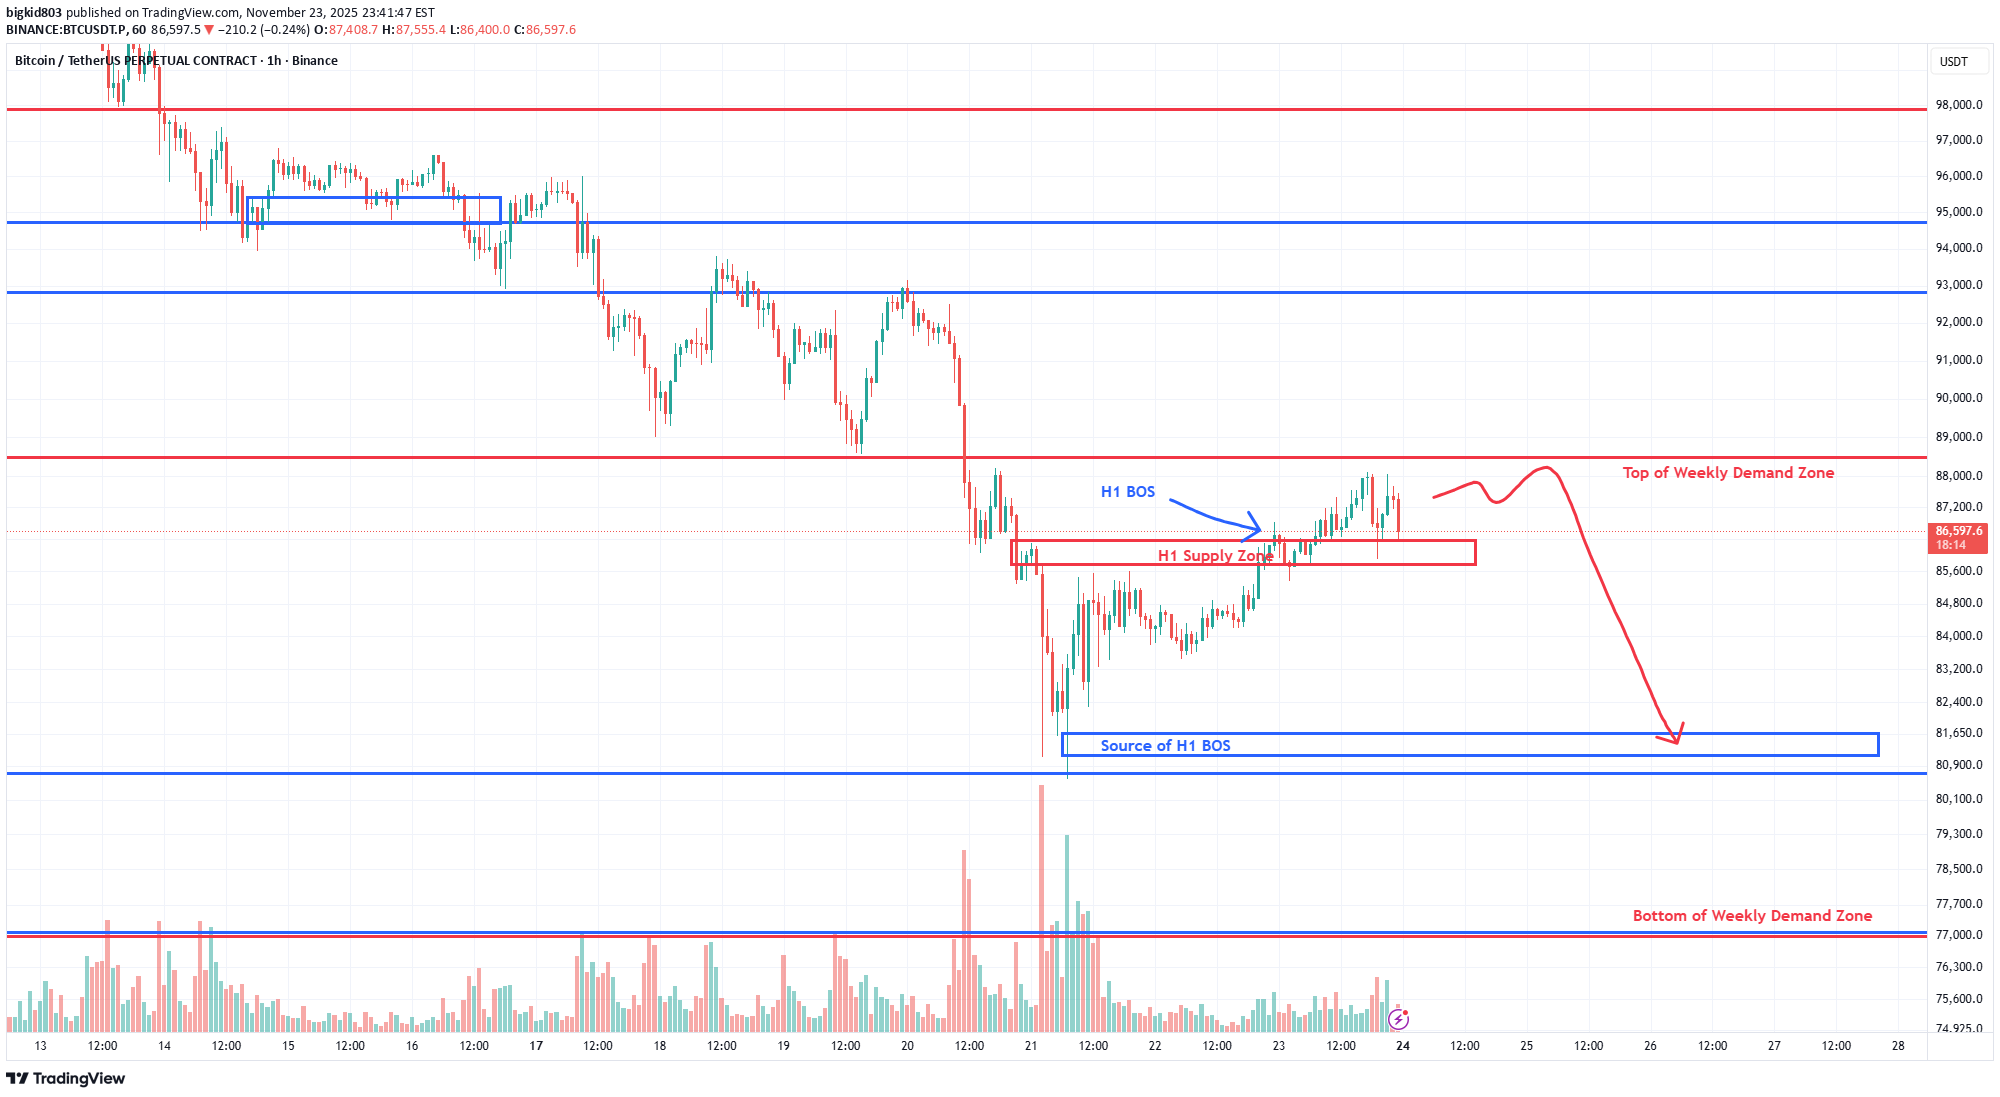
Following up on my analysis of BTC after this weekend and going into this Thanksgiving Week. Please take a look at my previous analyses of BTC after we hit the All Time High to see how I've mapped out this progression to where we are now. We have seen BTC drop down to exactly where we projected....the Weekly Demand Source. And as targeted for our more precise level, it came right down to the top of the Daily Zone of the Weekly Source (~80.6K). Wow! You can't make this stuff up, guys. This is solid thorough Technical Analysis that you too can learn!!! Well, where do we go from here: This review is a closer dive down into the Hourly time frame, where I think we have to monitor the prices for the short-term. We have seen a pullback this weekend that pushed us back up to the top of this Weekly Demand Source. That level is going to have strong resistance again, and I expect a rejection back down into this large Weekly zone. It's important to note this weekend push up, we had an H1 BOS - H1 candle close above 86.4K. I expect that to be retested and see the price possibly bounce between this 86.4 - 88.4K range for a little bit. A close of an H1 candle back below 85.7K will be the sign that it is falling back to the source of this H1 break and back to the Daily Zone of the Weekly Source (80.6K). Remember, we touched the top of the Daily Zone (80.6K), but I don't think that touch was significant enough. There are a LOT of buyers inside of that Daily Zone, and touching it with a wick is not sufficient from my experience. We need to see at least a 4 Hour Candle go deeper into that zone and see a strong bullish rejection. When will we go bullish again: The real sign of the fall being over is going to show up first on the H1, with an H1 BOS outside of that Daily Zone (77K - 80.6K). IF we see that, expect a return to the source of that BOS. From there, the bullish momentum needs to be confirmed on the H4 for the REAL BULL BUY. For now, the higher time frames are still ruling. The Weekly MUST be satisfied with enough volume and activity within this weekly Source. Until then, again, don't get tricked into buying BTC unless you are short-term trading it.
هایپرلیکوئید: فروپاشی بزرگ در راه است؟ رازهایی که در پشت هیاهو پنهان شده!
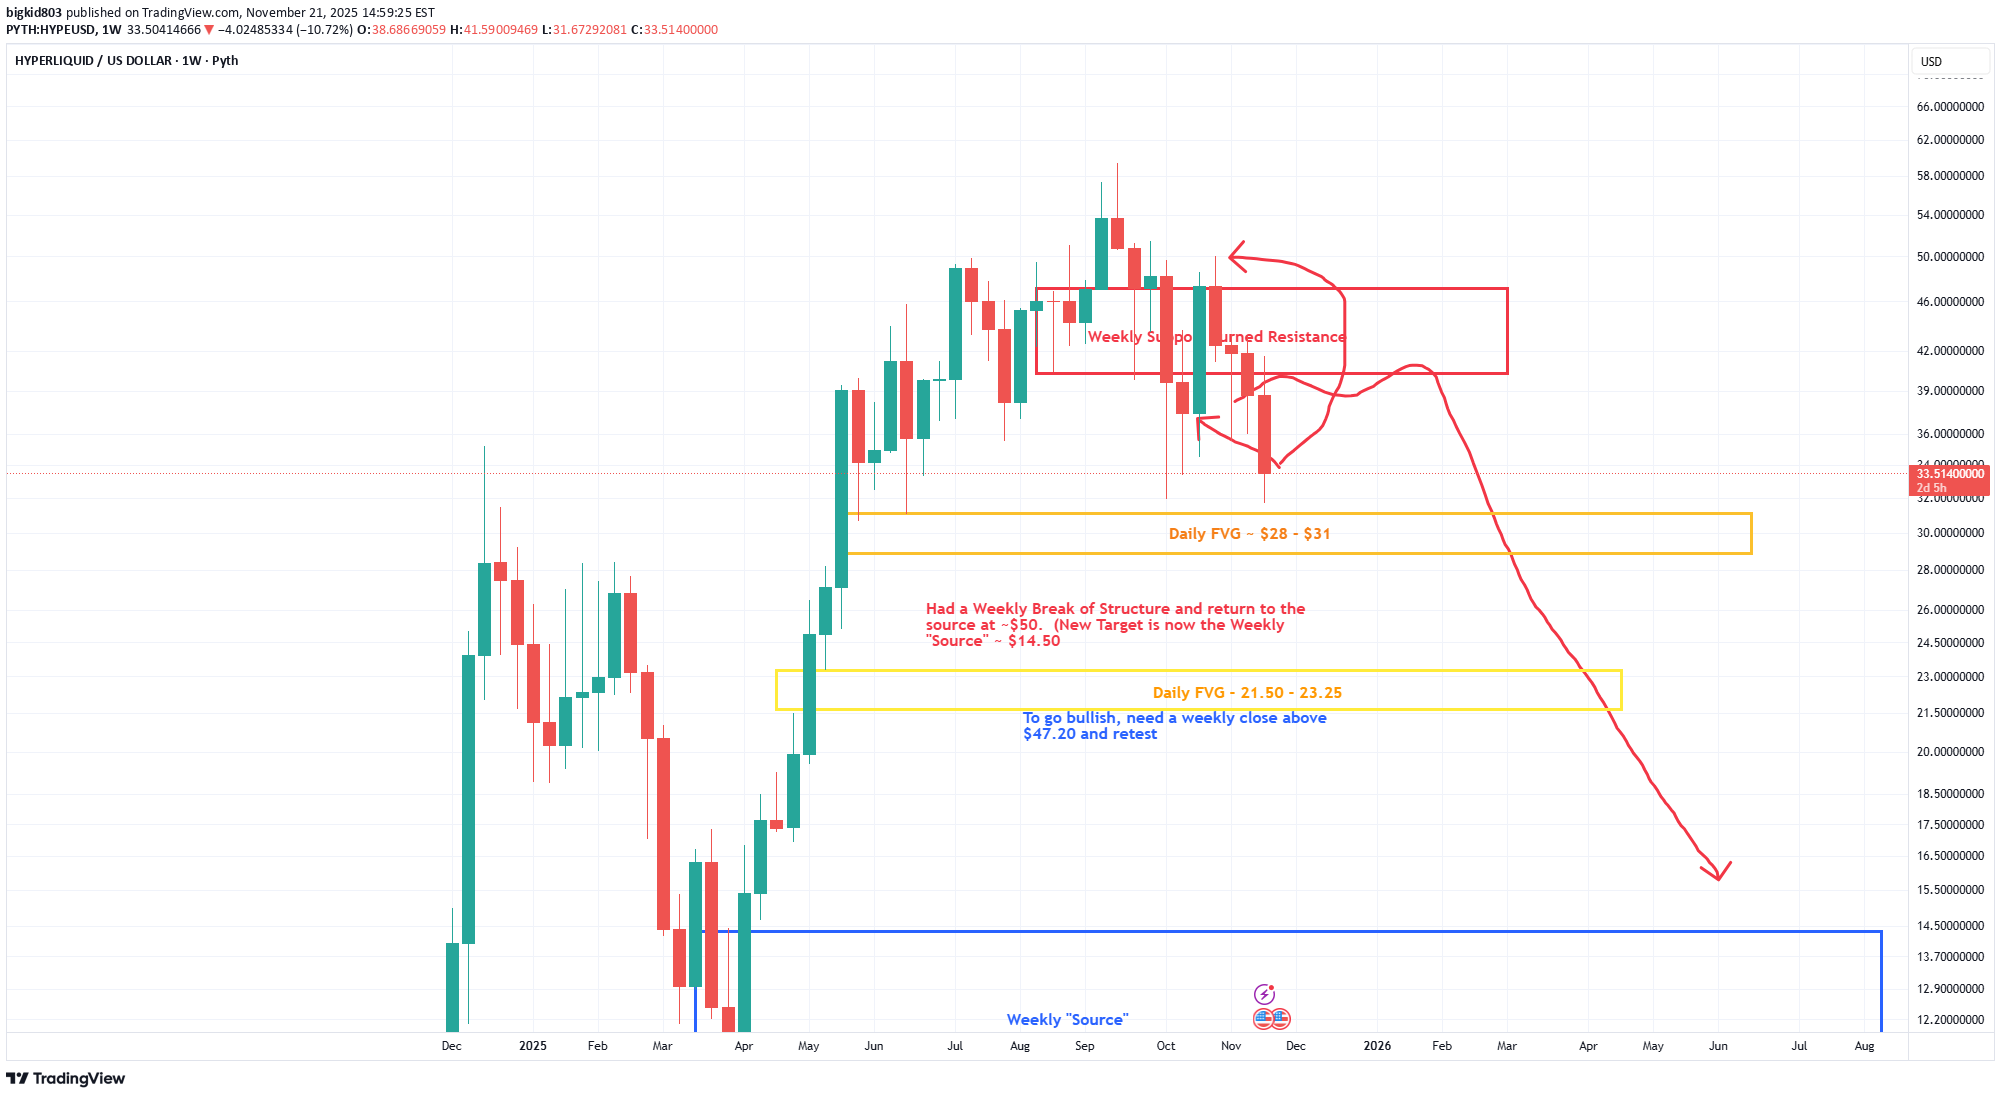
Hyperliquid has gotten a lot of attention with it's Decentralized way of bringing Crypto trading to the masses. But, we've been analyzing this from a technical perspective and there is still too much Hype right now. Please see my previous analysis on this from 11/8/25....attached. The Hype problem continues and we have seen a drop to near a daily FVG zone that is giving a "dead cat bounce". But, this is only temporary, and the target is still the Weekly Source Zone ~ $14.50. That's a hard pill to swallow, but there is not much of anything to keep us from falling that far. There is another Daily FVG around 21.50- 23.25, but that should only be another temporary bounce on the way down. The Target we are seeking is again that Weekly Source zone from ~ $10 - $14. That's a relatively large range, so to fine tune that even more, I would target the $10 - $12, because that is the Daily Source within that weekly zone. So, overall, hold those shorts and ride the coaster down to these levels. Any bullish responses on the way are only the necessary pullbacks to give us the thrill of the fall.
آیا مشکل اتریوم حل شد؟ تحلیل فنی و مسیر صعودی پیش رو!
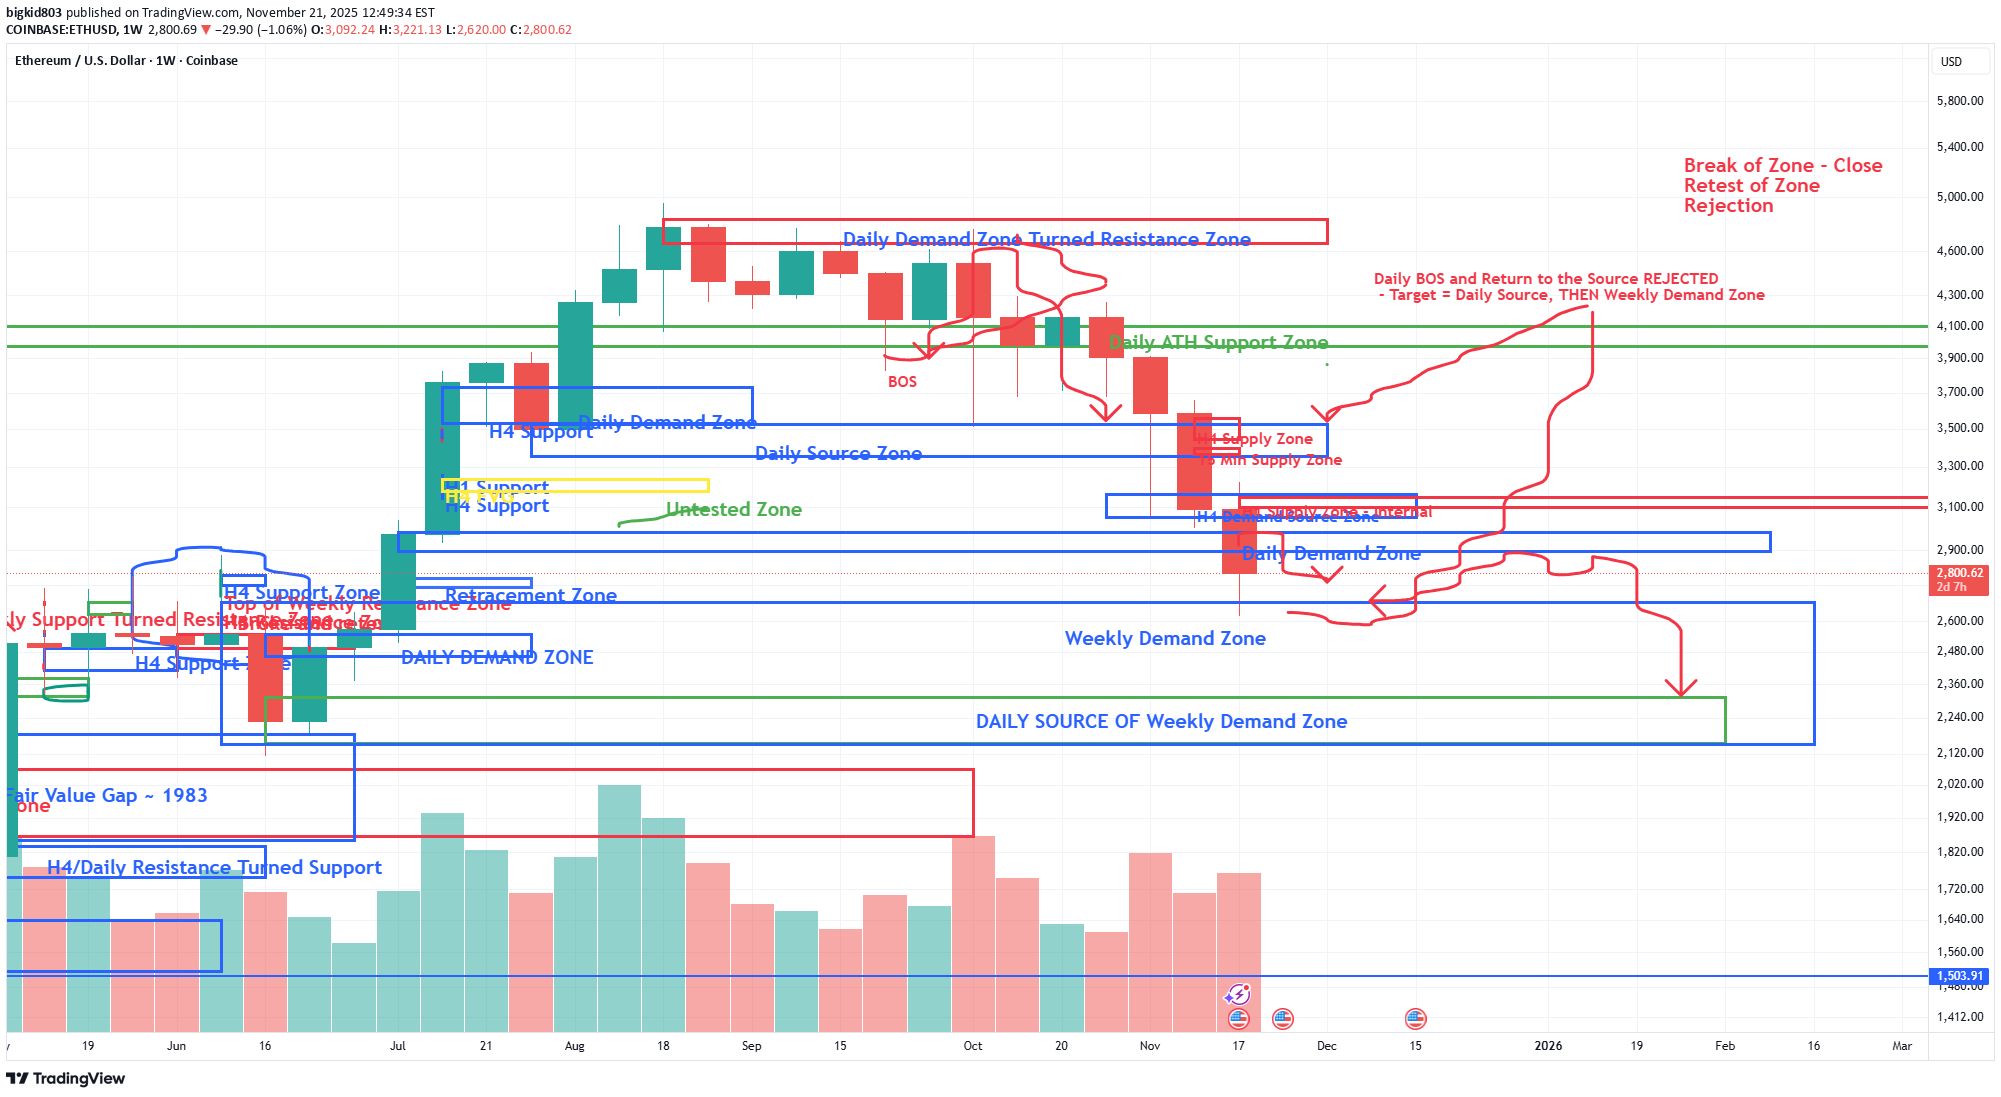
ETH has traded exactly as expected from this last recent high and break down of structure that followed. Please see my last analysis on ETH from 11/11/25. We have dropped down into this Weekly Demand Zone (2150 - 2680), and are now seeing a bullish response out of it as expected. This response is most likely to pull back up to retest the previous Daily Demand Zone (2900 - 2980) and get Rejected. The most likely targe of this fall is still to continue to the Daily Source inside of this weekly zone. The problem is that this Weekly Demand Zone was very large, leaving a wide range of buyers in this area. The most concentrated demand will be inside of the Daily Source (2150 - 2314). This is just the market being the market and following a solid technical analysis structure. What to look for Next?: Keep in mind that the overall market is STILL BULLISH. This so called "collapse of the market, flash crash, crypto winter", etc. is only because we extended way too far from the last Weekly Demand Zone. The price of ETH and BTC pushed too far, too fast, and we are only returning to normal market structure. There HAS to be this kind of correction in the market in order to move forward. So, to resume the bullish case for ETH right now, all we need to see a clear Break of Structure out of this large Weekly Demand Zone on the H4 Time frame. The H4 will be the tell tell sign that the decline is ending. That is most likely to happen within the Daily Source Zone highlighted (2150 - 2314). We need to see a clear H4 Break of the last supply zone and a retest to get out of this 2700 price range area and continue with the overall still bullish trend. Don't be fooled by these bullish responses right now - we are not ready to go bullish again until we see what I described above. Every other bullish pump right now is a trap, and should be traded accordingly.One other possible scenario with ETH on the bullish side is if we see a strong bearish retest of the top of this Weekly Demand Zone (~ 2680) AFTER this current push back up to the Daily Zone. If we get this retest with a strong bullish response again from 2680, we could continue. That is not the most likely scenario because there is still too much "Demand" down around $2300, but it could play out with ETH at these low levels.
Disclaimer
Any content and materials included in Sahmeto's website and official communication channels are a compilation of personal opinions and analyses and are not binding. They do not constitute any recommendation for buying, selling, entering or exiting the stock market and cryptocurrency market. Also, all news and analyses included in the website and channels are merely republished information from official and unofficial domestic and foreign sources, and it is obvious that users of the said content are responsible for following up and ensuring the authenticity and accuracy of the materials. Therefore, while disclaiming responsibility, it is declared that the responsibility for any decision-making, action, and potential profit and loss in the capital market and cryptocurrency market lies with the trader.