
bhx10
@t_bhx10

What symbols does the trader recommend buying?
Purchase History
پیام های تریدر
Filter
BTC 2025
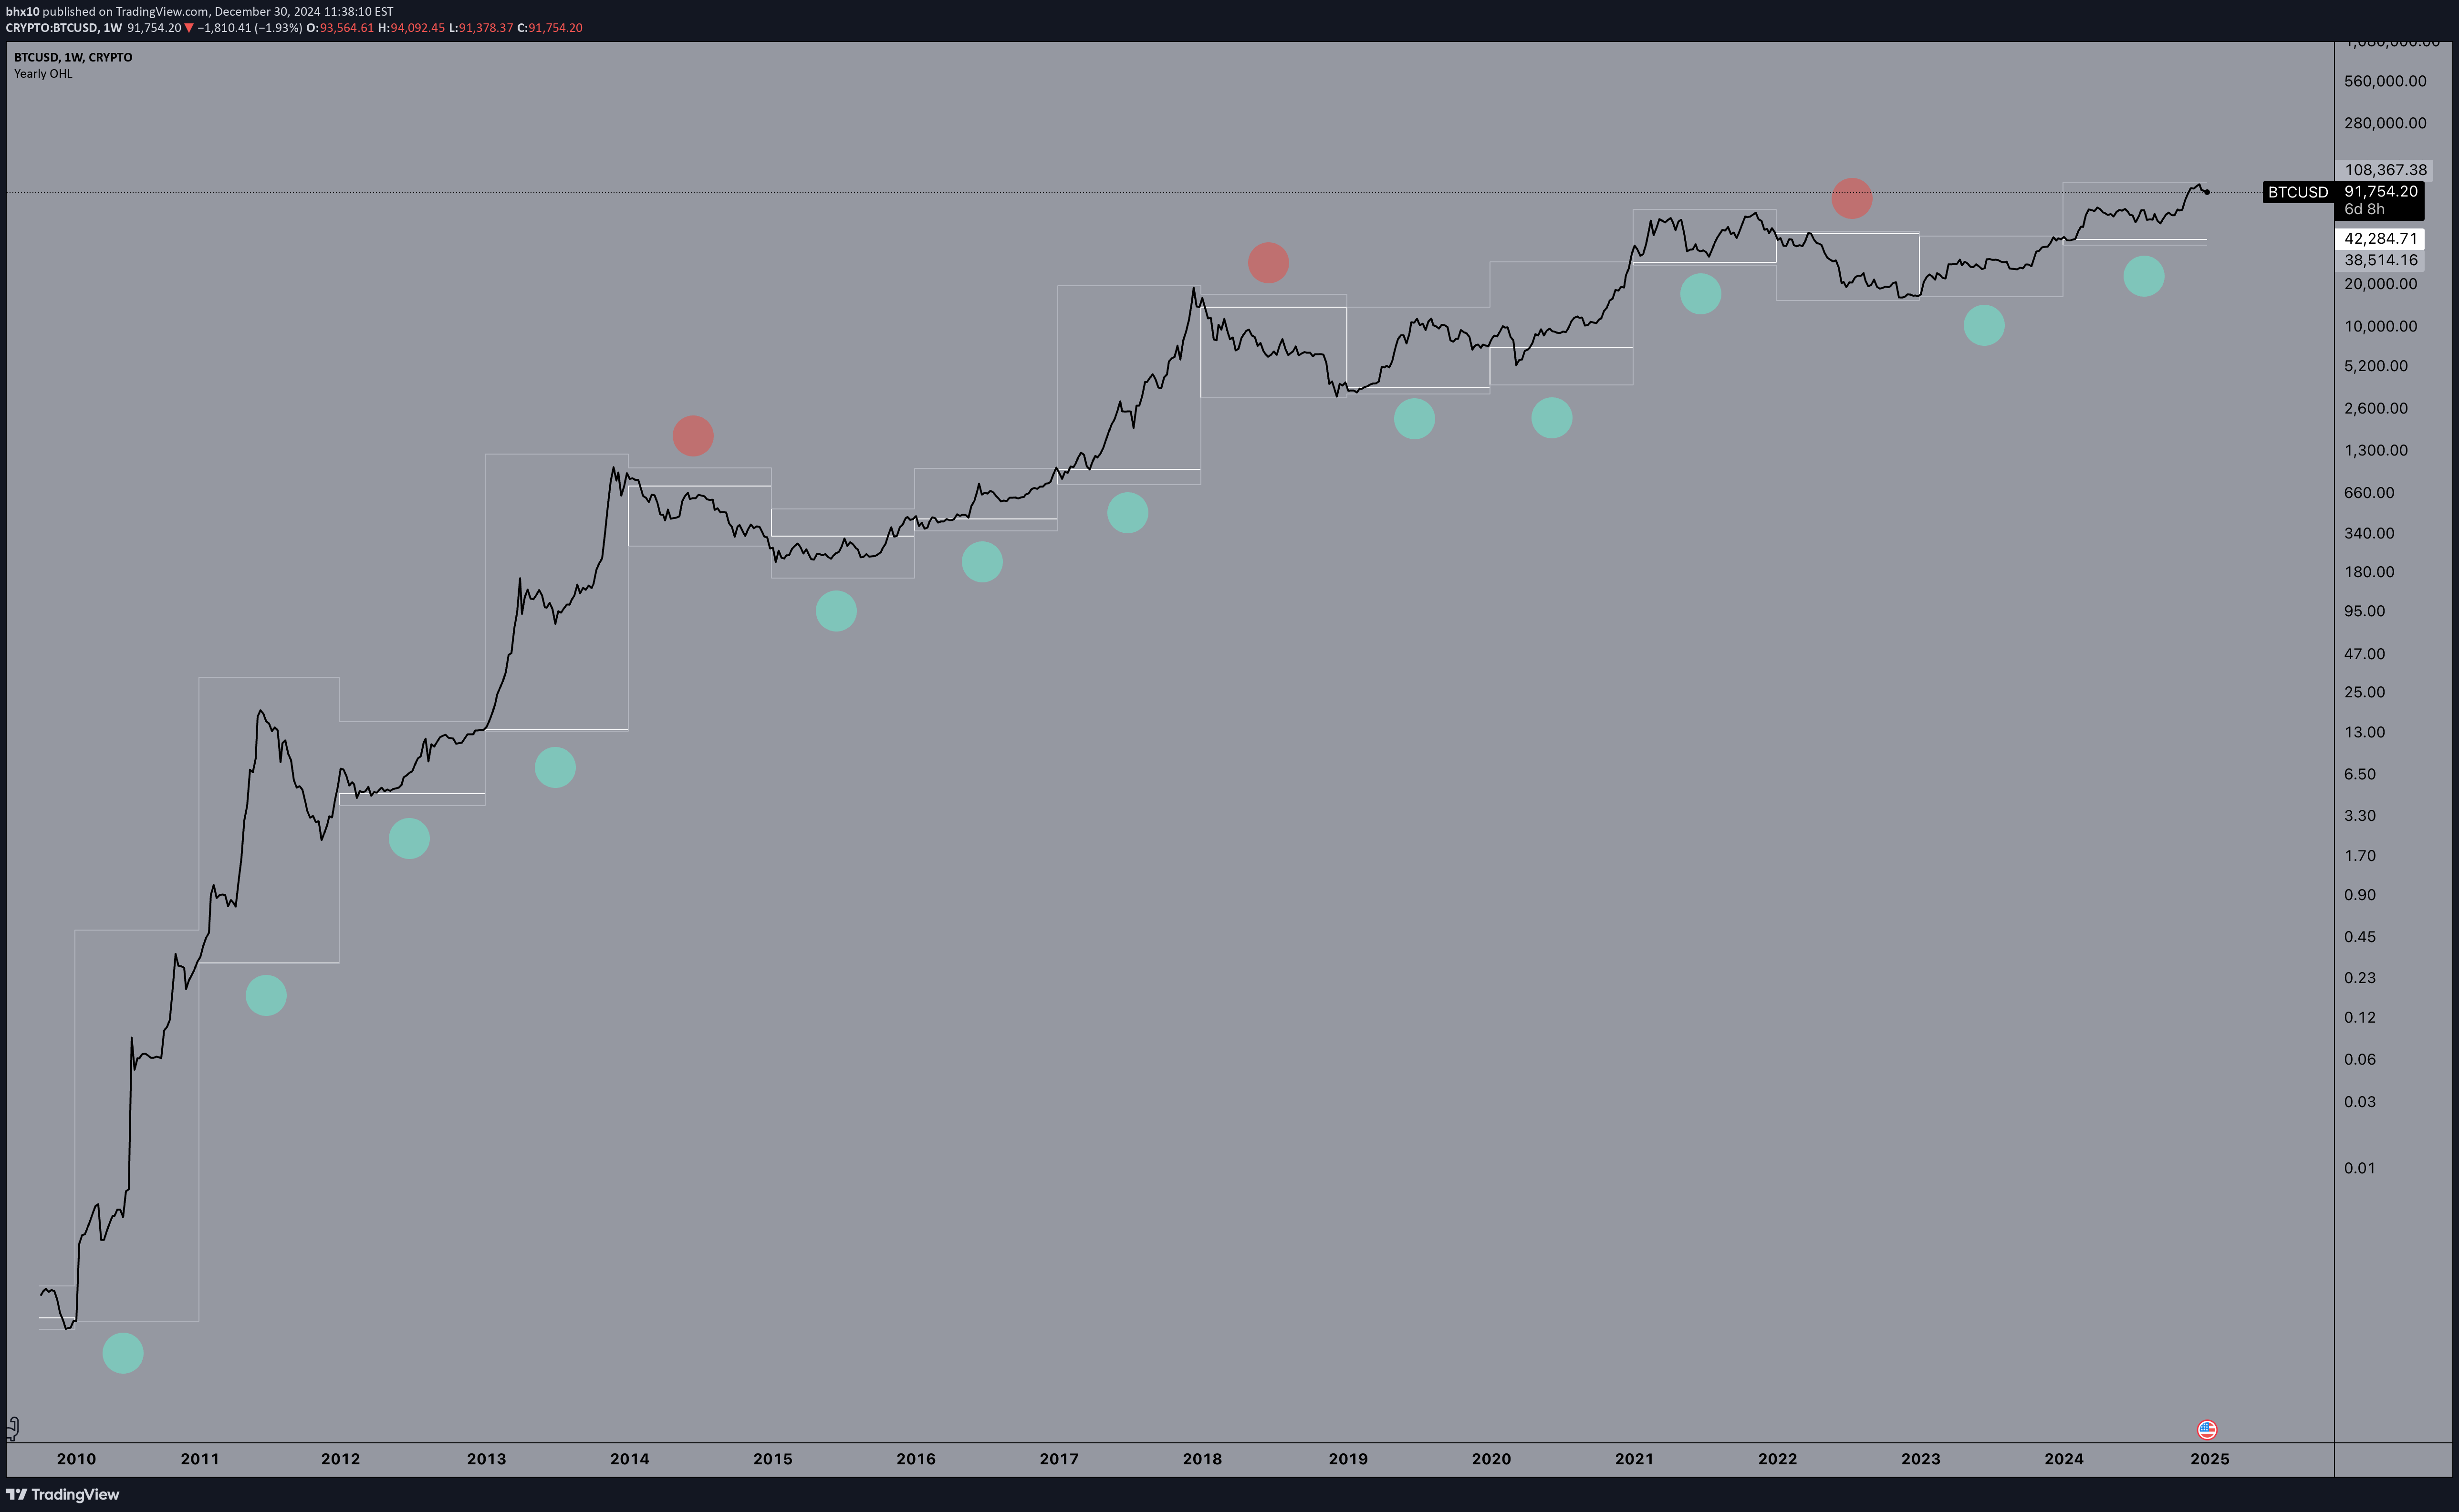
I have plotted the yearly OHL. White line shows year open. If you think BTC is bullish then you buy the year open and hold till EOY or hodl till your heart desires. Alternatively you could gamble and wait for a dip below year open and buy then. Or perhaps you can wait till there's a dip below year open and then wait for a reclaim back on top of the year open level to start bidding. Regardless I see a strong bull trend:12 years of buy year open and hold till EOY = positive return 3 years of buy on year open and hold till EOY = negative return 2015 is an outlier but despite the heavy drawdown the year end gave a positive return. The probabilities are very skewed and its pretty crazy how complicated we make the LTF analysis and forecasts where the simplest of strategies garners significant gains. The years following a halving year (2013, 2017, 2021) all have a 100% hit rate of buy year open and hold till EOY. Those years offered a very positive return and marked the top of the "cycle" being followed by a down year. My personal opinion is you either buy now or buy higher later. We might look back in a few years and lament on how we had so much time to buy sub 100k. Alts see a similar pattern. The beginning of the year is crucial in determining what lies ahead.
SOL Bottom

SOLUSDT Based purely off technicals SOL looks to be bottomed or very close to one. 130 support 126 previous year (2023) high Solana bottomed after 8 straight down days on Aug 5th and has experienced the same just now Anytime Sol has suffered 5+ straight down days it has typically marked a local bottom or THE bottom12H, 50 period MA speed showing a bottom Vertical blue lines marking extreme down days exhaustion.This MA speed (50 period on 12H) is a interesting RSI alternative and we are at the bottom bidding zone. - - - Right now Sol is heavily shorted yet price has simply come back to previous major support zone. There lies liquidity (Longs SL's) below the 110 wick from Aug 5th but hard to know if it wants to get left alone or retested. Lots of Liquidity is at 141, 146, and 164. Solana Breakpoint coming up on Sep 20th and will pique interest. Perhaps its a sell the news if we see any sort of rally in SOL. Key economic data coming early this month along with the start of rate cuts are key to watch. I will be looking for some bids soon but could take a while for any sort of major movement. All I see is a decent RR area right here.
Possible ETH Recovery

Yea ETH is getting dummied and chewed up all over the timeline and on the charts. It is still underperforming BTC and SOL. However, amidst all the FUD it has an ETF and some diehard users. ETH likes to die, come back to major support, then slowly grind higher.The market is a discounting mechanism for participation. Everyone wants to sell ETH or short it and I don't see or hear many ETH bulls nowadays. This leaves a strong asymmetric opportunity for the bulls if there are any left. A move down to take out longs SL below 2500 and push to 2300 is not out of question but this fractal from JAN 2024 sums up my idea on where ETH might head towards in the coming months. There is a lot liquidity at the major sell off levels that typically gets tested or filled.ETH is in a major downtrend no doubt and the berus are winning. But something has to give and right now the RR is skewed far more towards the longs and bulls imo.Most obvious bear case that everyone is calling for. Time will tell which happens
BTC RECLAIMING 200D MA

Last time BTC reclaimed the 200d MA it was around this time last year after a couple of months of sideways chop boringness.Price broke out and held above the 200d for a couple of days before the absolute piss missile green dildo and up only.I have zero idea on what's gonna happen next but I remain a bull.The monthly flipping bullish and creating a massive buyers wick. Holding above 200d failing to close below.Zoom out and see the big picture.
BTC x YIELDS

This is the first time BTC has gone through a halving event where yields have been HIGH. The past 3 halvings yields were LOW and then slowly rose until there was a local top in yields. This time is different... Looks like yields are about to fall of the cliff and reverse down. The DXY is about to fall. Foreign currencies getting bid up. Frankly IDK if a decline in rates makes it a bullish scenario because what this shows is anytime yields go lower BTC goes into a bear. But based on principles of looser credit in the system with lower yields I think it is likely a very bullish environment for crypto. I remain bullish and you should too. Trillions in debt need to be rolled over and that cannot happen at high rates or without increased liquidity. Black - BTCBlack - TLTGreen - US10YVertical Blue - Halvings Have a good day. Was using this chart layout to analyze this instead of my usual ocean blue but enjoy the rare lightmode
BTC/ DXY Resemblance

BTC and the DXY dollar index showing an uncanny resemblance. What do you think happens next???BTC chart here is inverted to give a different perspective. Market does not like uncertainty. And today after Jackson Hole JP we got a little more certainty.Euro, pound, yen, and lots of other currencies gaining strength against the dollar. Equities gobbled up the Aug 5th dump, NVDA earnings next month, crypto lagging?????I have a good feeling about what happens next...
BTC Bears in Disbelief (BULL PROPAGANDA)

BTC has failed to close below 58k on the weekly for 3 straight weeks. It will be 4 straight weeks if this weekly candle closes green.There are signs this was the bottom:1. Huge volume spike with lots of liquidations on the Aug 5th Japan carry trade unwind dump2. Equities V shaped recovery from the Aug 5th dump3. BTC barely touching 50k, bouncing hard from the dump creating a huge weekly wick, and staying above the 1 year MA (52 week MA)4. I saw countless people on X calling for the wick to be filled, more pain ahead because of that huge volume spike on the dump, and lots of calls for 30k to 40k BTC5. I also listened to a few twitter spaces with people saying there was definitely more pain or chop ahead6. Then I saw lots of people shorting on the timeline and in the discords I'm in7. DXY dumping while foreign currencies strengthen8. Lastly the fear and greed index had not been this low since Q4 2022 (the bottom)Markets are not easy. The market does not let a lot of people, in this case shorts wanting 40k or 30k BTC, be right. This low volume and low volatility all of August is to bore people out of getting positioned. We could see the wick get filled but that does not always HAVE to happen.Max pain is speculators (open interest) not positioning before the pump on this recent consolidation and then fomoing later on when price is above 70k adding more fuel to the fire.This will leave people who are sidelined left to buy in higher, causing price to go up, and those who are short to get liquidated or forced to buy back, which also causes price to go up. More fuel. Anyone continuing to short this pump would also leave them to be juiced as price grinds higher from them closing their positions.Global liquidity has risen higher and this is the halving/ election year.Recession talk and moving average death cross yap is all FUD from midcurving morons. Those who buy, hold, and DCA will continue to be rewarded and have been rewarded. (Look at those who recently got their BTC back from Mt. Gox)The top is not in I expect that to come Q4 2025 perhaps. We will see. I could be wrong or I could be right. No one can predict the future.Thanks for reading this latest installment bull post after BTC has gone up a small amount.
A Swinging Market Retesting Sell Offs

BTC, ETH, SOL, alts, and most assets like to swing up and down moving from liquidity zone to liquidity zone. Whales need price to come to these areas of interest in order for them to put on their large position sizes without getting clobbered from slippage and large spreads. They take out the areas where large orders sit then price reverses or finds support/ resistance. Here I have shown where large sell offs happened and the consistent retesting of such levels.There remains a lot of liquidity up above 60k and prices left untested. Idk when but I am aiming for 64k and 69k then a breakout eventually. A retest of 52k ish is not out of the question but we look to be in a similar spot as we were back in early May before a breakout back to the range high (70k) A true invalidation is if price breaks down further than 50k and begins to hold below it. The volume has been low this past week with very choppy price action and lull periods. A major move in either direction is still in question. BTCUSDT
PEPE LONG

PEPEUSDT Invalid if it breaks below the Aug 5th capitulation. Same playbook as the past two previous times it got sold off. Bears are noise. Chart says all. Good RR, good probabilities, easily manageable risk, and can accept both outcomes. Ignoring the chop and remaining patient. A large swing in one direction is followed by an opposite swing back. That is how markets play ball. Lots of liquidity resting above after taking out liquidity below. Has come into the golden zone and is currently sitting above the .5 level on 4H. Similar amount of time spent distributing at the top as it has been accumulating down here at the bottom. Once it breaks out it should be rapid as there is not a lot of volume done in between these ranges. I am expecting a push back into the previous sell off level.
ETHUSDT Bearish or Bullish?

ETHUSDT ETH is definitely the weakest of the 3 majors (BTC, ETH, SOL)However, I am seeing way too much bearishness on ETH, which is warranted due to its piss poor price action, but that does not mean it is going to teleport down to sub 2k. Signs of over bearishness: - OI divergence and finding support at previous areas (price is lower but OI is the same as it was back in April and May 2024) - Funding rates in the negatives or near zero (more shorts than longs) I do not believe ETH will moon or out pace BTC or SOL. But I do think this increased bearishness has swung too far in one direction and when that happens it typically swings back hard in the other direction. ETH definitely needs more time to stomach this recent sell off but even if it retests 2200 again I think a bottom is close or in. There is more liquidity sitting at prices higher above. I expect ETH to eventually take out 2900 and then come back to 3300 and 3500 by at least EOY. Let's see what happens. Good luck to the shorts heading into election season.
Disclaimer
Any content and materials included in Sahmeto's website and official communication channels are a compilation of personal opinions and analyses and are not binding. They do not constitute any recommendation for buying, selling, entering or exiting the stock market and cryptocurrency market. Also, all news and analyses included in the website and channels are merely republished information from official and unofficial domestic and foreign sources, and it is obvious that users of the said content are responsible for following up and ensuring the authenticity and accuracy of the materials. Therefore, while disclaiming responsibility, it is declared that the responsibility for any decision-making, action, and potential profit and loss in the capital market and cryptocurrency market lies with the trader.