
bcd1
@t_bcd1

What symbols does the trader recommend buying?
Purchase History
پیام های تریدر
Filter
Signal Type
bcd1
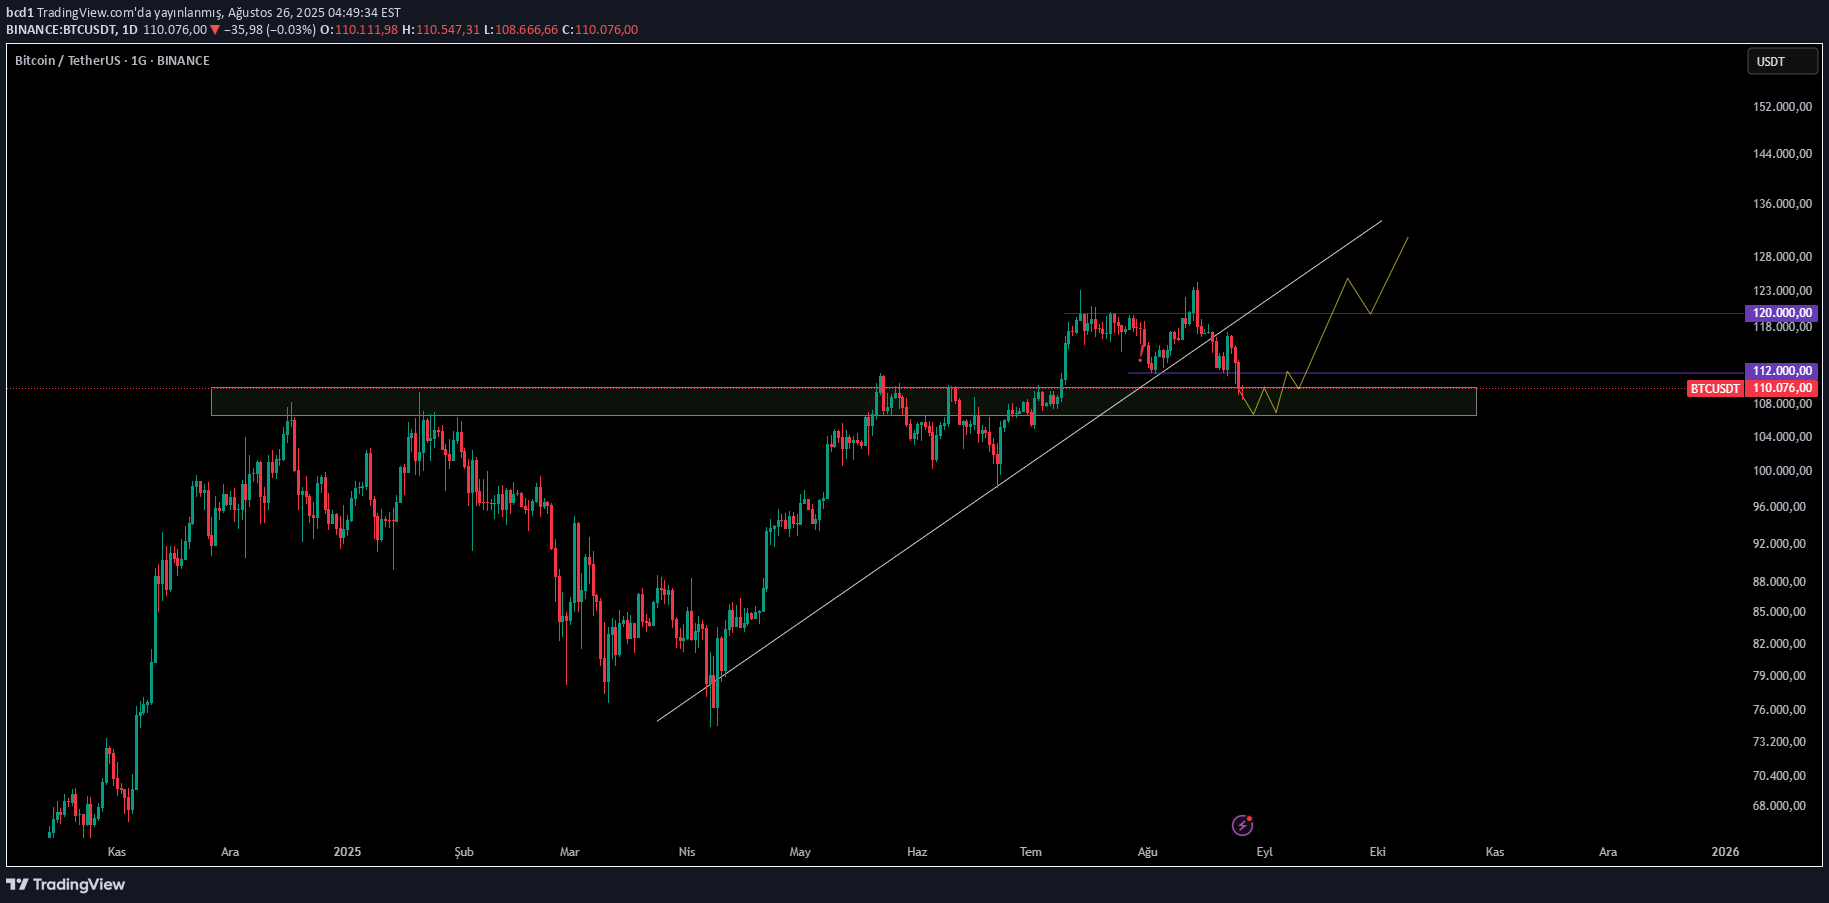
The scenario I mentioned in my previous analysis took place and looking for the market bottom level. In this process, volatil movements are quite possible. After the foot candle, I consider the accumulation phase to be experienced as the opportunity to purchase. The price of the price is an indication of the continuation of the downward trend. Of course, it is not possible to know the exact bottom level; However, we can determine that the market is going to accumulation. Therefore, instead of trying to capture the bottom for purchasing with minimum risk, it would be a more reasonable strategy to take a position when the price switches to horizontal movements.
bcd1
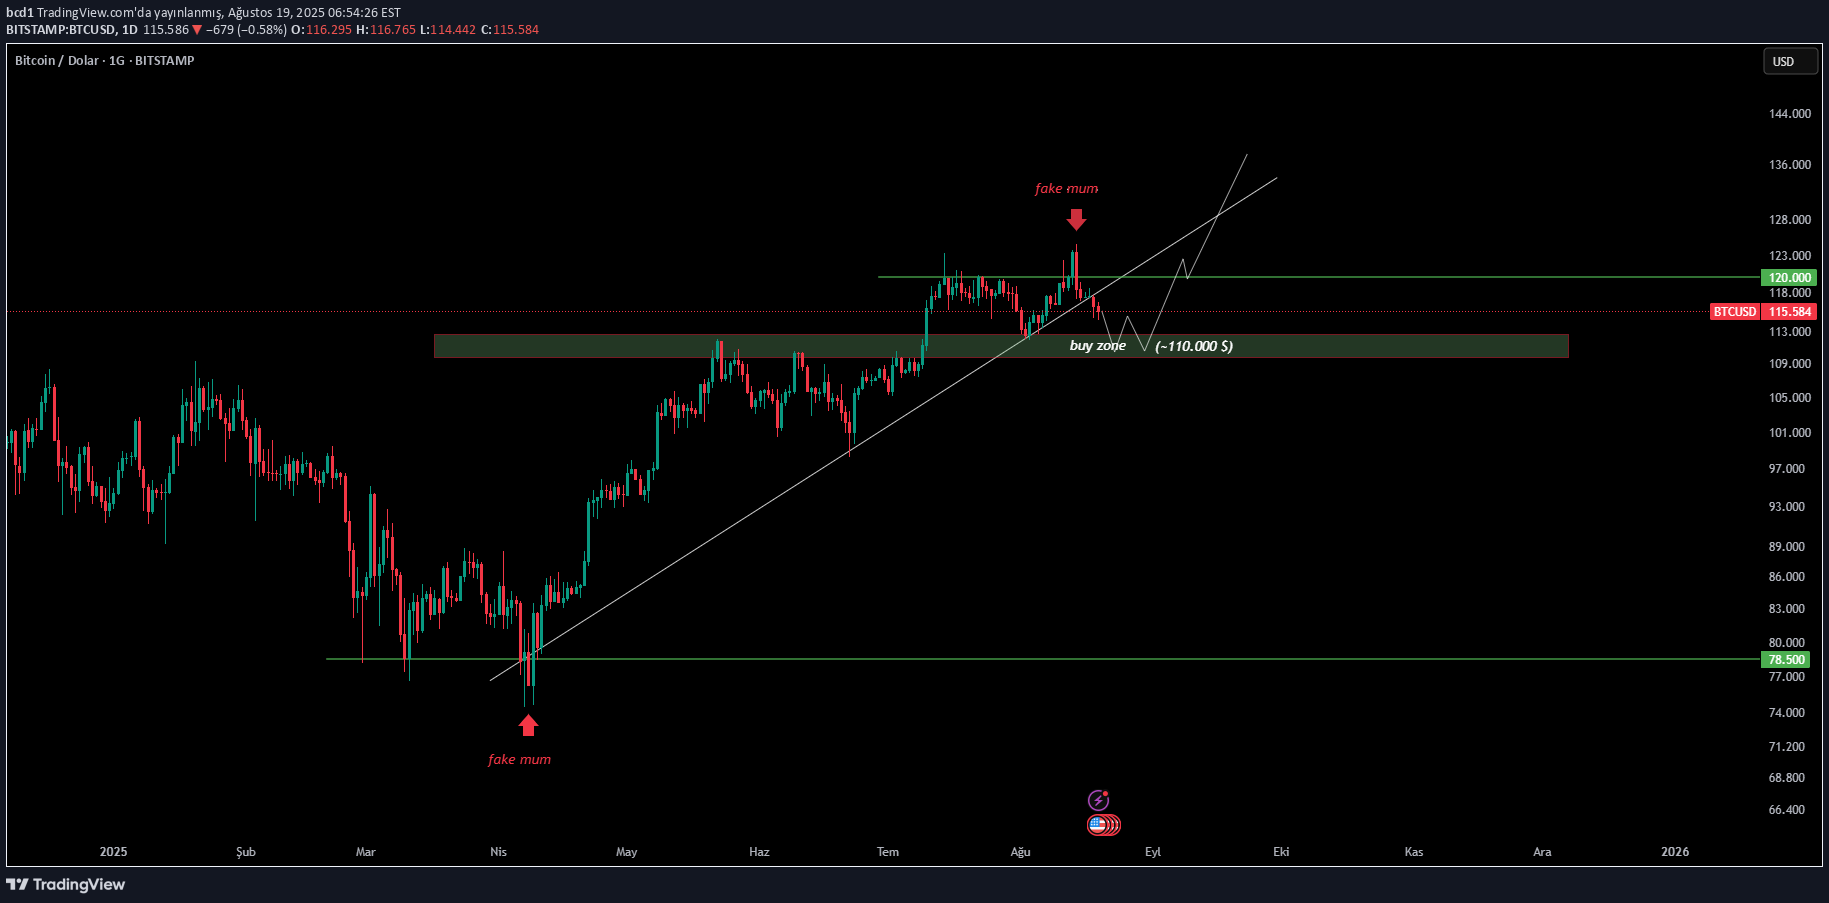
As I mentioned in my previous analysis, the 110,000 USD level is a good level for purchasing. In the graphs, they are voluminous red candles that I mean by “fake candles .. These candles are usually the pioneer of short -term trend changes. I mean the transition from the decline to rise or rise to decline; The possibility of entering the market on the horizontal train should also be considered. My expectation is that it enters the accumulation phase after finding the market bottom level. The purchases to be made at this stage will be healthier. Breaking the rising trend increases the risk. When the price reaches 110,000 USD levels, the downward fake movements will be a natural requirement of the accumulation phase; However, the breaking of this level brings the market to a completely different dimension. It's too early to talk about it. The market is almost left to move from the rising trend to the accumulation phase. I think that the purchases to be made at this stage will be profitable in the short and medium term.
bcd1
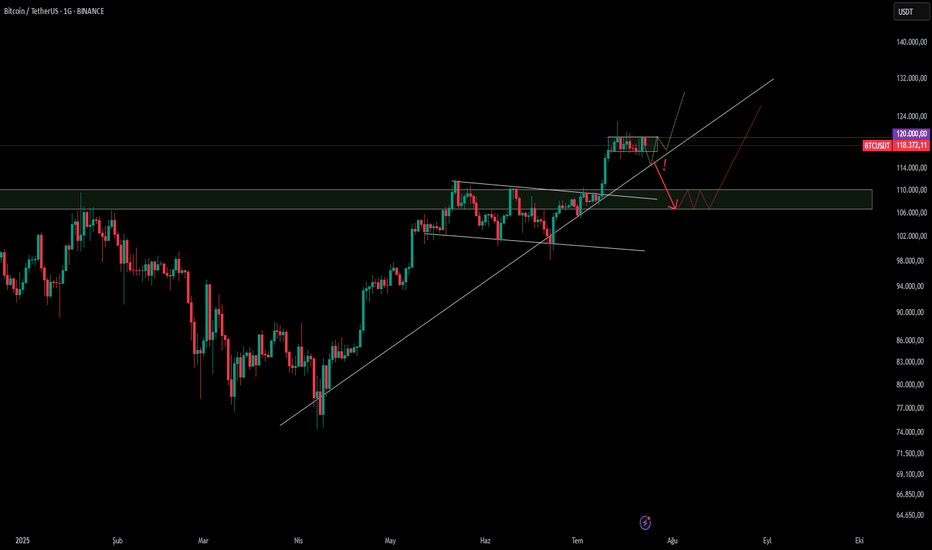
To talk about a short term, I do not see a serious problem unless the rising trend is broken. Breaking the trend does not directly affect the medium term; It only extends the process in the short term, which creates a good purchase opportunity. 107–110,000 USD zone can be considered as an opportunity zone for BTC. If the price is brought to these levels, a small accumulation scenario becomes healthy. I'm following the trend for now. In order to eliminate the negative structure in the daily graph, the price should exceed 120,000 USD levels. On the purchase side, if the price tests the trend line, and if a return candle occurs here, it becomes healthier to make gradual purchase. The reason I say gradual is that the price in a possible hard movement is likely to be with a current in the 107–110.000 USD band. The market was quite swollen in a short time, so the decreases should be considered normal and panic should not be reacted.
bcd1
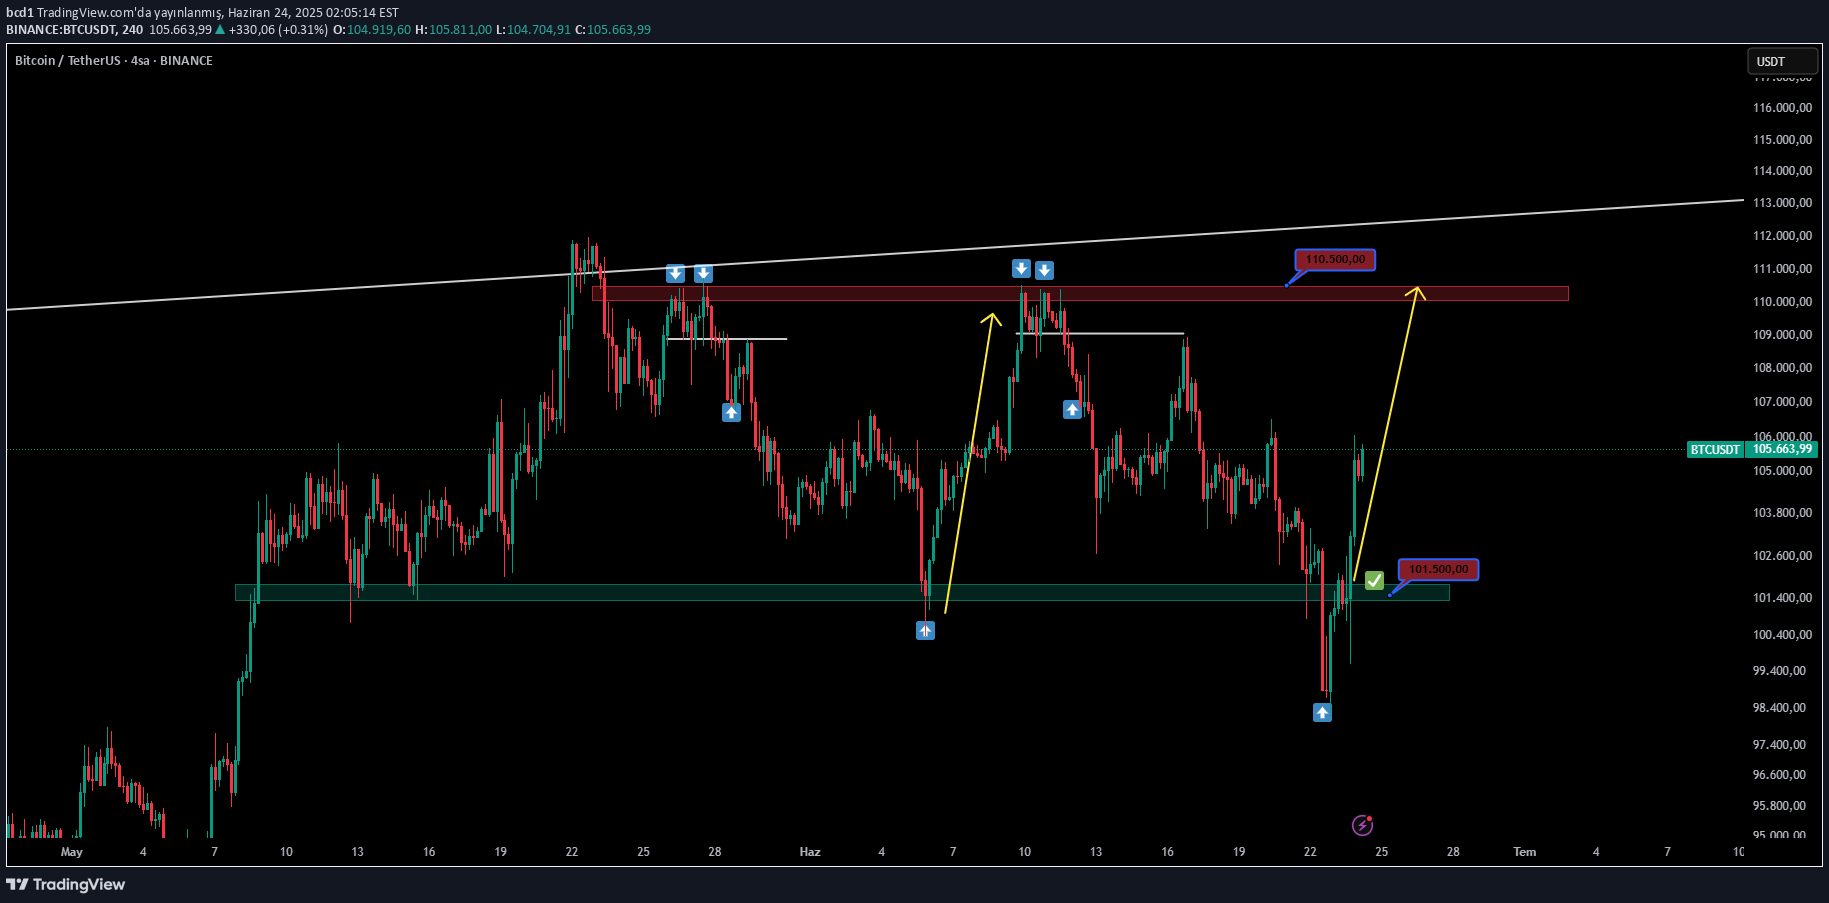
I set the title as a "short term" because I look at the graph at a 4 -hour time period. It is quite normal for candles to watch in a range before the big price movements. Especially if we are talking about a $ 10,000 band for BTC, we shouldn't be surprised. After waiting for this structure to be clarified, I wanted to share the graph. Although a short -term fake candle was thrown under this level with the news of war, the price was over again. Currently, it is quite high to reach 110,000-111,000 USD levels. The strategy to be followed should be to follow the support zone, ie roughly 100,000-101.000 USD levels. As long as this region is on, the rise in the short term will be inevitable. I need to see a clear downward violation for the deterioration of the existing structure; Otherwise, it is highly likely to reach target levels.
bcd1
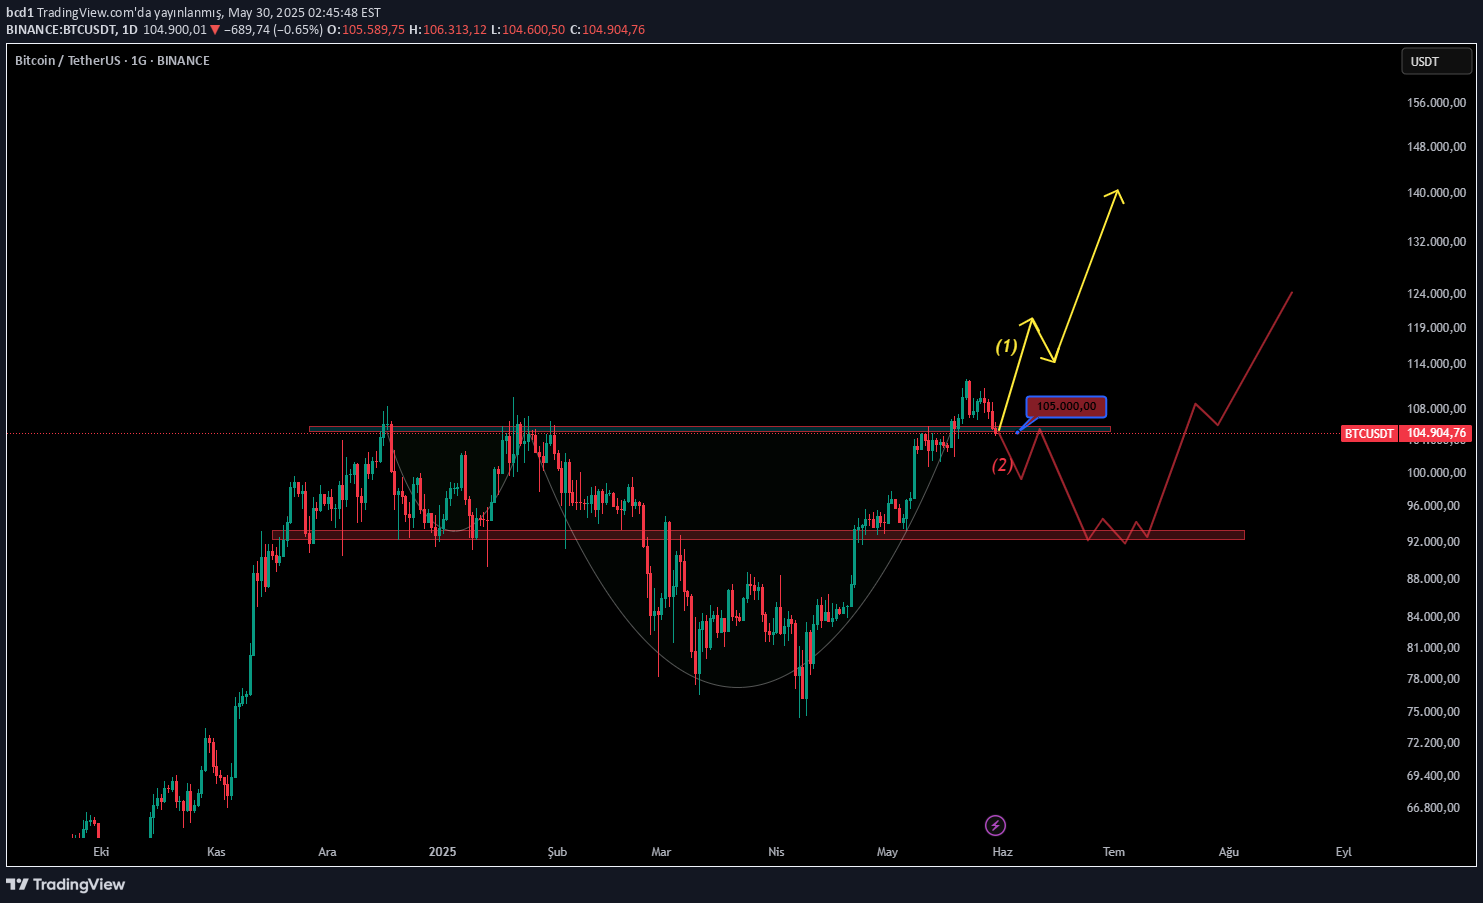
در نمودار روزانه یک الگوی "فنجان و دسته" مشاهده میشود. با این حال، برای اینکه این الگو کار کند، قیمت باید بالاتر از سطح 105000 تثبیت شود. با رسیدن بیتکوین به یک سقف تاریخی جدید (ATH)، روند به سمت خرید ادامه دارد، اما این وضعیت همزمان نشاندهنده افزایش ریسک نیز هست. میتوانیم از دو سناریوی احتمالی صحبت کنیم: 1. سناریو (سناریوی مثبت): این سناریو، سناریوی مثبت مطلوب و مورد نظر است. برای تحقق آن، بیتکوین باید بالاتر از سطح 105000 بسته شود و با یک کندل (شمع) خرید قوی، این منطقه به یک حمایت تبدیل شود. 2. سناریو (سناریوی منفی کوتاهمدت): این سناریو شامل احتمال یک اصلاح کوتاهمدت است، اما این یک فرآیند تدریجی است که به جای یک شکست لحظهای، ممکن است به مرور زمان توسعه یابد. بهترین اقدام در این وضعیت، خرید از منطقه 95000 با عقبنشینی قیمت به این منطقه بود. نمودار در حال حاضر در مرحله تصمیمگیری است و به همین دلیل نیاز به اشتراکگذاری آن احساس شد. منطقه 105000 از نظر جهت روند، یک سطح تصمیمگیری حیاتی بود.
bcd1
As I have frequently emphasized in previous analyses, I stated that I would share a new analysis if the trend moves. Now, let's evaluate the possible scenarios for Bitcoin.Major Support: 91-92K RegionThe 91-92K region is a major support point for Bitcoin. It is a very positive development that it reacts to this region without breaking below by taking liquidity. Two different scenarios can occur depending on the price's movement at this point: 1. Positive ScenarioThe price rises above the trend with the reaction it receives from the 91-92K region and maintains its permanence there. In previous price movements, we have seen that liquidity is taken from major pivot points (indicated in green) after trend violations and then the trend is regained. A similar situation may occur in the current situation. After the reaction from the 91-92K region, the first target should be for the price to rise above the trend. If the price settles firmly above the trend, the rise can be expected to continue. 2. Negative ScenarioThe price cannot break above the trend and starts to fall again and returns to the 91-92K area. In this case, the price is pulled back to the support level and comes to the decision stage here. If the support area cannot be sustained, the risk of a deeper decline may arise. Just like the previous violations in the trend, in the current situation, caution should be exercised against fake movements. The safest approach is to enter the transaction after seeing that the price has clearly broken above the trend and maintained its permanence here.
bcd1
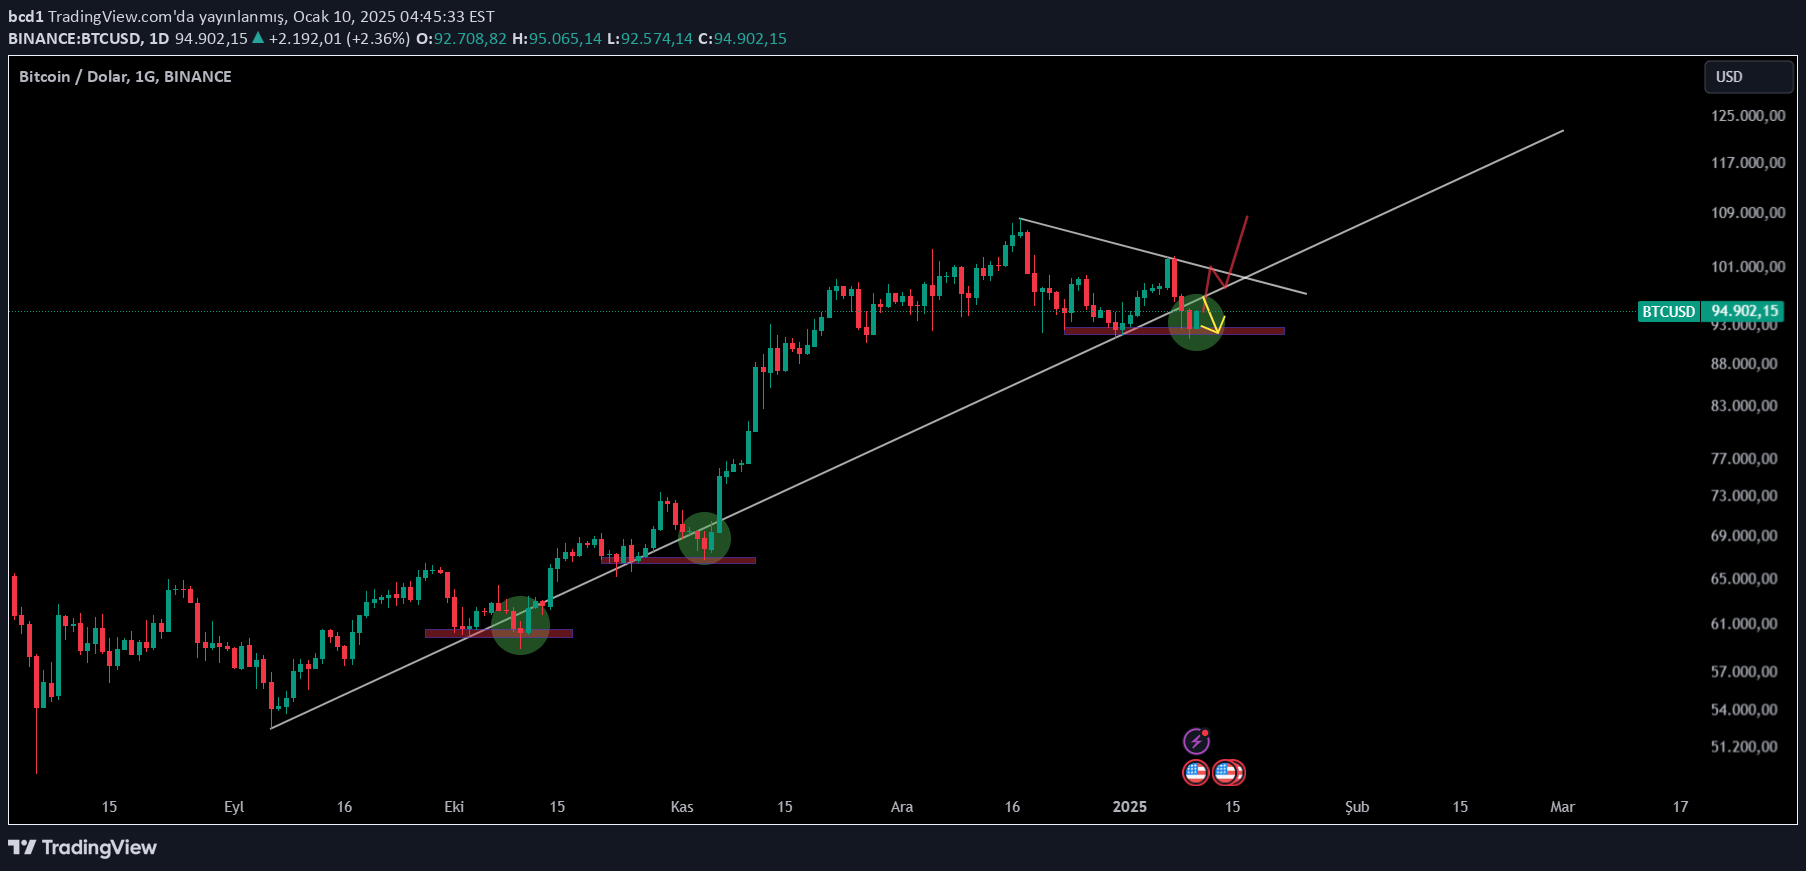
When the daily chart is examined, we observe once again that the rising trend that I have previously emphasized is working successfully. Bitcoin (BTC) touched this rising trend again and received a strong reaction. So, what might be waiting for us after this point? Scenario 1BTC is expected to rise to $ 103,000 and retest the 100,000 level by turning it into support. Scenario 2BTC is expected to move to the 100,000 resistance and continue its rise by retesting the rising trend. Personal Opinion I find scenario 2 more likely to happen. BTC As we approach $ 100,000, I expect the dominance to fall and altcoins to rise. It would be logical to take profit from altcoins when the $ 100,000 resistance is reached. In both cases, pullbacks can create a buying opportunity. Do not ignore risk management.
bcd1
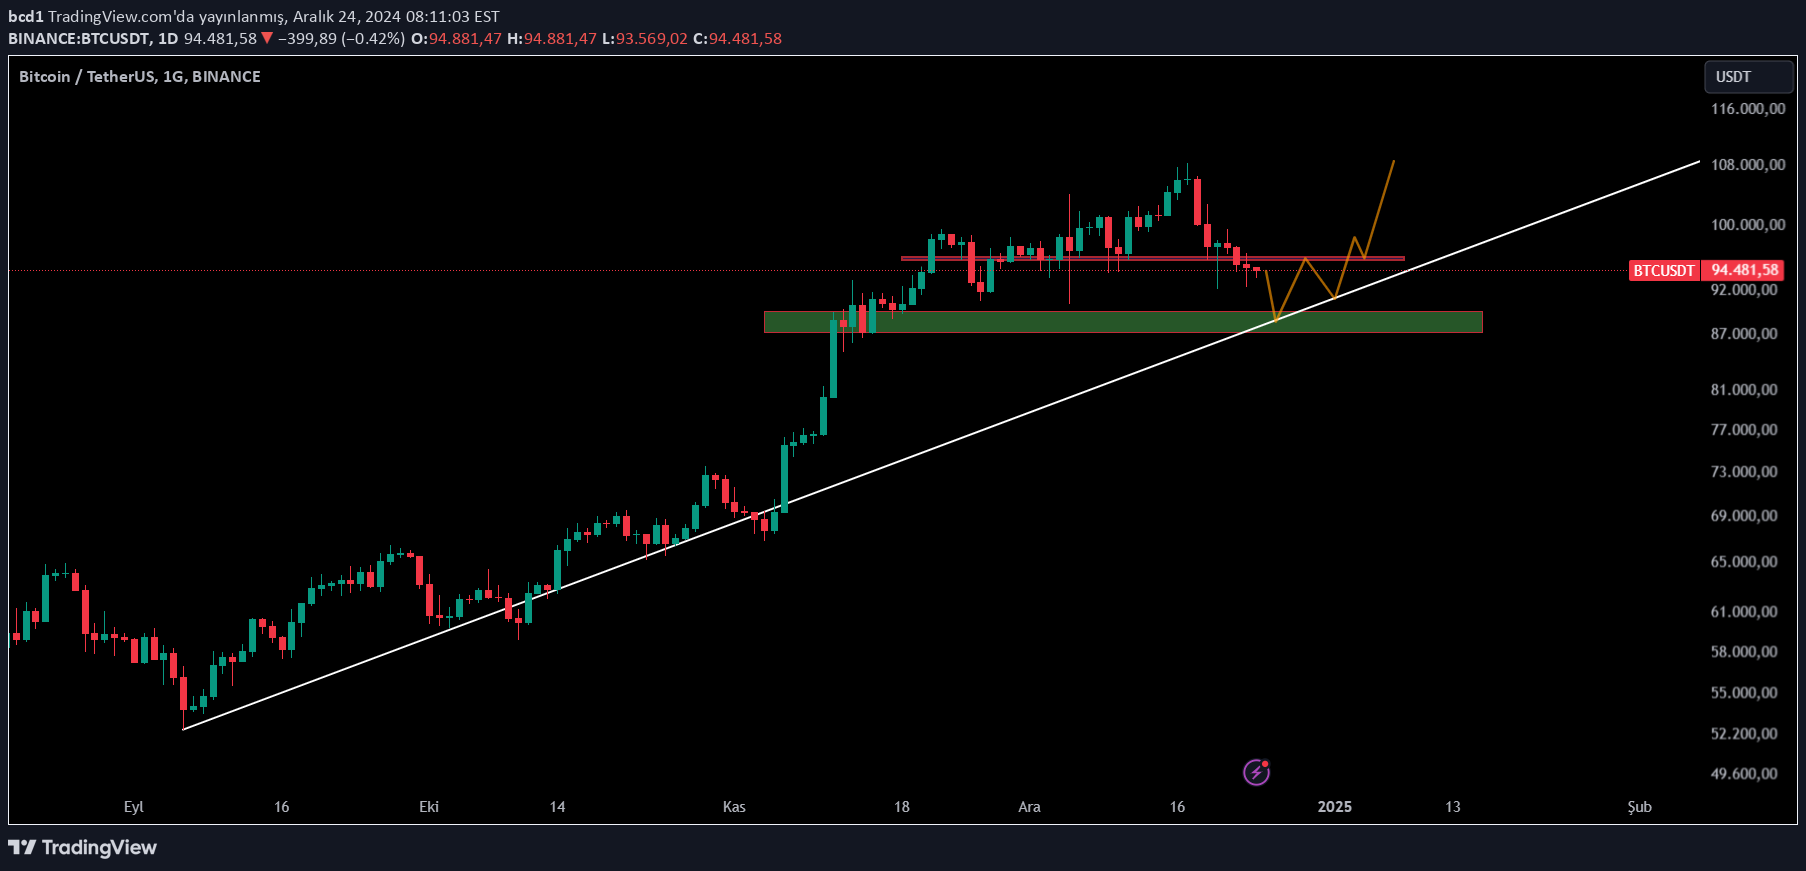
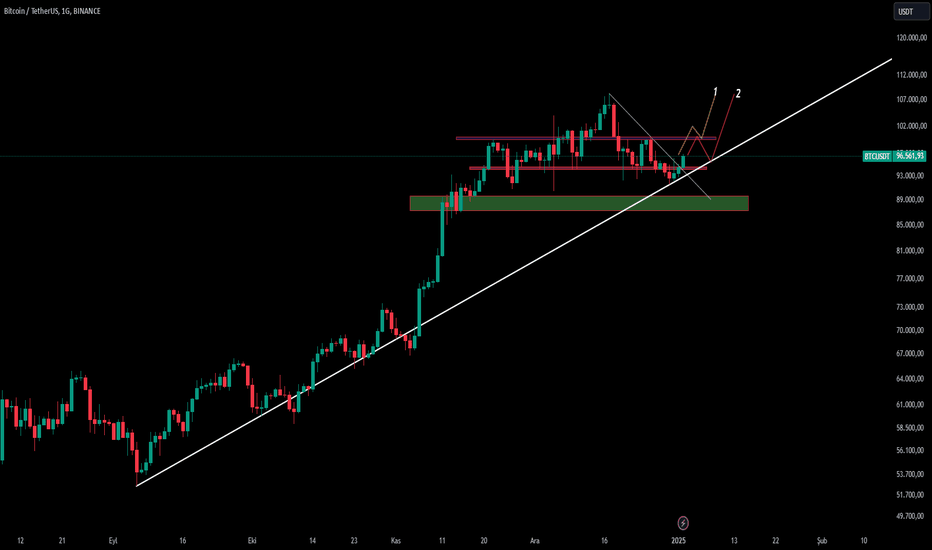
Today, BTC continues to move in the sell direction with the breakdown of the 95,600 support. However, the contact point of the uptrend from September 6 is approaching. I think that a buying opportunity may occur when this region, that is, the trend line, is reached. In addition, the fact that the horizontal support area in the 88,000-90,000 region coincides with the trend shows that this is a strong support and offers a possible buying zone. If BTC comes to this level, I expect both BTC and altcoins to continue to rise in the short and medium term. Considering that the previous movement in the market rose without correction, I think that such corrections will not create any problems. This contact point can be followed to open a transaction or reduce costs. I would like to state that we need to see a close above the 95,600 level for the analysis to lose its validity. In this case, we can accept that the current analysis is canceled.
bcd1
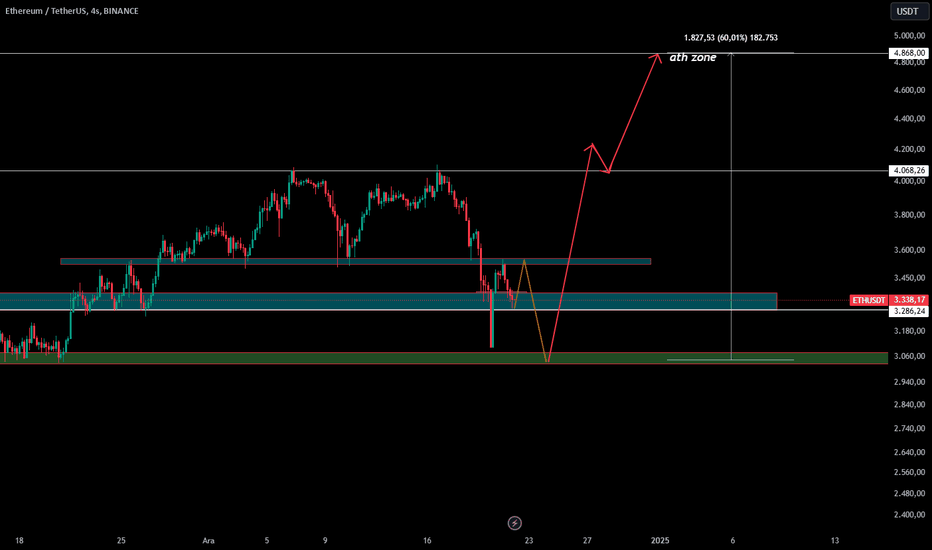
On Ethereum's 4-hour chart, a reaction rise following a sharp decline is striking. The reaction candlestick thrown above the area indicated in the chart has retook. If this level is maintained, a double top structure formation can be observed in the formation. If the double top formation works actively, the 2900-3000 USD levels stand out as a major support area as well as a region where long positions are intense in terms of liquidity. I think this level could offer a buying opportunity in the short and medium term. If a pullback to the indicated support area occurs, there is a potential for a move from here to the all-time high (ATH).
bcd1

The channel structure on the 3-day chart shows that a strong trend is continuing and price movements are finding direction regularly. This structure indicates that a "cycle" process has begun. In the short term, the $3 target seems to be a highly attainable level. However, I think the real movement will begin after the $3 level is passed. In the medium term, it would not be wrong to say that the $15 level is a completely attainable target. I think that if the channel structure works healthily and the cycle is completed successfully, we will reach the medium-term target.
Disclaimer
Any content and materials included in Sahmeto's website and official communication channels are a compilation of personal opinions and analyses and are not binding. They do not constitute any recommendation for buying, selling, entering or exiting the stock market and cryptocurrency market. Also, all news and analyses included in the website and channels are merely republished information from official and unofficial domestic and foreign sources, and it is obvious that users of the said content are responsible for following up and ensuring the authenticity and accuracy of the materials. Therefore, while disclaiming responsibility, it is declared that the responsibility for any decision-making, action, and potential profit and loss in the capital market and cryptocurrency market lies with the trader.