
b6d1016fdeb149be865b678a8ac935
@t_b6d1016fdeb149be865b678a8ac935

What symbols does the trader recommend buying?
Purchase History
پیام های تریدر
Filter
b6d1016fdeb149be865b678a8ac935
b6d1016fdeb149be865b678a8ac935
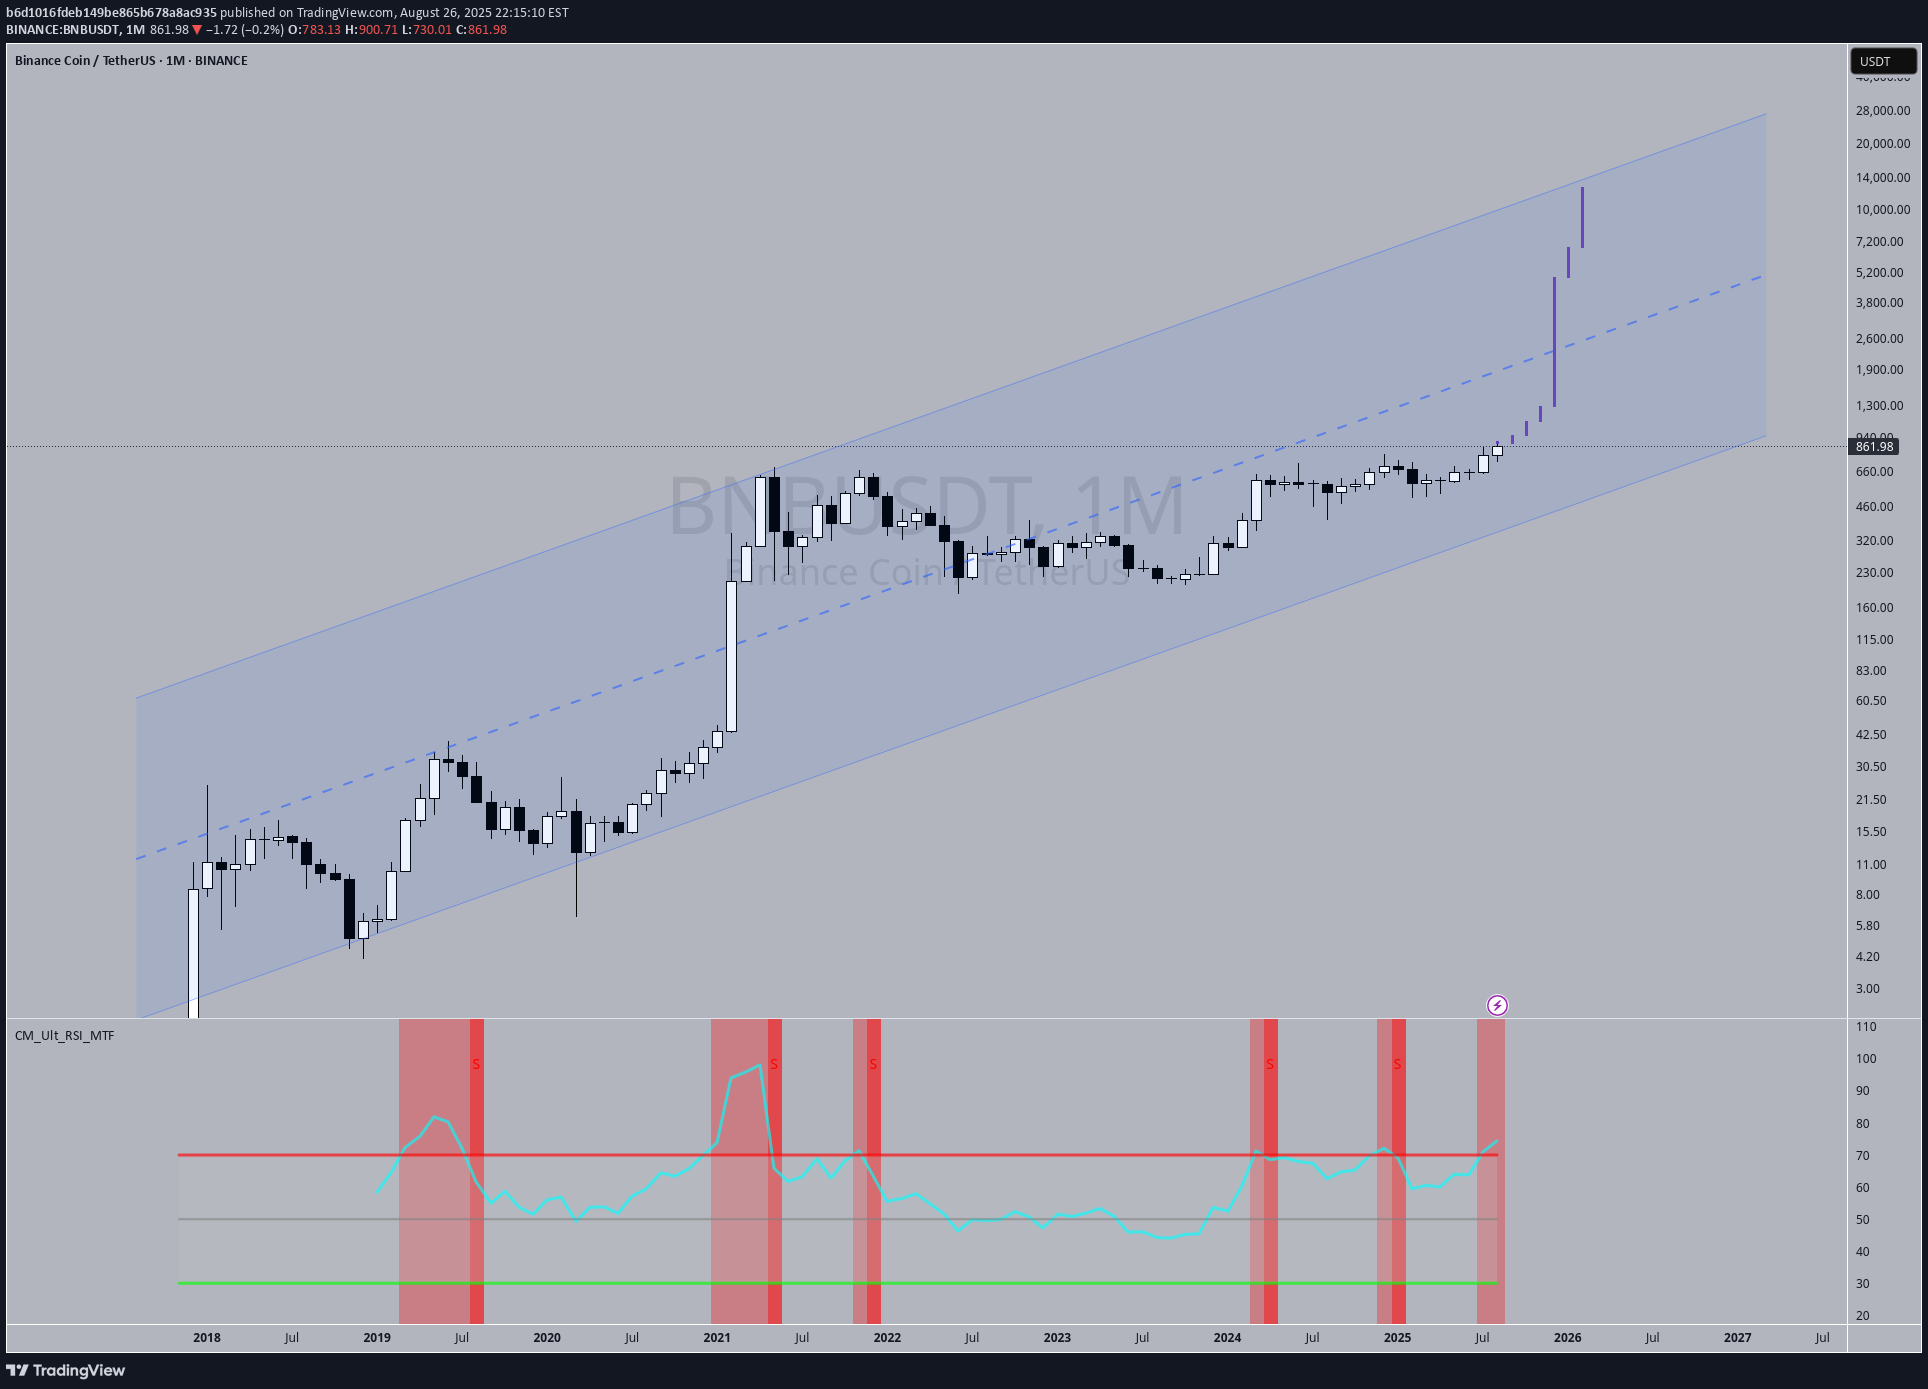
Divergence and triple tops
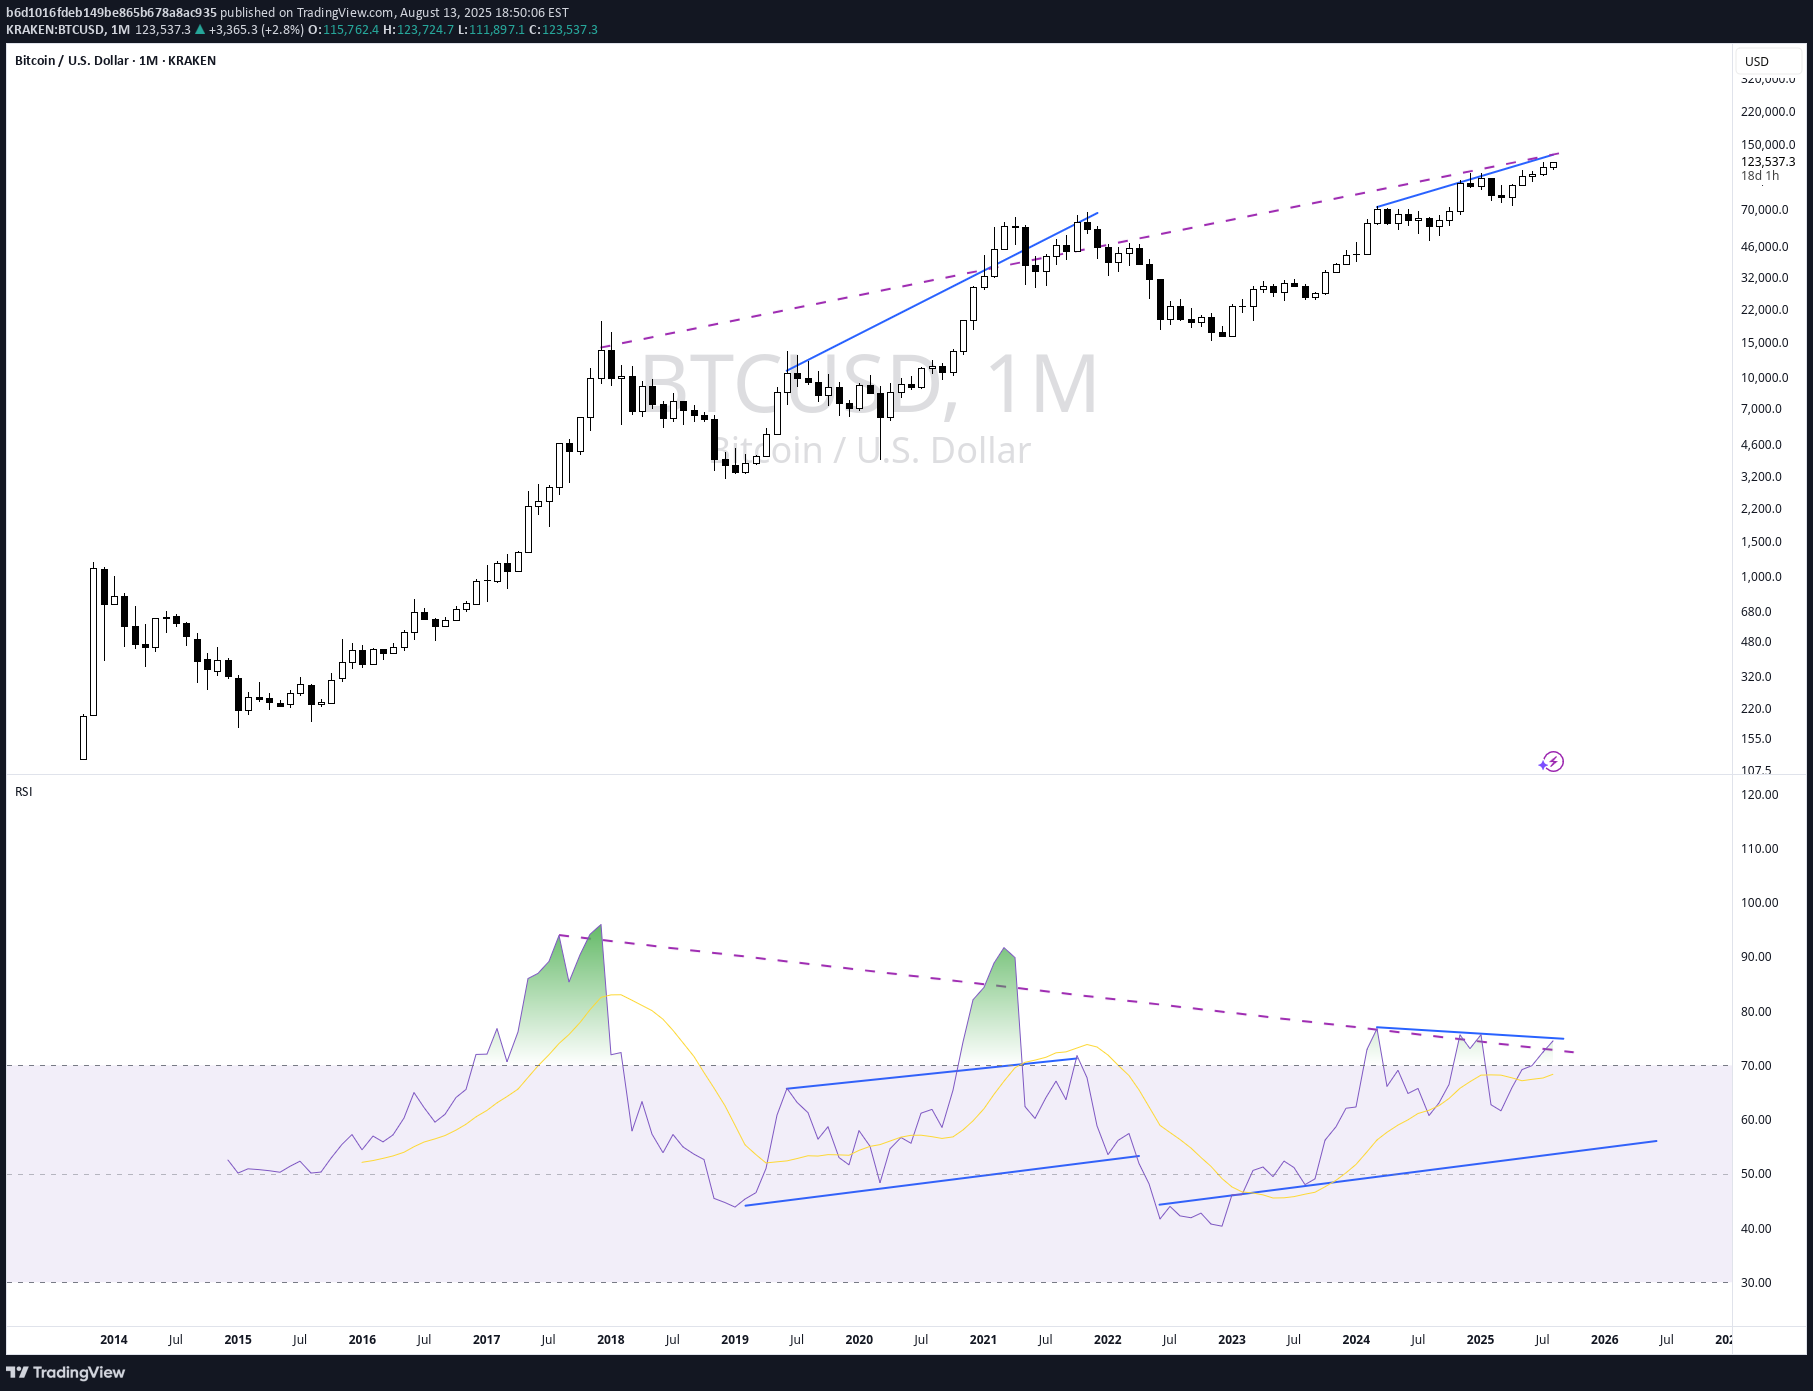
I'm still developing this idea, but wanted to post this for now. Could this be some sort of macro triple top or H&S? The divergence with RSI has me curious. This seems like the 3rd impulse of 3, and each has 3 inside of it.
b6d1016fdeb149be865b678a8ac935
META Bearish RSI Divergence?

RSI bearish divergence occurs when price makes a higher high, but the Relative Strength Index (RSI) forms a lower high. This mismatch signals weakening bullish momentum and hints at a potential trend reversal to the downside
b6d1016fdeb149be865b678a8ac935
Bull Flag or Bart Simpson

This is a Bearish perspective. Some might see a bull flag IF this price action plays out like this, however, it's possible that we could see lower lows in the form of a "Bart Simpson" pattern. Complete Speculation, but saving this idea in case the scenario plays out.
b6d1016fdeb149be865b678a8ac935
Turbo Token: A GPT-4 Inspired Meme Coin

This structure looks like a cup and handle to me. I've indicated a key level of support and resistance with the blue lines. Here are some tips for identifying a Cup & Handle pattern: Cup Formation: The pattern starts with a rounded bottom (the "cup") that resembles a "U" shape on the stock chart. The left side of the cup shows a downtrend followed by a gradual bottoming out. The right side of the cup shows a gradual uptrend, forming the other half of the "U" shape. Handle Formation: After the cup formation, there is a slight downward movement in the stock price, creating a smaller dip known as the "handle." The handle is usually shorter in duration compared to the cup and has a downward-sloping or sideways trend. Volume: Volume tends to decrease during the formation of the handle, indicating a temporary decrease in trading activity. Breakout: The pattern is considered complete when the stock price breaks out above the resistance level formed by the top of the cup (often called the "lip"). This breakout is typically accompanied by an increase in volume, signaling potential bullish momentum. To confirm a cup and handle pattern, traders often look for these characteristics and use technical indicators such as moving averages, relative strength index (RSI), and volume analysis. It's important to note that not all cup and handle patterns lead to significant price movements, so traders often combine pattern recognition with other analysis techniques for better decision-making. Learn more about TURBO here => turbotoken.io/
b6d1016fdeb149be865b678a8ac935
Arbitrum Speculative View

Do I see a triangle continuation pattern forming? (in red) I say speculative view in the title of this Idea because none of the patterns I think I see have completed yet. As a trader, you have a higher probability of trading after validation/confirmation of patterns rather than anticipating their completion. But it's fun to speculate sometimes : ) We could expect price to continue upwards if this turns out to be a Symmetrical or Ascending Triangle pattern. Because this potential triangle pattern is following a price increase, this could be a Bullish Pennant . If so, the first price target would be the height of the triangle (blue lines), the 2nd price target would be the height/distance of the black lines. I've placed 4 purple lines indicating where I'd take profits. I could also see an un-completed Elliott wave (3) forming. I'll follow up in a few weeks to see how price action progresses.I shouldn't have attempted to draw a channel on a higher time frame with such little data. Charting is Learning.
b6d1016fdeb149be865b678a8ac935
How long can ETC hold support?

ETH has been wicking into the $13-15 range repeatedly. It's knocking on the door, and I feel like it's just a matter of time before that door opens, support is lost, and the price tanks. I'm not entirely sure where the next level of support is however. I will keep an eye on this one and update as things materialize.Update: wowzers. nearly 2x since posting.
b6d1016fdeb149be865b678a8ac935
Possible path for MSTR
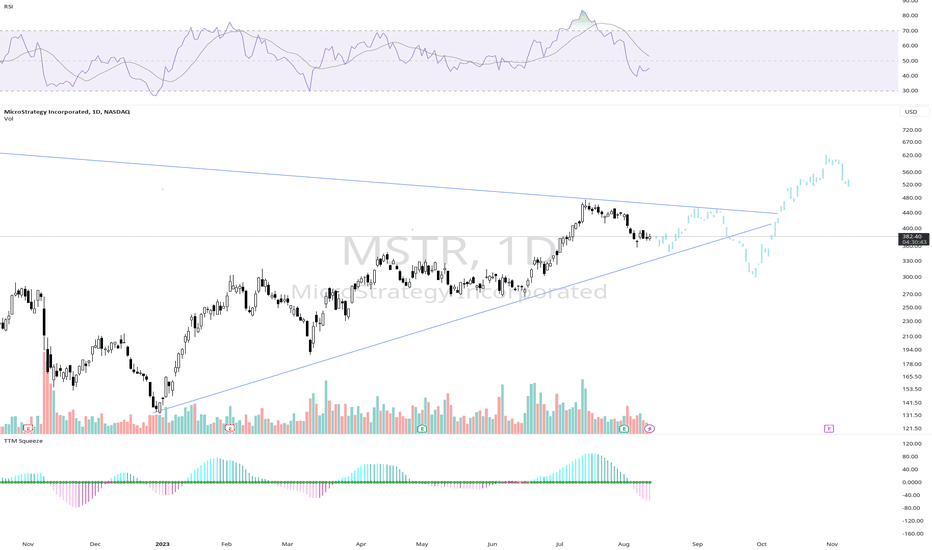
Like BTC , MSTR is squeezing against 2 levels of support/resistance. Here is a possible price action path MSTR could follow in the near term.Support at the lower end of the triangle was tested and now turned to resistanceLevel has been reached. Now we watch to see what happens
b6d1016fdeb149be865b678a8ac935
ETH Short

Merge was uneventful, which was positive, however I see ETH taking a dump, along with the rest of the crypto space.
b6d1016fdeb149be865b678a8ac935
A Possible Path for ADA

Calculated based on percentage moves on previous price action.that region acted as resistance. would not be surprised to see pa go down to the bottom of the parallel channelPrice action pushing against the top of this box I've drawn. Would not be surprised to see pa break to the upside from this .60 to .66 level
Disclaimer
Any content and materials included in Sahmeto's website and official communication channels are a compilation of personal opinions and analyses and are not binding. They do not constitute any recommendation for buying, selling, entering or exiting the stock market and cryptocurrency market. Also, all news and analyses included in the website and channels are merely republished information from official and unofficial domestic and foreign sources, and it is obvious that users of the said content are responsible for following up and ensuring the authenticity and accuracy of the materials. Therefore, while disclaiming responsibility, it is declared that the responsibility for any decision-making, action, and potential profit and loss in the capital market and cryptocurrency market lies with the trader.