
arzdigitalistha
@t_arzdigitalistha

What symbols does the trader recommend buying?
Purchase History
پیام های تریدر
Filter
arzdigitalistha
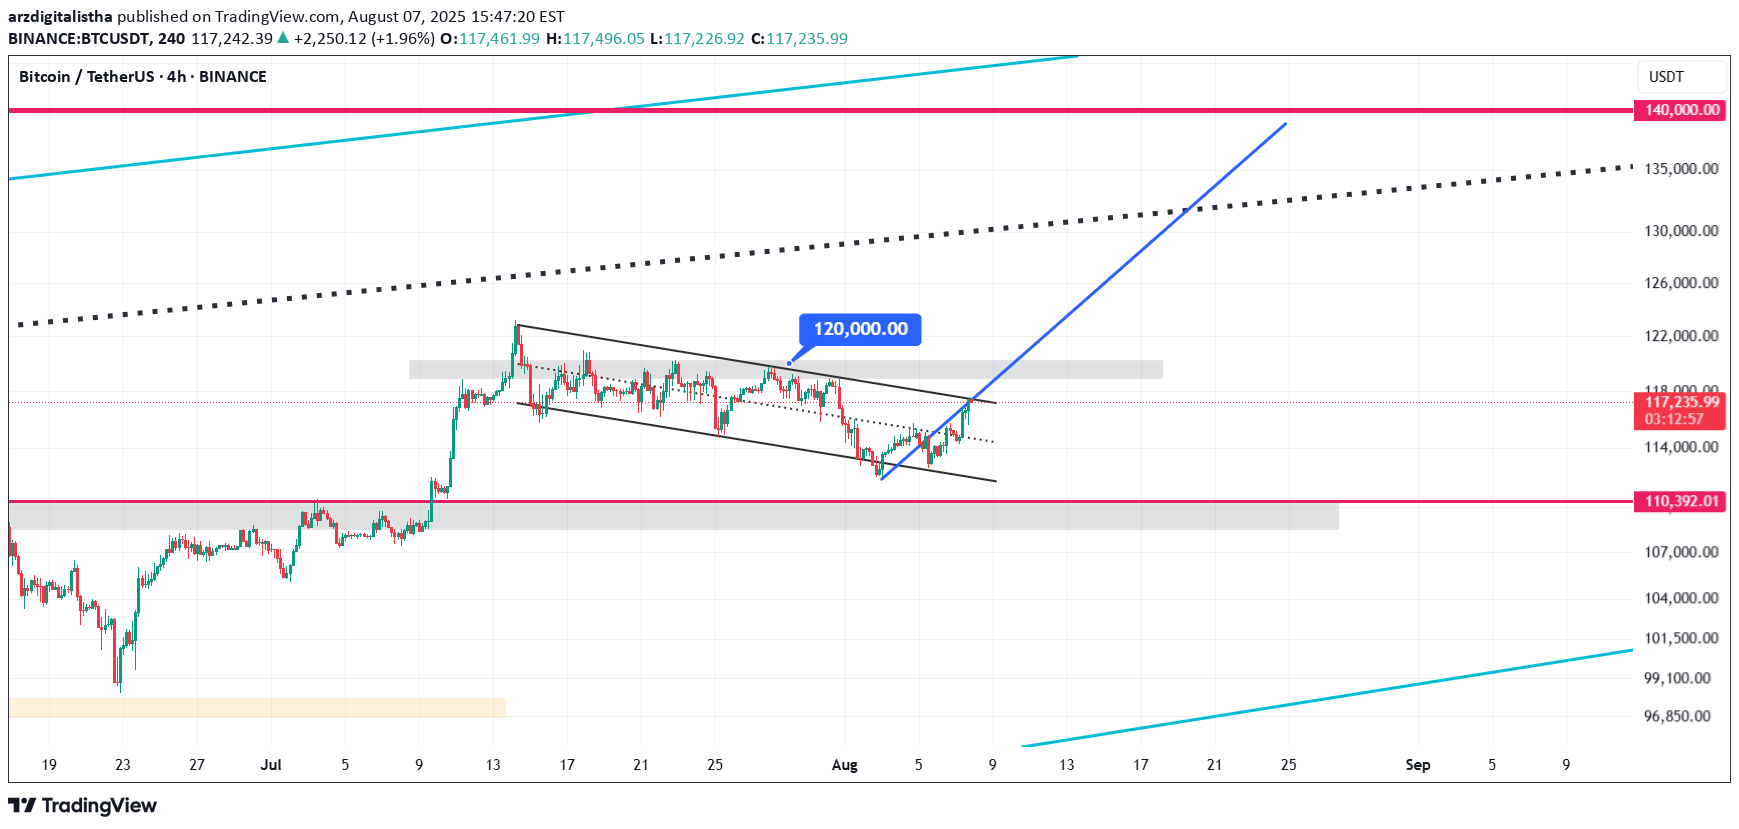
🚩 Bullish Flag Pattern Formation Bitcoin is currently forming a bullish flag pattern on the 4-hour chart. This pattern typically appears after a sharp upward move and represents a short-term consolidation within a descending channel. It usually signals a continuation of the strong bullish trend. Currently, the price is oscillating between the upper and lower boundaries of this channel, poised for a potential breakout. ⏳ Duration of the Correction Phase The correction inside this channel has lasted from July 14 to August 8, 2025, spanning approximately 25 days. This relatively long consolidation period indicates a deep stabilization phase, allowing the market to gather momentum for the next upward wave. During this time, Bitcoin traded in a tight range between the channel’s support and resistance levels. ⚠️ Critical Resistance at $120,000 The key resistance level to watch is $120,000. If Bitcoin can break this level decisively with strong volume and confirming candles, the bullish flag pattern will be validated, signaling a continuation of the upward trend. This breakout point is considered an optimal entry for new long positions. 🎯 Price Target at $140,000 The target price derived from the bullish flag pattern, calculated by measuring the flagpole and projecting it from the breakout point, is around $140,000. This represents approximately a 20% gain from the breakout and may serve as a significant psychological resistance level.The breakout above the \$120,000 resistance has activated Bitcoin’s bullish flag pattern, opening the path toward \$140,000. This upward move is supported by strong volume, signaling a powerful continuation of the rally.
arzdigitalistha
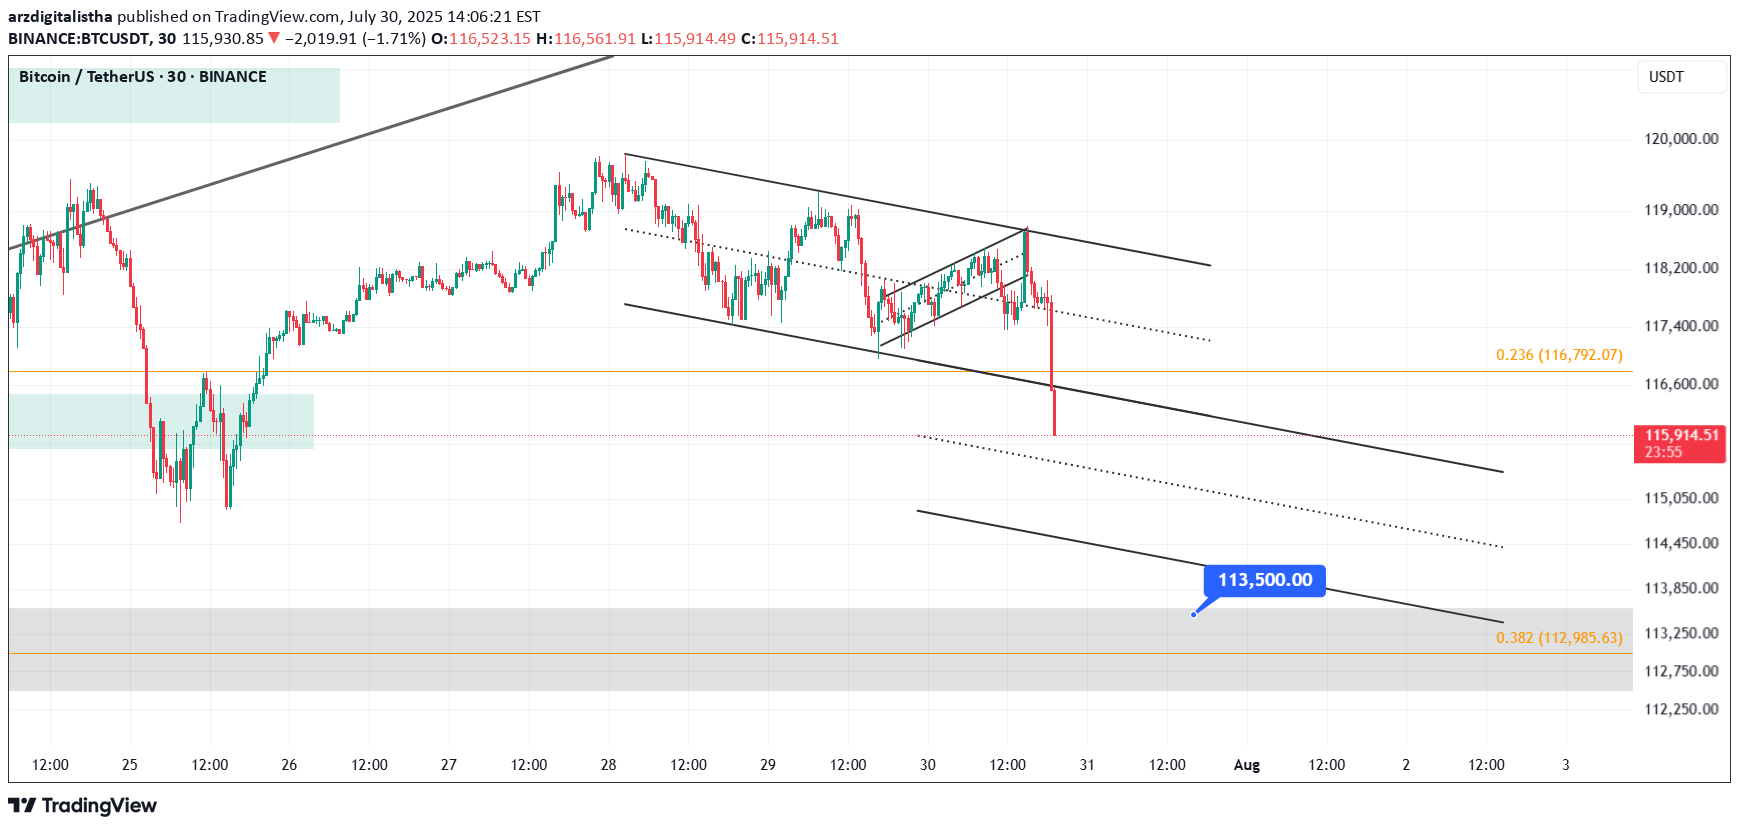
Quick Hey friends 👋 Bitcoin was recently moving inside a weak upward channel on the 30-minute chart. But now, it has broken below the channel with a strong bearish candle. This suggests we’re entering a short-term correction. 🔹 However, don’t forget — the overall trend is still bullish. This drop looks more like a healthy pullback, not the start of a full downtrend. 🎯 Possible Targets for This Correction: ✅ Target 1: Around $114,500 (This comes from measuring the width of the broken channel.) ✅ Target 2: Strong support near $113,500 (This level has shown solid buyer interest in the past.) 📊 The RSI is also approaching the oversold zone, which means we might see a small bounce or slowdown in the drop soon. 📌 In short: This is likely just a dip in a bigger uptrend. Be patient, watch key support zones, and don’t rush into trades. Always stick to proper risk management! 💼 Bitcoin Analysis – 30-Minute TimeframeBitcoin has reached the $113,500 support level — if buyers hold this zone, a rebound is possible. But if it breaks down, the next target could be around $110,000.
arzdigitalistha
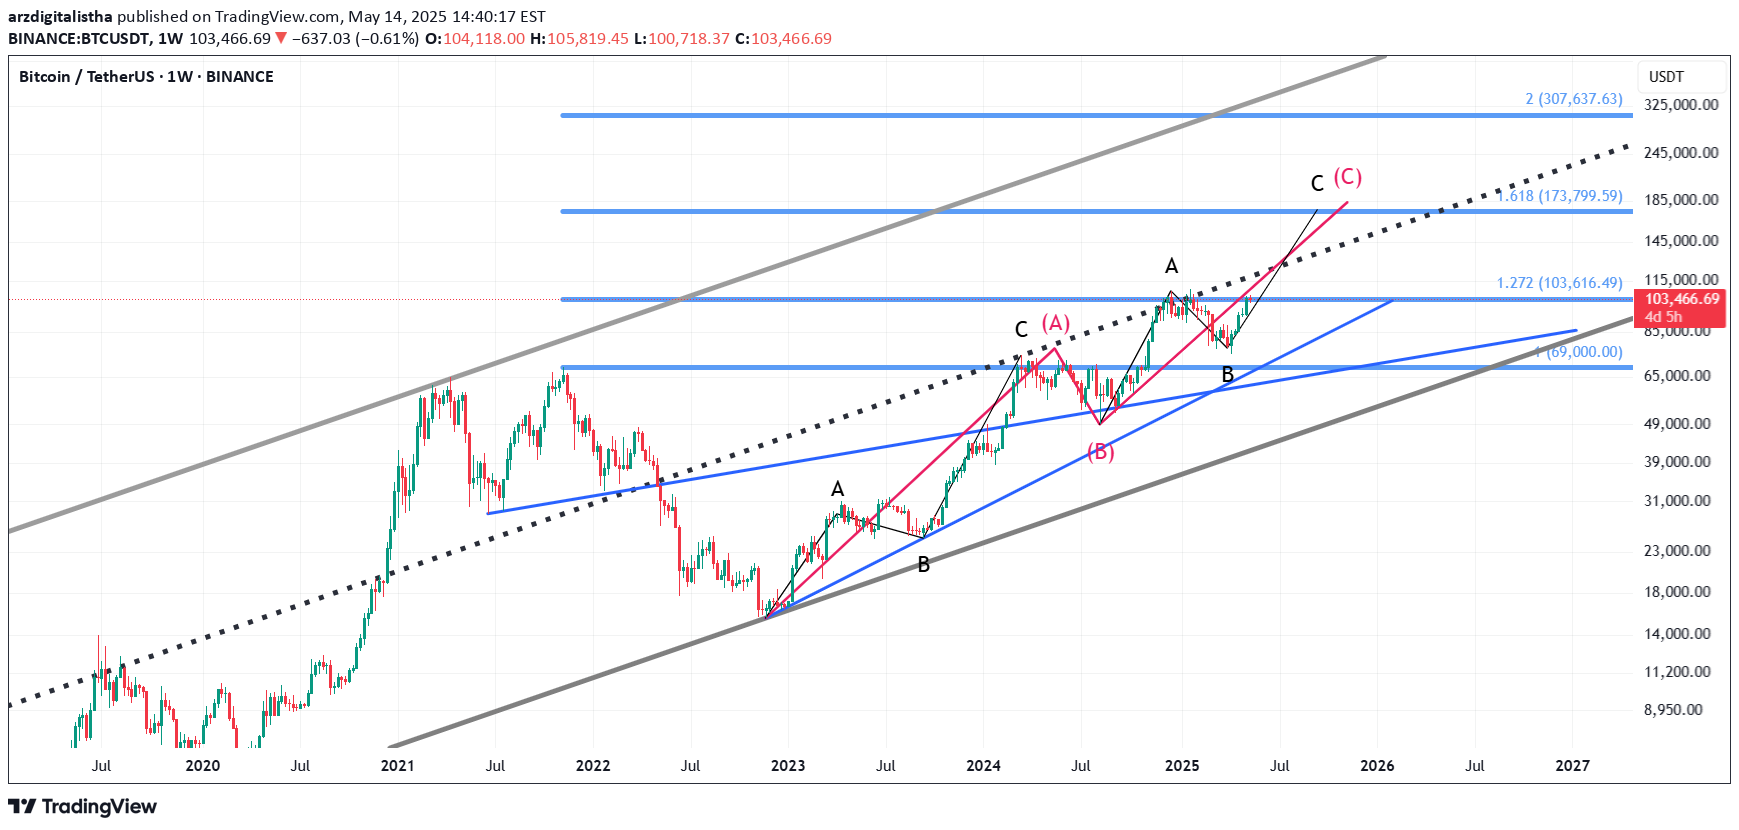
After crashing from its $69K peak (Nov 2021) to $15,476 (Nov 2022), Bitcoin has entered a bullish Elliott Wave structure, forming a classic 3-wave corrective pattern:🔹 Wave A: Rally to $73,777 (with internal abc structure)🔹 Wave B: Pullback to $49,000🔹 Wave C: Currently unfolding — with a potential target at $180KWithin Wave C:✅ Wave a: Pushed to $109K✅ Wave b: Corrected down to 73K✅ Wave c: Now beginning and approaching a key breakout point📌 The critical level? A daily candle close above $109KIf that happens, Bitcoin could enter its final impulsive leg toward $180K.All technical signs point toward a major move — the structure, volume, and price action are aligned for what could be a historic breakout.Bitcoin has broken above $109,300 with a daily close, confirming entry into a new bullish wave. The next potential target lies in the $180K range. Momentum favors further upside.
arzdigitalistha

🔹 Analysis: Bitcoin remains in a range and is forming a triangle pattern. A breakout above the resistance level could trigger further upward movement.📢 Key Levels:✅ Support: $95,500 (This level could act as a buffer if a pullback occurs)🚀 Resistance: $98,500 (Breaking this level could confirm the bullish move)🎯 Target Levels After Breakout:🔹 First Target: $102,000🔹 Second Target: $106,000📌 If the breakout is confirmed, a stronger rally can be expected.trade position is actived.
arzdigitalistha

💠 Technical Analysis:VeChain has been consolidating within a price channel and recently found support at the channel bottom. It has also broken its downtrend line and a key static resistance level, now pulling back to this zone.📊 Buy Signal:🎯 Targets:🔹 First Target: Channel top🔹 Second Target: If the channel breaks, a move equal to its width📢 What’s your opinion on this analysis? Drop a comment! 🚀🔥
arzdigitalistha

🔹 Bitcoin has finally broken the **key resistance at 104K** after **a month of ranging between 90K and 104K**, signaling the end of its consolidation phase.🔸 This breakout coincides with a major fundamental catalyst— he inauguration of the new U.S. President (Trump) on January 20*—bringing renewed optimism and buying interest into the market.🔸 Entry Zone: 104K to 106K 🔸 First Target: 122K 🔸 top Loss: 97K 💥 *Technical and Fundamental Convergence: The combination of a critical resistance breakout and significant political events sets Bitcoin on a clear path toward its next major target of 122K.📈 Don’t miss this powerful opportunity—Bitcoin is ready for another explosive rally!
arzdigitalistha

🔹 It looks like the Wave 2 correction for RUNE has ended, and we are now entering Wave 3. This is the perfect time to enter the market and capture massive gains!🔸 Entry Price: $4 🔸 Stop Loss: $2.5 🔸 Take Profit: $28 💥 Risk-to-Reward: 1:16 📈 Profit Potential: Around 600%📊 This analysis is based on Elliott Wave theory and key technical levels. With Wave 3 now underway, we expect a significant bullish move in RUNE’s price. Always use proper risk management and stick to your stop-loss!
arzdigitalistha

🔍 Analysis:VeChain (VET) has finally escaped the consolidation range of $0.04 to $0.055, breaking out with a strong bullish candle. This signals the potential start of a powerful uptrend. 💡 Signal Details: - Entry Point: $0.056 - Stop Loss: $0.038 - Take Profit: $0.110 - Risk to Reward Ratio: 3 - Potential Profit: 96%
arzdigitalistha

✅ Key Trade Levels:📌 Entry Point: $2.6🛑 Stop Loss: $2.1🎯 Take Profit: $6📊 Analysis and Explanation:The THETA chart shows a strong Harmonic Gartley pattern, where the price rebounded after touching the 61% retracement level of the XA wave. Additionally, an inverse head and shoulders pattern has formed, and the neckline has been broken decisively. The key resistance at $2.6 is the last barrier. Once this level is broken, a strong upward movement towards the $6 target is highly likely.
arzdigitalistha

📉 Analysis: Solana (SOL) has completed an ABC correction and successfully broken its descending trendline, signaling the start of a strong bullish move. This setup offers an excellent 100% profit potential with a 1:5.5 risk-reward ratio. 📌 Key Levels: - 🔹 Entry Point: 213.50 USD - 🔹 Stop Loss: 174.00 USD - 🔹 Take Profit: 430.00 USD 📊 Outlook: The break above the descending trendline confirms a change in momentum, making SOL ready for its next major move upwards. A perfect setup for traders looking for high returns with calculated risk. 📢 Share your thoughts! Don't forget to share this signal with your trading circle and let us know your plans in the comments.Long Position for Solana (SOL) Activated! 💲 Current Price: 214.33 USD 🔑 The long position for Solana has been activated as per the previous signal, and the bullish move has started.
Disclaimer
Any content and materials included in Sahmeto's website and official communication channels are a compilation of personal opinions and analyses and are not binding. They do not constitute any recommendation for buying, selling, entering or exiting the stock market and cryptocurrency market. Also, all news and analyses included in the website and channels are merely republished information from official and unofficial domestic and foreign sources, and it is obvious that users of the said content are responsible for following up and ensuring the authenticity and accuracy of the materials. Therefore, while disclaiming responsibility, it is declared that the responsibility for any decision-making, action, and potential profit and loss in the capital market and cryptocurrency market lies with the trader.