
arsalankhan9394
@t_arsalankhan9394

What symbols does the trader recommend buying?
Purchase History
پیام های تریدر
Filter
arsalankhan9394
XAUUSD- ABCD Harmonics Pattern

XAUUSD is making ABCD Harmonic pattern on 4h Timeframe. At point D there is a possible reversal one. Trade will be valid only if there is bearish divergence on RSI at point D. Wait for confirmation to enter in the trade.
arsalankhan9394
XAUUSD- ABCD Harmonic Pattern

XAUUSD is making ABCD Harmonic pattern on 4h Timeframe. At point D there is a possible reversal one. Trade will be valid only if there is bearish divergence on RSI at point D. Wait for confirmation to enter in the trade.
arsalankhan9394
XAUUSD- Trend Continuation

GOld has made a bullflag in its corrective wave. There is no RSI Divergence and shows likely a trend continuation to the upside. significant levels are marked on the chart
arsalankhan9394
AAVEUSDT- Ranging

AAVEUSDT is ranging with no clear series of HH and LL's. one can enter in the trade if range is broken on either sides. Significant levels are marked on the chart. Entries to be taken either at R2 or S2
arsalankhan9394
GALAUSDT - Rangebound

GALAUSDT is rangebound with no clear HH or LL. To trade the range there are 2 scenarios, either one, if executed will cancel the other scenario.If it breaks the support to the downside sell order should be executed at S2 or if it breaks the resistance to the upside buy order should be executed at R2. Support and Resistance levels are clearly marked on the chart
arsalankhan9394
FTMUSDT- Bearish Trend

Phantom is in a downtrend with clear LH's and LL's on 15M timeframe and following a trendline drawn by connecting the LH's. There are 2 possible scenarios for entry point, one at fib retracement of .382 with immediate rejection from that level. the other is a would be confluence point of trendline and .382 fib retracement level. Both the scenarios are marked on the chart. RSI shows bearish continuation signal as there is no bullish divergence on the chart as marked
arsalankhan9394
DOTUSDT- Bearish Trend

Polkadot is in bearish trend on 1H timeframe. it is creating LL's and LH's and following a trendline. There is an indication that it will follow the bearish trend as there is no bullish divergence on RSI. Possible entry at fib level of .382
arsalankhan9394
XAUUSD - Bearish Trend

Gold seems to in bearish trend on lower timeframe of 15m as it is printing Lower lows and Lower highs
arsalankhan9394
BTCUSD - Bearish Trend

BTCUSD is in downtrend since it rejected from 68200. the pair is continuously printing lower lows and lower highs on 15m timeframe.
arsalankhan9394
US500- Bearish Trend
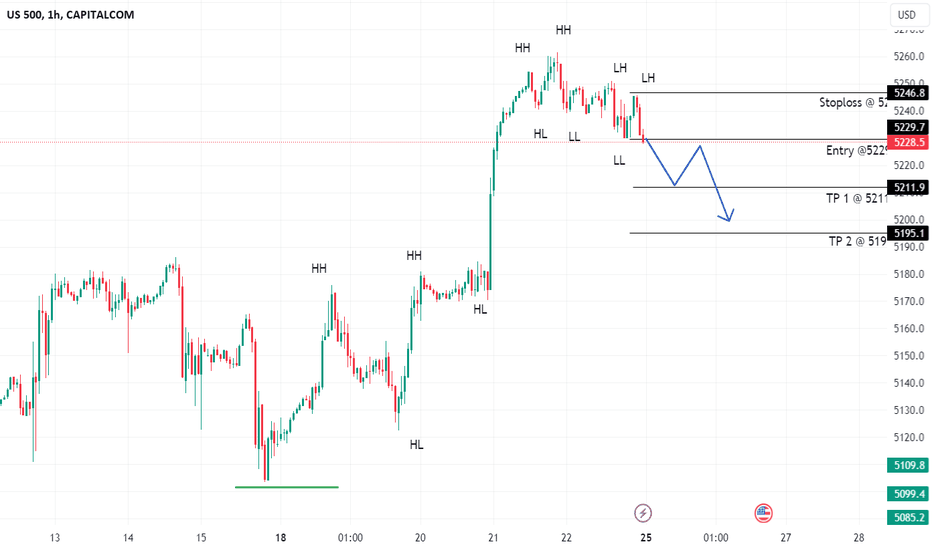
Bullish movement of US500 has ended. Price has broken to the down side on 1H Timeframe by printing Lower Lows and Lower Highs
Disclaimer
Any content and materials included in Sahmeto's website and official communication channels are a compilation of personal opinions and analyses and are not binding. They do not constitute any recommendation for buying, selling, entering or exiting the stock market and cryptocurrency market. Also, all news and analyses included in the website and channels are merely republished information from official and unofficial domestic and foreign sources, and it is obvious that users of the said content are responsible for following up and ensuring the authenticity and accuracy of the materials. Therefore, while disclaiming responsibility, it is declared that the responsibility for any decision-making, action, and potential profit and loss in the capital market and cryptocurrency market lies with the trader.