
arongroups
@t_arongroups

What symbols does the trader recommend buying?
Purchase History
پیام های تریدر
Filter
arongroups
Bitcoin Price Analysis

Based on recent data from the Bitcoin/USDT 4-hour chart on Binance, Bitcoin appears to be on the verge of an upward movement. Analysis suggests that if the key support level around 95,747holds,thepriceofBitcoincouldrisetowardhigherresistancelevelsintherangeof95,747holds,thepriceofBitcoincouldrisetowardhigherresistancelevelsintherangeof99,002 to $99,963. Key Support Level: $95,747 The $95,747 level is considered a strong support zone. This level has previously acted as a demand area, preventing further price declines. Maintaining this support is crucial for the continuation of the upward trend, as a break below this level could lead to a drop toward lower price levels. Upside Target: Resistance at 99,002to99,002to99,963 If the price stabilizes above the 95,747supportlevel,Bitcoincouldmovetowardthenextresistancelevelsinthe95,747supportlevel,Bitcoincouldmovetowardthenextresistancelevelsinthe99,002 to $99,963 range. This resistance zone has previously acted as a supply area, and a breakout above it could indicate increased demand and buying pressure. Market Outlook Given the identified support and resistance levels, the short-term outlook for Bitcoin appears positive. Increased trading volume at support levels and reduced selling pressure at lower levels suggest a market inclination toward upward movement. However, it remains important to monitor global news and events that could impact the crypto market. Conclusion If Bitcoin can maintain the 95,747supportlevel,thereispotentialforthepricetorisetowardthe95,747supportlevel,thereispotentialforthepricetorisetowardthe99,002 to $99,963 resistance range. Traders and investors should closely monitor these levels and employ appropriate risk management strategies to capitalize on the potential opportunities presented by this upward movement.
arongroups
Bitcoin’s Uptrend Subject to Holding Support

Bitcoin (BTC) is still trading within a descending channel on the 4-hour time frame and is now approaching one of the key points of the channel. A look at the chart shows that if the support at $91,563 holds, Bitcoin could continue its upward movement to the resistance at the ceiling of the descending channel at $99,314.
arongroups
Will Bitcoin continue to decline?

Considering the resistance in the range of 97,101, a breakthrough of this area could lead to a rise up to approximately 99,659. Otherwise, if the support level of 94,104 is broken, we can expect a drop to the levels of 91,688 and 88,622.
arongroups
Is gold losing its support?

Or considering the resistance in the range of 2651, after breaking this area, one can expect a rise towards the level of 2678. Otherwise, with a break below the support level of 2609, one might anticipate a drop towards the range of 2584.
arongroups
Is gold losing its support?

Or considering the resistance in the range of 2651, after breaking this area, one can expect a rise towards the level of 2678. Otherwise, with a break below the support level of 2609, one might anticipate a drop towards the range of 2584.
arongroups
Bitcoin's current outlook is bullish
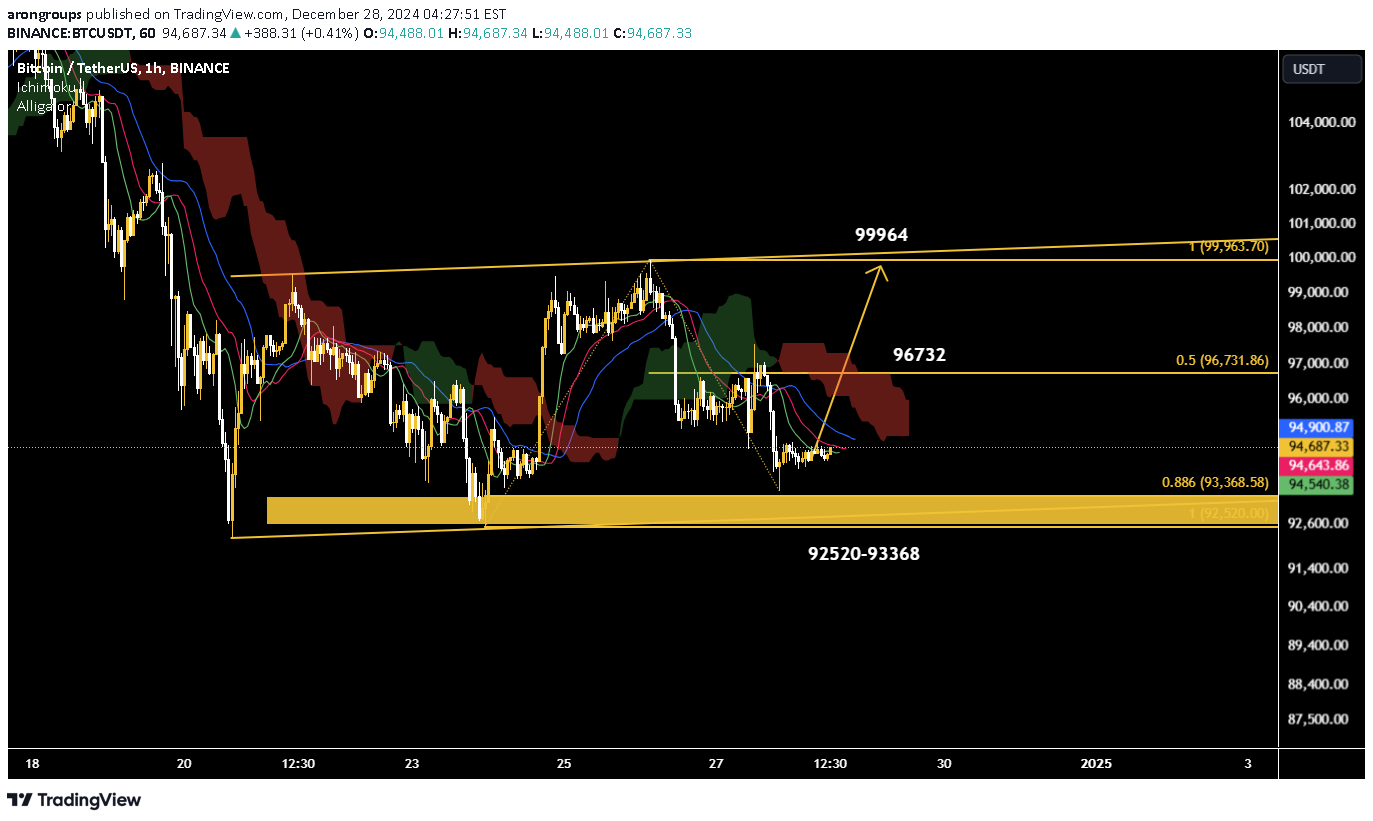
In the cryptocurrency market, fundamental factors such as Federal Reserve policies, the growth of the US dollar index, and the amount of liquidity in the market have a direct impact on Bitcoin's movement. A strengthening US dollar can increase selling pressure on Bitcoin.But if there are signs of a halt to tightening policies or a growth in cryptocurrency adoption, the likelihood of Bitcoin rising increases, especially if institutional demand for Bitcoin increases.Technically, on the one-hour timeframe, Bitcoin is approaching a strong support range between $92,520 and $93,668. This range could trigger a price reversal, but if it is broken, further declines are expected.On the upside, key resistances lie at $96,732 (0.5 Fibonacci level) and $99,964. A break above these levels could trigger a new uptrend for Bitcoin.The Ichimoku Cloud indicates current weakness in the trend, as the price is below the Cloud and the ALLIGATOR lines are also in a bearish mode. However, the price's proximity to the support zone increases the likelihood of a reversal.
arongroups
NEW IDEA FOR GOLD

Resistance at $2,654 and the impact of a strong dollar add to the downside of goldOn the hourly chart of gold, the price approached the resistance level of $2,654 and failed to break it. This level, which also coincides with the Fibonacci 0.382, is a strong obstacle to the upward movement. If gold continues to fail to break through this resistance, there is a possibility of a decline to the $2,577 range (Fibonacci 0.786) and then $2,485 (Fibonacci 1.272).Additionally, the Ichimoku indicator is showing weakness in the uptrend, as the price is currently below the Kumo cloud. The Alligator lines are also in a bearish position, indicating that sellers are dominating the market.Also, the strengthening of the US dollar as a safe haven asset in the current situation will put more downward pressure on gold. Because gold has an inverse relationship with the dollar; the stronger the dollar, the lower the price of gold. If the dollar's downward trend does not change, the probability of gold falling to the levels predicted in technical analysis will become much stronger.
arongroups

arongroups
NEW IDEA FOR ETHUSD

Looking at the trend on the four-hour timeframe, Ethereum could rise to the upper Bollinger Bands resistance at $4,172, provided it maintains support at $3,303.
arongroups
NEW IDEA FOR BTCUSDT

Looking at the trend on the four-hour timeframe, Bitcoin could rise to the upper resistance of the Bollinger Bands indicator at $105,952, provided it maintains support at $95,037.
Disclaimer
Any content and materials included in Sahmeto's website and official communication channels are a compilation of personal opinions and analyses and are not binding. They do not constitute any recommendation for buying, selling, entering or exiting the stock market and cryptocurrency market. Also, all news and analyses included in the website and channels are merely republished information from official and unofficial domestic and foreign sources, and it is obvious that users of the said content are responsible for following up and ensuring the authenticity and accuracy of the materials. Therefore, while disclaiming responsibility, it is declared that the responsibility for any decision-making, action, and potential profit and loss in the capital market and cryptocurrency market lies with the trader.