
anandahaidarr
@t_anandahaidarr

What symbols does the trader recommend buying?
Purchase History
پیام های تریدر
Filter
anandahaidarr
UPDATE MOVEMENT BULLISH MOMENTUM!
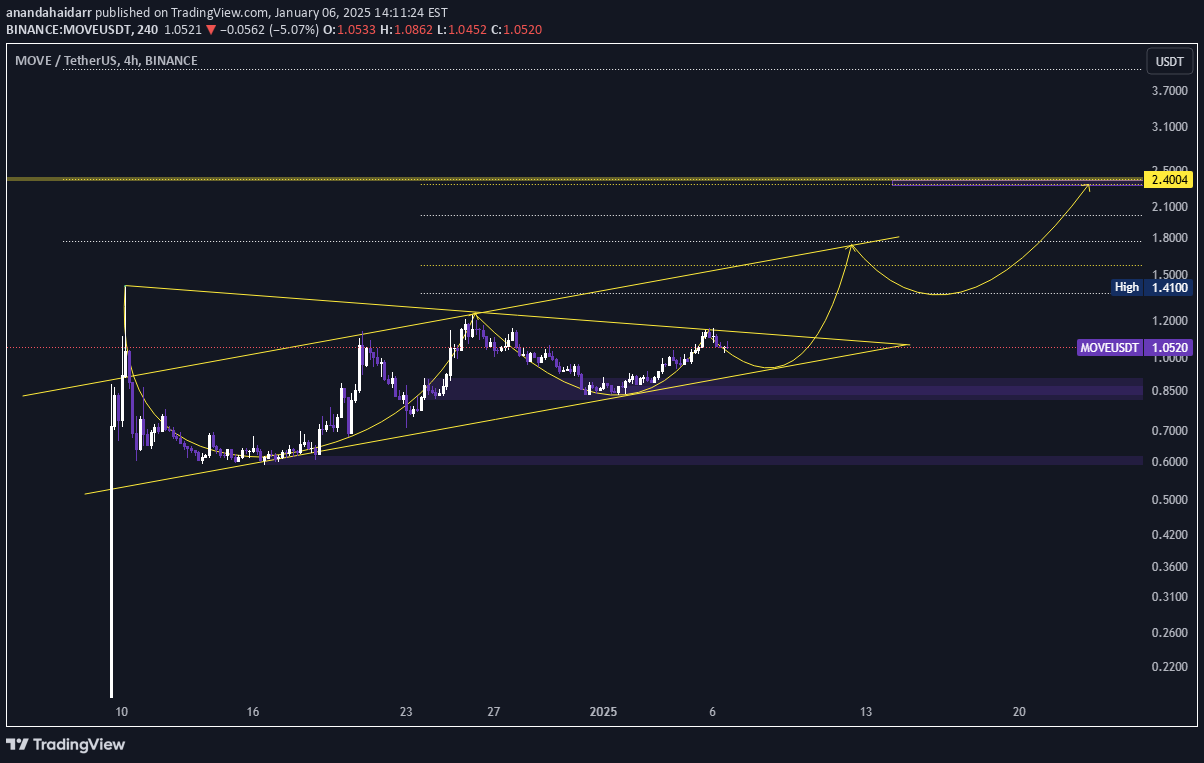
UPDATE! The chart of MOVE/USDT on the 4-hour timeframe displays a compelling bullish pennant formation, signaling a potential continuation of the uptrend. After breaking out from its support level at $0.82, MOVE climbed to approximately $1.05, where it encountered resistance along the upper trendline of the pennant pattern. The price is now consolidating within the pennant, testing the lower trendline support. This setup suggests that if MOVE maintains its support around the trendline and manages to break out of the pennant's upper boundary, the next target could be around $1.70. A potential correction might occur, bringing the price back to around $1.37, which would serve as a retest of previous resistance-turned-support before MOVE continues its ascent towards $2.40. The overall structure indicates a bullish bias, with the pennant formation typically acting as a continuation pattern in trending markets. Traders are likely watching for a breakout above the pennant's upper trendline to confirm the next leg up.
anandahaidarr
MOVEMENT BULLISH MOMENTUM!
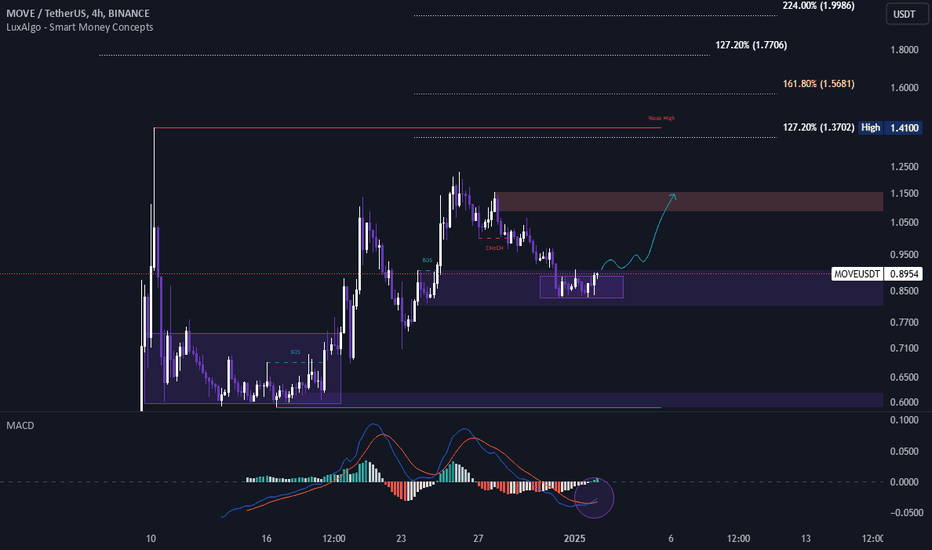
MOVE is currently showing an interesting setup after nearly a week of correction. The price has revisited the critical support zone marked by the purple box, which historically acted as a strong demand area. This zone represents a potential bottom, as evidenced by the formation of a double bottom pattern, a classic reversal signal indicating that sellers are losing momentum. MOVE has respected this support zone multiple times, confirming its strength as a demand area, suggesting that buyers are stepping in aggressively at these levels to prevent further decline. The double bottom formation is a bullish reversal signal, indicating that the price has found a solid floor, and if the price breaks above the neckline around $0.94, it could confirm the start of an upward move. Additionally, the MACD indicator is showing early signs of a bullish crossover, with the histogram bars contracting and the signal line reversing upward, signaling that momentum is shifting in favor of the bulls. If MOVE successfully breaks above the $0.94 resistance level, the next target lies in the red resistance zone around $1.15–$1.20, which corresponds to previous highs and Fibonacci levels, making it a logical area for profit-taking. However, if the price fails to hold the purple support zone, it could potentially retest the lower support around $0.70–$0.60. This setup highlights a pivotal moment for MOVE, where confirmation of momentum and volume is crucial before entering, as this will help minimize the risk of false breakouts. All eyes are now on whether MOVE can capitalize on this setup and break through the key resistance level, paving the way for a significant upward movement.
anandahaidarr
MOVEMENT BULLISH MOMENTUM!!!!
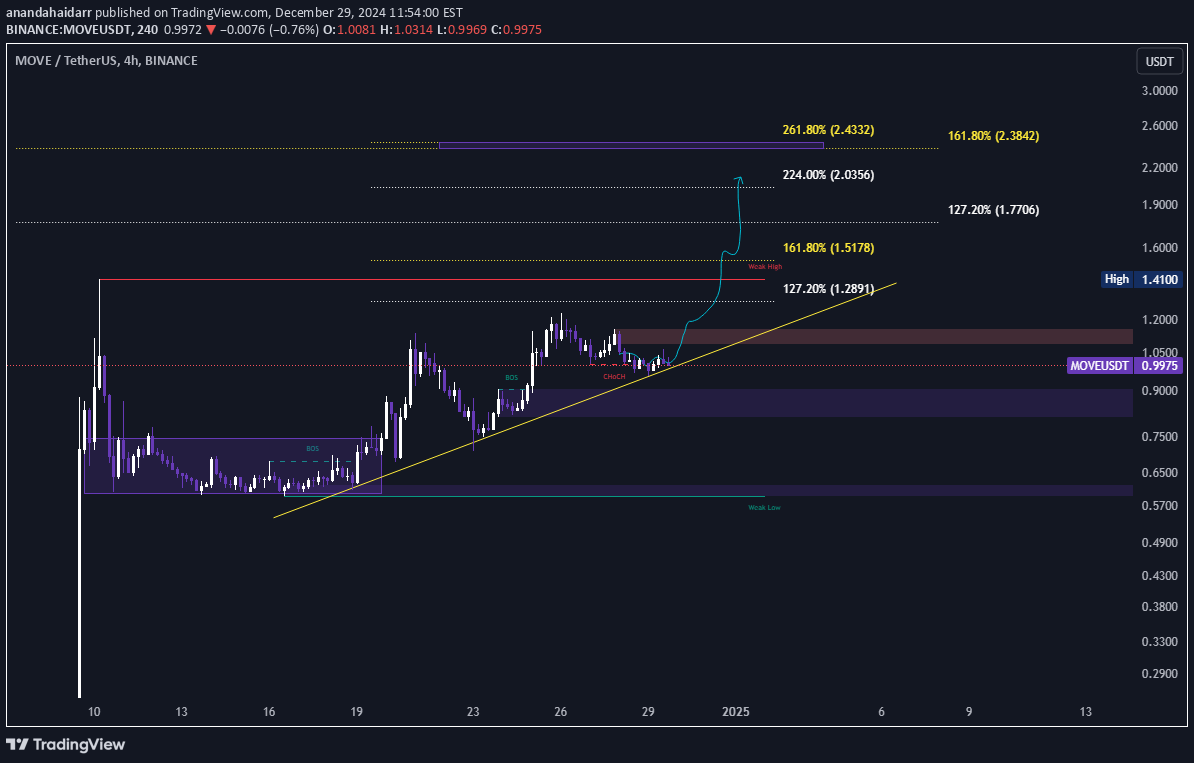
https://www.tradingview.com/chart/MOVEUSDT/0o9wQpQr-MOVEMENT-BULLISH-MOMENTUM/ After failing to break through the Break of Structure (BOS) area, the price corrected back to the trendline, which acts as a dynamic support. This move indicates that the trendline remains significant in maintaining the bullish structure. Currently, the price seems to be in a corrective phase, with potential consolidation around the trendline area before attempting another breakout to the upside. The Fibonacci Extension levels highlight the next bullish targets at 127.20% (1.2891) to 161.80% (1.5178), with the potential to reach 224.00% or even 261.80% if a breakout is successful. The Weak High area on the chart serves as a key resistance that needs to be cleared for further upward momentum. If the trendline holds, consistent higher lows will support the continuation of the bullish trend. However, if the price fails to hold above the trendline, the Weak Low area will act as the next support. Keep an eye on price action around this zone to confirm the next direction! 📈
anandahaidarr
MOVEMENT BULLISH MOMENTUM!!!
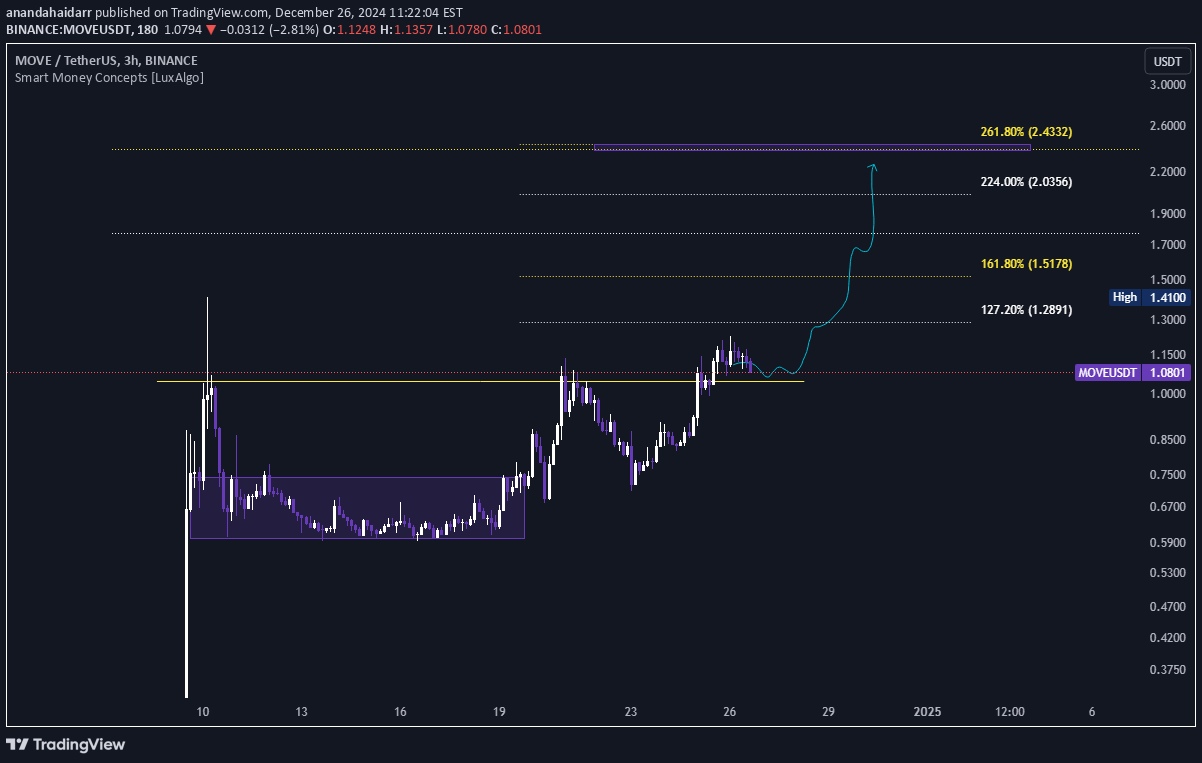
The MOVE/USDT chart shows an interesting price action. After completing an accumulation phase within the consolidation zone (highlighted in purple), the price successfully broke out to the upside, creating a Break of Structure (BOS) that signals a shift to a bullish trend. Currently, the price is retesting the yellow line (breakout zone), which now acts as a new support level. If this retest holds and the price stays above the yellow line, there's strong potential for further upside with Fibonacci Extension targets: - 127.20% (1.2891 USDT) as the first target, - 161.80% (1.5178 USDT) as the second target, and - 261.80% (2.4332 USDT) as the extended bullish target if momentum continues to build. However, if the price fails to hold this support, a deeper correction could occur before resuming the uptrend. Keep an eye on this retest area to confirm the breakout. 🚀 #MOVEUSDT #CryptoAnalysis #Breakout hf
anandahaidarr
GRASS BULLISH MOMENTUM!!!
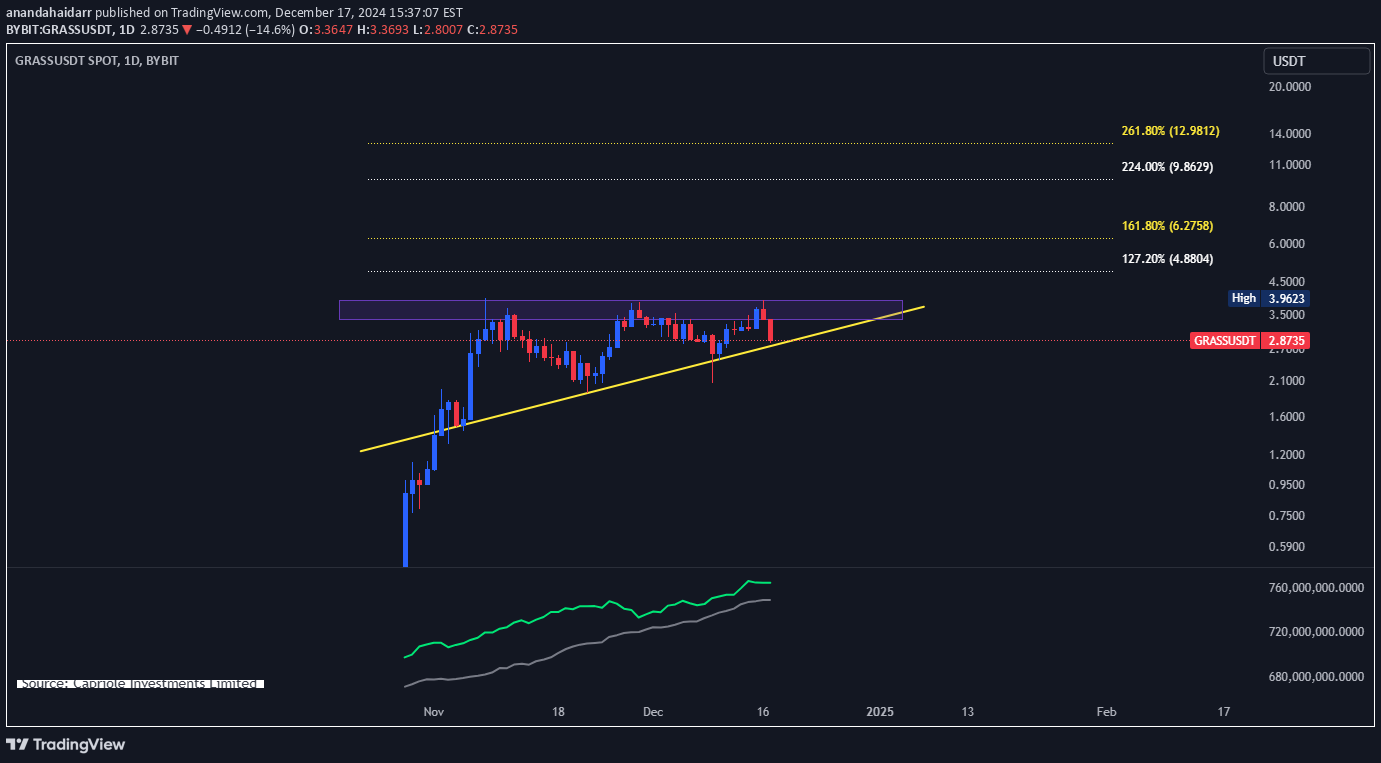
The GRASS/USDT chart shows a strong uptrend supported by a rising trendline (yellow) acting as dynamic support. Price is currently consolidating under a critical resistance zone (highlighted in purple), where sellers are active around 3.96 USDT. If the price holds above the trendline and breaks through this resistance, it could trigger a significant bullish move. Using Fibonacci Extension levels, the potential upside targets are: - 127.20% (4.88 USDT) as the first target, - 161.80% (6.27 USDT) as the second target, and - 261.80% (12.98 USDT) as the extended bullish target if momentum accelerates. The rejection from the resistance combined with a 14.96% drop signals caution, but as long as the trendline holds, the bullish structure remains intact. A breakdown below the trendline, however, could shift momentum to bearish and invalidate this setup. Keep an eye on the trendline bounce for a potential breakout confirmation. 🚀 #GRASSUSDT #CryptoAnalysis #Uptrend #Trading
anandahaidarr
SOLANA BULL FLAG BULLISH MOMENTUM!!!!

The Solana (SOL/USD) chart shows a Bullish Flag pattern, which is a continuation signal that forms after a strong upward move (flagpole) followed by a short period of consolidation in a downward-sloping channel (flag). The yellow trendlines mark this consolidation area, and if the price breaks out above the resistance line, there's a solid chance for a big move up. The target is calculated based on the length of the flagpole, with a potential gain of 58.68%, aiming for around $311.17 (Fibonacci 161.80%). If the bullish momentum continues, the next target is $366.55 (Fibonacci 224.00%). The green zone highlights the reward potential, while the stop-loss at $182.64 limits risk to 6.62%, giving a solid risk-to-reward setup. With the main trend still bullish and strong support near $195.59, a breakout could signal the continuation of Solana's uptrend. 🚀 #Solana #BullishFlag #CryptoAnalysis #SOLUSD #Trading
anandahaidarr
BITCOIN BULLISH MOMENTUM IN WEEKLY!!!!

The weekly BTC/USD chart above shows an Bullish Flag pattern, where Bitcoin’s price is trending upward within parallel support and resistance lines (yellow lines). This pattern often suggests a potential breakout if the price manages to break above the channel’s resistance. To set Fibonacci targets in the range of $90,000 to $100,000, let’s add levels that align with that price zone: 1. 150.00% ($90,000) - This can act as a strong psychological level within the bullish move, marking the start of the $90k range. 2. 161.80% ($94,407) - A common Fibonacci extension level that is close to the midpoint between $90k and $100k. 3. 175.00% ($100,000) - Reaching this level would mark a major milestone and could trigger significant profit-taking. These Fibonacci targets highlight possible resistance areas for Bitcoin within the $90k - $100k range, especially if momentum remains strong. This pattern suggests Bitcoin could keep climbing if a breakout happens, with these Fibonacci levels as possible profit-taking points.
anandahaidarr
SOLANA BULLISH MOMENTUM!! GOING UP TO $200-$240

Solana Bullish Momentum! On June 27, 2024, Solana is showing some strong bullish momentum, with a potential price target between $200-$240. The formation of a butterfly chart pattern suggests this upward movement. This pattern, often seen as a sign of a price reversal or new trend, indicates that Solana might see a significant rise before any correction happens. Increased trading volume and confirmation from other technical indicators like RSI and MACD add to this bullish outlook. Additionally, support and resistance levels suggest that Solana has room to move up before hitting overbought territory. This is definitely something to watch closely, as Solana's movements in the near future could lead to major changes in the crypto market. Don’t miss out on this opportunity! #Solana #Crypto #Bullish #ButterflyPattern #TechnicalAnalysis #MarketAnalysis #CryptoTrading
anandahaidarr
BITCOIN BULLISH MOMENTUM!! GOING UP TO $90K - $100K

Bitcoin has been rejected five times in this value area, but the resistance is getting weaker, hinting at a potential bullish breakout. This isn't a bad area to assume that this dip might be worth buying. There's a potential for the trend to continue along the trendline at the 13 and 21 daily moving averages, getting close to the bullish order block area on the weekly chart. Looking at the technical analysis, this chart shows a strong possibility of reaching $90K - $100K. Additionally, the inflow from big institutions like BlackRock, Fidelity, and others adds to this potential. Let's see. 🥂
anandahaidarr
RENZO BULLISH MOMENTUM!!!!

Renzo Protocol is a prominent player in liquid re-staked ETH, issuing ezETH tokens that can be used in various DeFi applications. They also launched a governance token, REZ, which has potential for growth and future dividends. I want to highlight a significant development in the Ethereum ecosystem: the upcoming launch of the EigenLayer token. EigenLayer enables Ethereum stakers to rehypothecate their positions, using the same ETH collateral to secure other networks. The distribution of these tokens is based on participation in restaking, with the protocol gradually onboarding new networks. This opens opportunities for solutions targeting smaller investors who can’t run validator nodes (which require 32 ETH and specialized hardware) and prefer liquidity. Liquid restaked Ethereum tokens have emerged, with Renzo’s ezETH being a notable example. Renzo allows users to restake ETH and receive ezETH tokens, which can be used across DeFi applications for lending, collateralizing, or providing liquidity. Renzo’s governance token, REZ, has shown promising growth potential. Holding and staking REZ may yield future dividends and bonuses for farming subsequent airdrop seasons. Accumulating points through holding ezETH determines your share of future EIGEN and REZ distributions. EIGEN could mirror the success of Lido’s governance tokens, which saw substantial appreciation. With Ethereum potentially outperforming Bitcoin due to ETF flows, investing in farming EIGEN and REZ while riding ETH’s trend appears advantageous. To participate, you need familiarity with hardware wallets, browser extension wallets (like MetaMask or Rabby Wallet), and decentralized apps. Renzo operates on layer 2 networks, offering significant fee reductions compared to Ethereum’s layer 1. Steps to get started: 1. **Acquire ETH**: Purchase ETH from an exchange and withdraw it to your Arbitrum network ETH address. 2. **Restake ETH**: Visit (app.renzoprotocol.com/restake). Connect your wallet, select the Arbitrum network, and restake your ETH to receive ezETH. 3. **Track Balances**: Use a dashboard app like (debank.com/profile) to monitor your holdings. We are looking at a possible extra yield from airdrops which can be substantial (maybe 2-3x gains) on top of an asset that can go up 3 to 10x from here!
Disclaimer
Any content and materials included in Sahmeto's website and official communication channels are a compilation of personal opinions and analyses and are not binding. They do not constitute any recommendation for buying, selling, entering or exiting the stock market and cryptocurrency market. Also, all news and analyses included in the website and channels are merely republished information from official and unofficial domestic and foreign sources, and it is obvious that users of the said content are responsible for following up and ensuring the authenticity and accuracy of the materials. Therefore, while disclaiming responsibility, it is declared that the responsibility for any decision-making, action, and potential profit and loss in the capital market and cryptocurrency market lies with the trader.