
aminsmithfx
@t_aminsmithfx

What symbols does the trader recommend buying?
Purchase History
پیام های تریدر
Filter
aminsmithfx
BTC Bearish continuation incoming
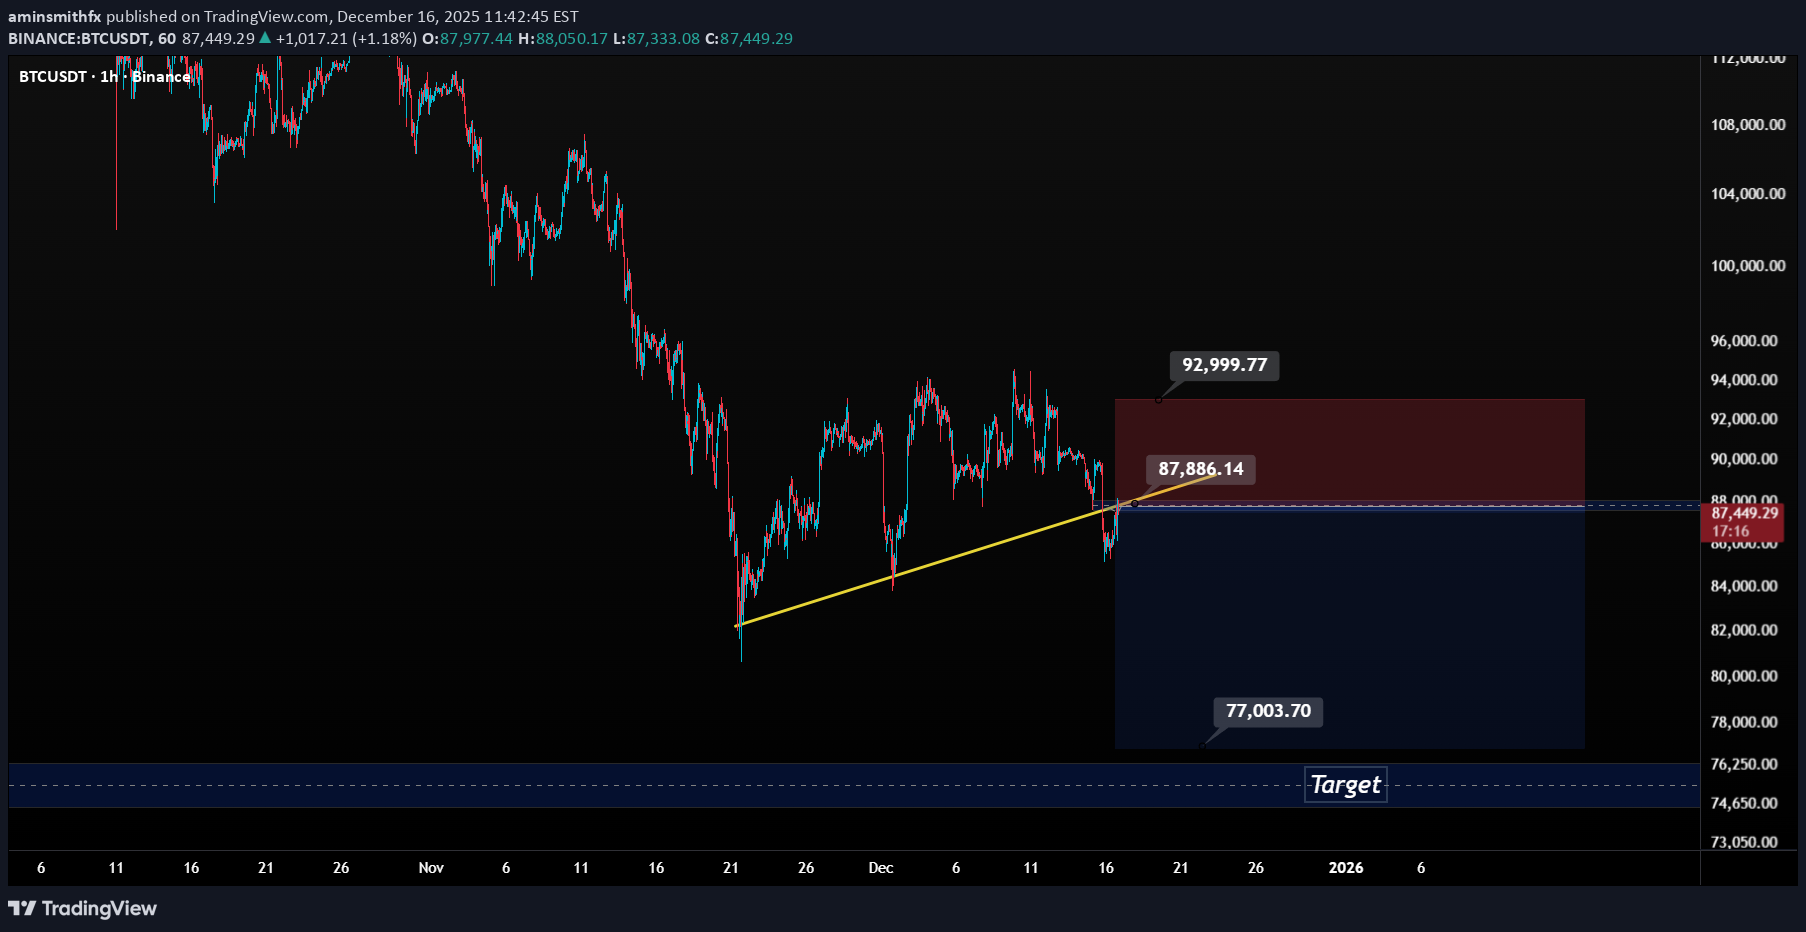
Price rejected hard at the descending trendline, now consolidating below 88k key level. Expect breakdown to 77k target, then full retest of 76k lows. Bulls calling for 100k+ are ignoring the macro downtrend – this is distribution, not accumulation. Short bias until proven otherwise. Risk management first." Controversial Title: "Bears Still Own Bitcoin – 100k Moonboys Are Delusional" Post this exactly like that. It’ll trigger the perma-bulls, get engagement, and separate real traders from hopium addicts. No mercy – if your setup is wrong, the market will punish you anyway. Grind smart.
aminsmithfx
پیشبینی انفجاری بیت کوین تا ۲۰۲۶: آیا ۱۰۰ هزار دلار شکسته میشود؟
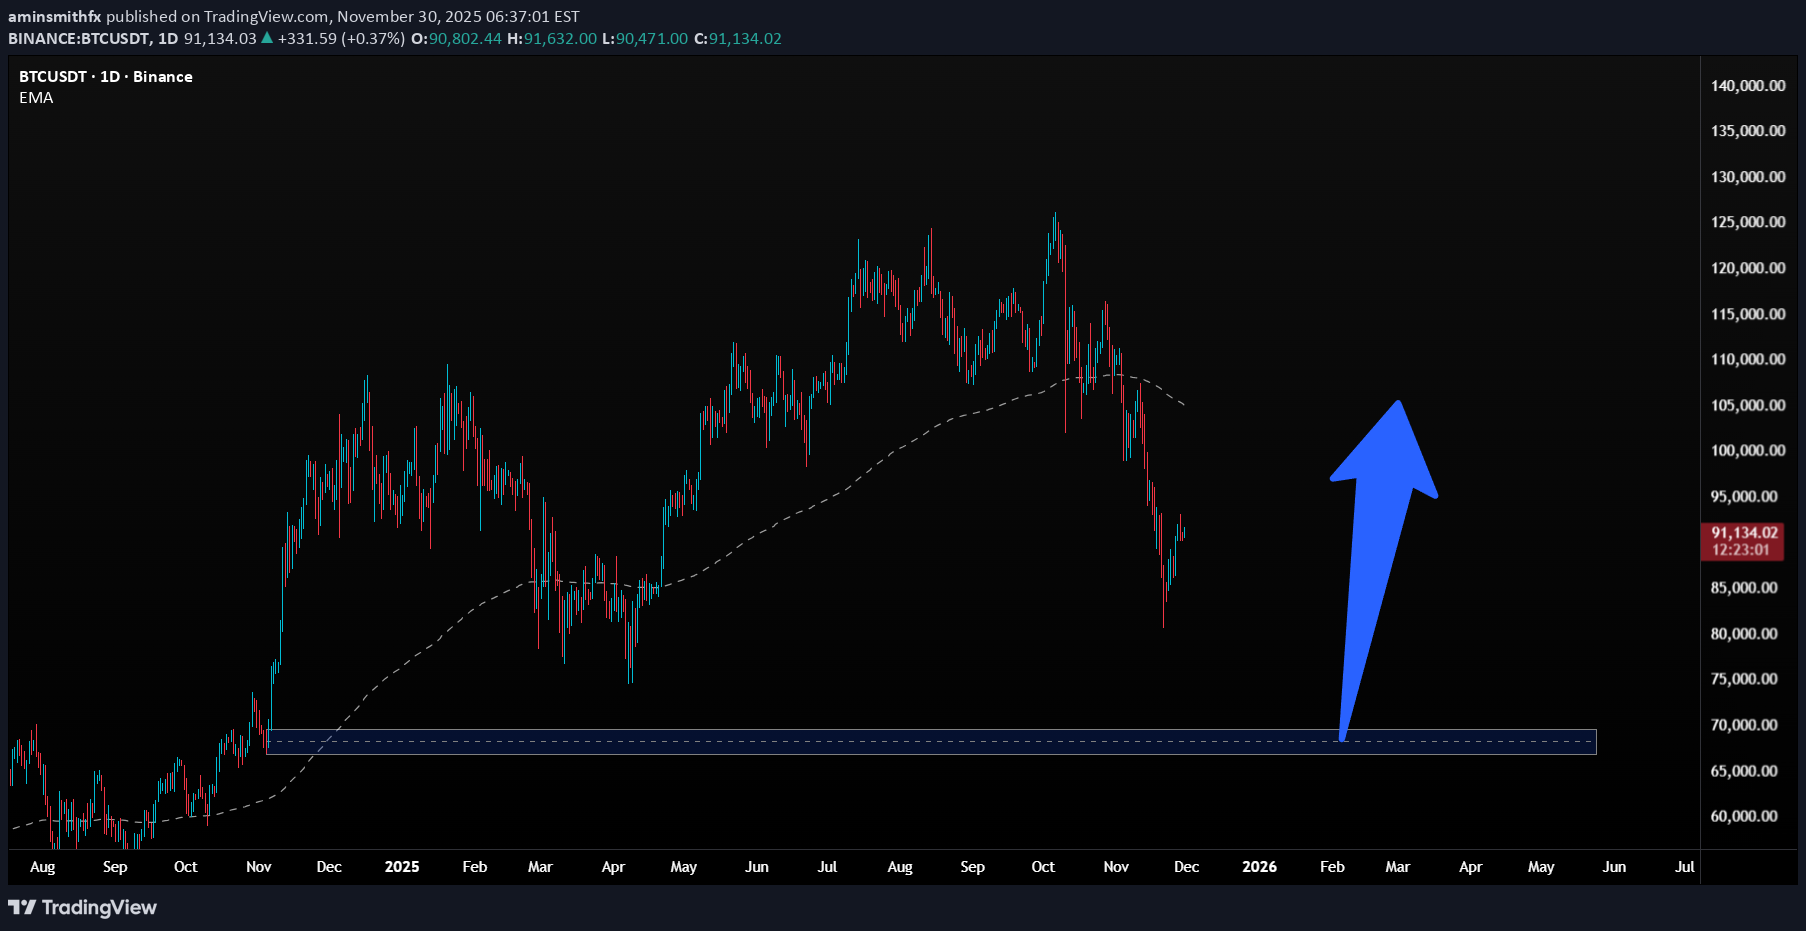
As long as Bitcoin trades below 100K, downside pressure dominates. There’s roughly a 55% chance of dropping to 78–76K and about a 30% chance of a deeper fall to 70–66K. If these drops occur, the typical rebound target is 92–100K, and only a solid daily close above 100K opens the path toward 108–112K and potentially 116–124K. If price climbs without a deeper correction, the realistic ceiling remains 108–112K, with a stronger scenario reaching 116–124K.
aminsmithfx

aminsmithfx
Bitcoin Breakout Bonanza - Ride the Wave, Bro

aminsmithfx
Is the Altcoin Season Over?
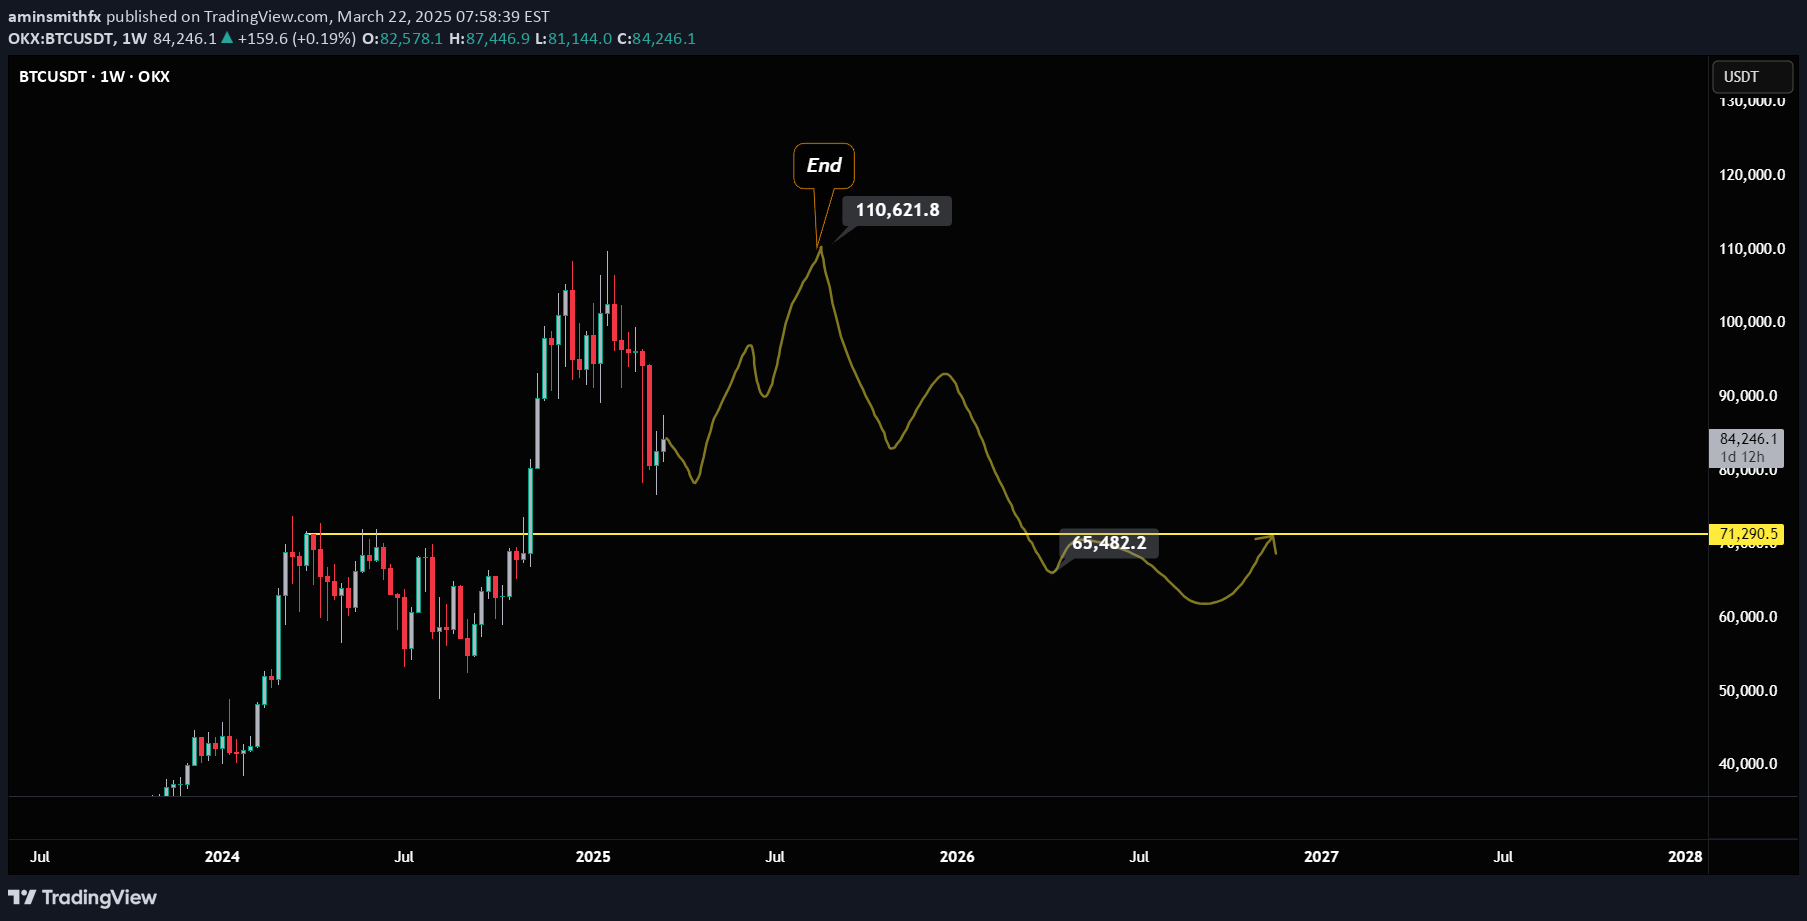
Is the Altcoin Season Over? What's truly unfolding for Bitcoin is precisely the weekly analysis I've laid out for you. While many of you might be eagerly anticipating an extraordinary altcoin season, the harsh reality is that there isn't going to be one. Instead, we've been riding a Bitcoin-dominated season. And once the trend you see in the chart plays out, the market will essentially come to a close, paving the way for a heavy downward spiral for both altcoins and Bitcoin. It's a bitter truth, but it's the reality we're facingBitcoin's recent move has been consistent with my analysis, and I expect a move similar to the lines I drew in the near future.
aminsmithfx
ETH: Sell the Pop, Buy the Dip

Overall Vibe: We're seeing a bit of a mixed bag here. ETH had a nice run-up, but it's starting to look like it might be running out of steam. The Sell Zone: You've marked a key area around $3,053.38 as a "Sell Zone." This tells me you think there's a good chance we'll see some selling pressure kick in around that level. Smart move to call that out. Potential Dip: If things play out like you expect, you're anticipating a dip down to around $2,622.10, maybe even lower. That's where your "Buy Zone" comes into play. Why This Makes Sense: Looking at the chart, I see a few things that support your analysis: Resistance: The $3,053 area lines up with some previous resistance levels. That's a classic spot for sellers to step in. Heikin Ashi Candles: These candles smooth out the price action and can make it easier to spot trends. I see some red candles forming, which could signal a shift to the downside. Keep in Mind: Market's Gonna Do What It Wants: No chart is 100% accurate. Be ready to adapt if the market throws a curveball. Risk Management is Key: Always have a plan for how you'll manage your risk if the trade goes against you. Overall: Not bad at all! Your analysis is clear and well-reasoned. I like how you've identified key zones and explained your thinking. Keep an eye on those levels and see how it plays out. Disclaimer: I'm just an AI, so this isn't financial advice. Always do your own research before making any trades.
aminsmithfx
SUI is Setting Up for a Massive Rally!

SUI is currently in a retracement phase, but the BUY ZONE around $2.59 is where the real opportunity lies! 📈 This area aligns perfectly with strong support levels, making it an ideal accumulation zone before the next explosive move. Once SUI bounces from this level, we could see a parabolic move toward $7.76+, representing a massive upside potential! 💰 The structure suggests a strong uptrend continuation, with bullish momentum ready to take over. 👀 Smart money is watching—are you? Don't miss out on this breakout! 🚀🔥 #SUI #Crypto #Bullish #Altcoins
aminsmithfx
ORCA

This currency is likely to fall another 25% It is a very good opportunity to buy and hold My price prediction for this currency in a bullrun 2025 is $8-$10
aminsmithfx
Enjin Coin +1400% Profit

Inflation Analysis: Since nearly all tokens are already in circulation, the project has very low inflation, minimizing the risk of devaluation due to additional supply. Price Prediction for the 2025 Bull Run: Enjin Coin, as one of the leading projects in NFTs and blockchain gaming, has strong potential. With the growth of the metaverse and gaming-related projects, Enjin could secure a significant market share. In an optimistic scenario, ENJ's price could reach $3–$5.5 during the 2025 bull run. 🔗 Note: ENJ is a compelling option for investors interested in the NFT and metaverse ecosystems. 💎
aminsmithfx
ETH 60% Profit

Buy after heavy trend line break Make easy 60% profit
Disclaimer
Any content and materials included in Sahmeto's website and official communication channels are a compilation of personal opinions and analyses and are not binding. They do not constitute any recommendation for buying, selling, entering or exiting the stock market and cryptocurrency market. Also, all news and analyses included in the website and channels are merely republished information from official and unofficial domestic and foreign sources, and it is obvious that users of the said content are responsible for following up and ensuring the authenticity and accuracy of the materials. Therefore, while disclaiming responsibility, it is declared that the responsibility for any decision-making, action, and potential profit and loss in the capital market and cryptocurrency market lies with the trader.