
afinalboss
@t_afinalboss

What symbols does the trader recommend buying?
Purchase History
پیام های تریدر
Filter
afinalboss
راز مربعهای گن: پیشبینی دقیق قیمت تا ۷۴,۴۳۴ دلار!
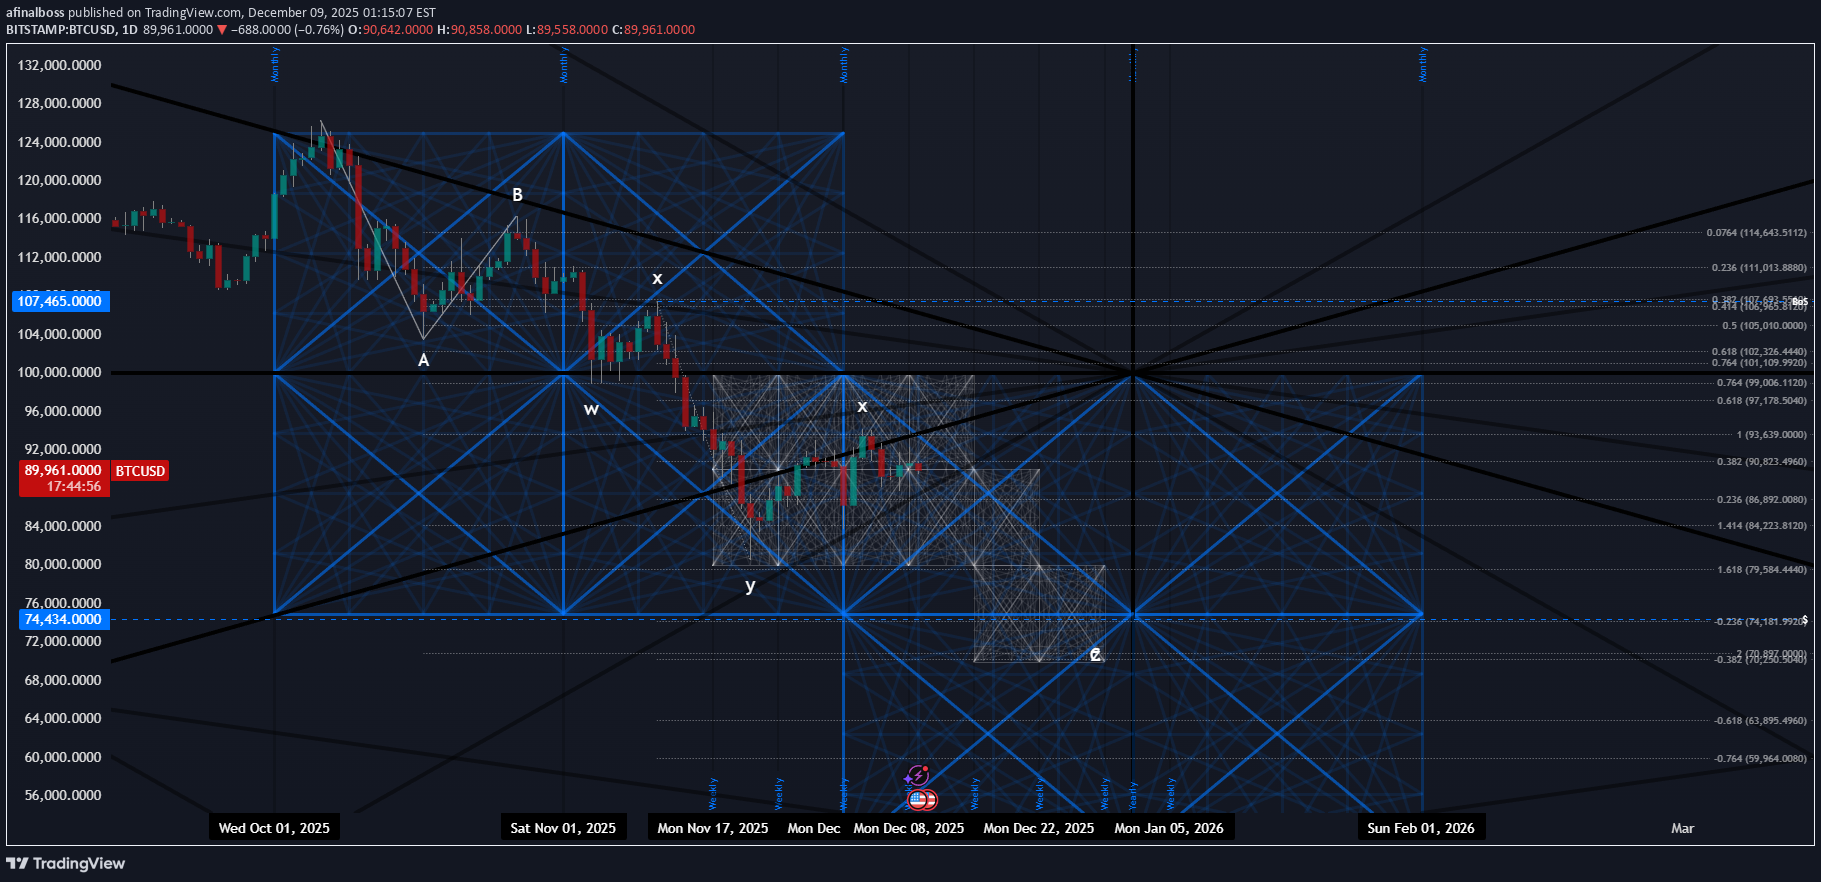
Yearly candles in black with a range of $0 - $100,000 Monthly candles in blue with a 25k range (0-25k, 25-50, 50-75, 75-100) Weekly candles in white with 10k range (0-10k, 10-20, 20-30 etc..) Wave count is expecting a push lower (before a BoS) to a minimum target of $74,434 to complete the ABC corrective wave. At first glance, the Gann boxes have price at a decent "time cycle" and if we get a move lower from here or within the current blue box's downward channel shown here, price should stay within or below the smaller-scale white boxes; until making contact with the bottom-side of the blue channel or its intersecting geometry.
afinalboss
جعبه گن 100K: نقشه راه موجهای صعودی بازار (از صفر تا 100 هزار)
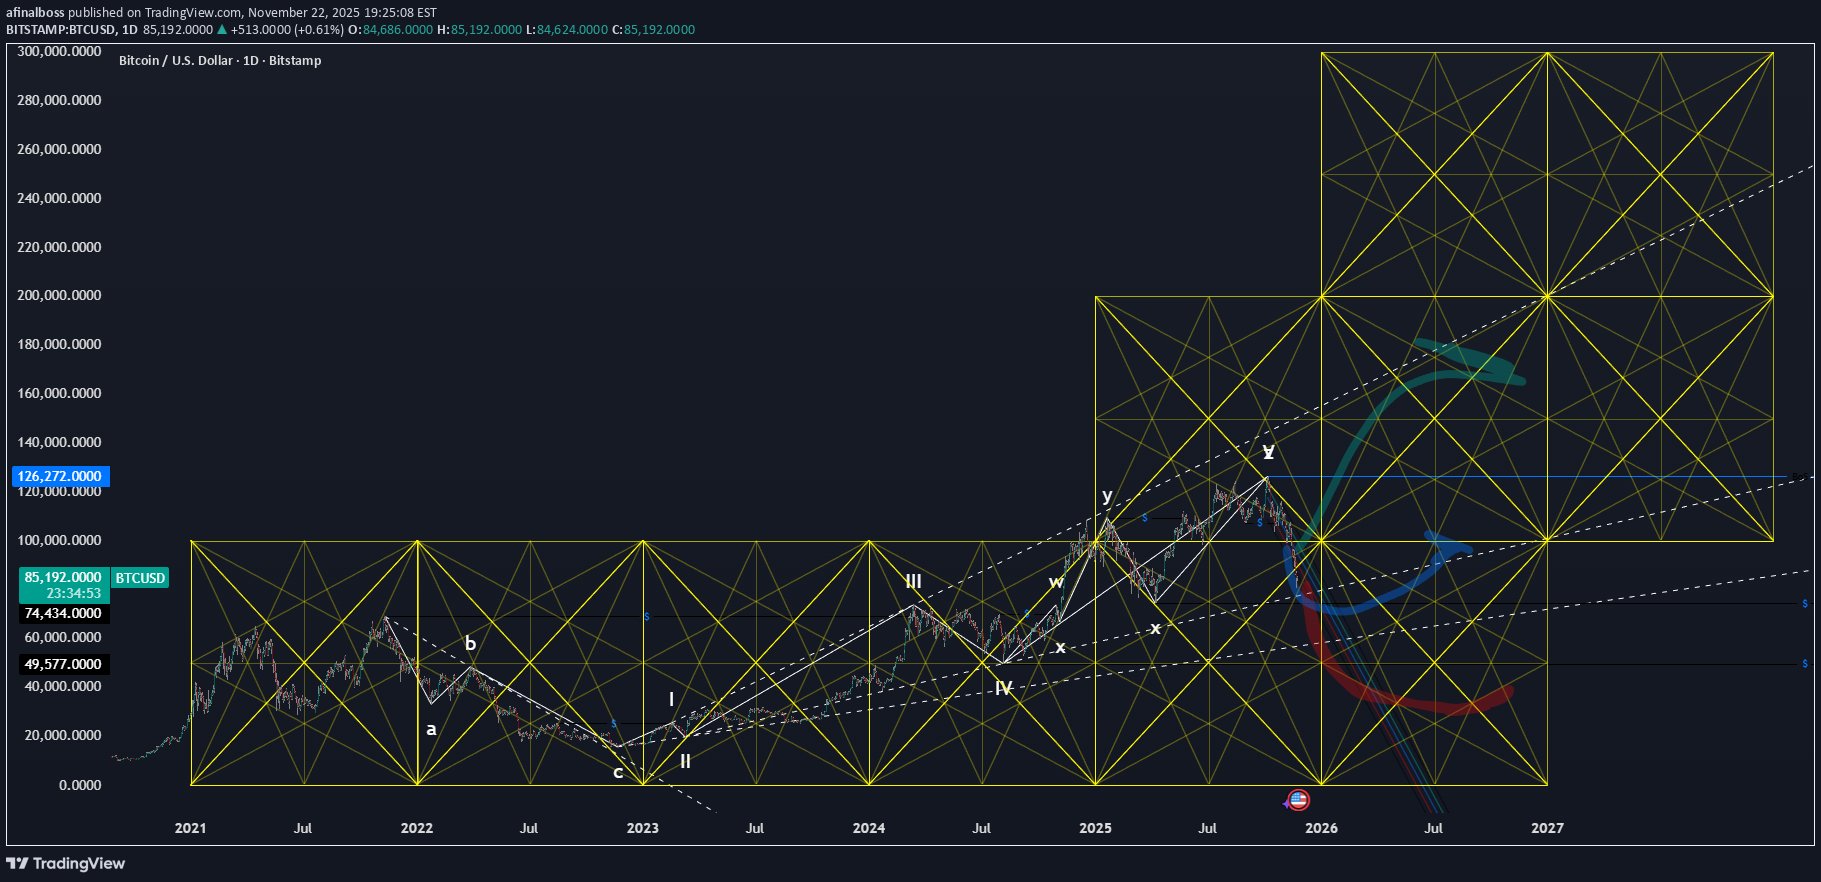
0-100K, 100k-200k, 200k-300k etc... Both the red and blue highlighters are expected minimums for a completed ABC corrective wave, leaving an anticipated 5 wave move higher to follow. Dashed lines are simple trend lines from the waves (placed from waves 0-2 and 1-3).Heres a zoom in closer with what i think a valid wave count could be... both are valid and either one should result with a steady and clear 5 wave move higher.
afinalboss
Fractal Waves

This sort of visually shows the reason i trade a variant of EW that simply focuses on the completion of the "Corrective Waves" and unlike EW corrective waves, that have a series of different corrections that can take place; my version has a couple clear rules for one simple corrective wave to form and complete. Another nice difference of my variation compared to EW is that after the corrective wave comes in you then expect a 5 wave impulse to follow but that 5 wave move will a fractal bigger, to explain in simplest terms. Fractal waves, from smaller to larger. This would have Bitcoin well over 100K :)Some targets
afinalboss
Yearly Range Candles

***Back-Test Yearly Candle Range of 2020 and 2021 -Squared to the next candle Given the recent price action curling into the arc and the fact we're coming to the end of the Gann square itself makes me think we might continue to drop until then.
afinalboss
BTC hourly buy

Have a plan and trade that plan. Plotted this out a few days ago and its shaping up nicely now. -Top-down ICT analysis. -Hourly range with a run higher (enticing bulls) and a clear move lower, running bull stops and shifting general bias to the down-side. -levels hit -Stop run -New monthly candle PO3 in-line with higher TF analysis -50% FVG
afinalboss
Hourly BTC Gann Sell

A continuation of the tagged, higher time-frame idea. 10k monthly overlay 1/4'sHighlighting the anticipated paths for both bullish and bearish routes, but since i have specific bearish Gann squares id like to see the bearish path lining up with the Gann Box and running into the higher time-frame Gann Square.
afinalboss
Bearish BTC Gann

Yearly, Monthly, Weekly, Daily and Hourly ICT levelsMost recent swing low-high and the previous high-low squared with a 1-1 time cycle-Would typically expect price to ride the arc to the downside...which in this case, if correct and we drop from here it would happen before November, otherwise the next major time cycle and price level from the Gann square would be expected.If we dont move higher here, the SSL from the Yearly chart is $3,124.51 if we start moving down like that, its likely going below $1Weekly SSL @ $38,524.00
afinalboss
BTC Bullish Wave Count

-Prices may vary dramatically-Times should have less of a margin of error -Waves counts are the main focus hereI always have bearish and bullish ideas for wave counts, but from this perspective I would expect a clear 5 wave move higher here, with 2 clear ABC corrective waves on the way (blue highlighter)The most recent move off the high (wave 3-4) has satisfied all of my criteria for a standard ABC corrective pattern. The 5th and final wave typically has the largest and most volatile moves, which is another difference between my wave system and Elliot Waves.
afinalboss
Why not coins

I don't believe crypto will be the future of finance, like I once did.. Mostly because that change hasn't happened in the real world with your everyday stores and purchases using it world-wide. The people that sold on the way past 10k-20k-60k etc. are all out of the game and now we could easily run it the other direction, crushing bulls dreams along the way.Ultimately I feel crypto will fail, but just incase I'm wrong and the USD does crash in the coming years, then at least I've got a few cheap coins, that should take off and skyrocket, if the USD flops. Shown here is a Gann Square laid on the Weekly chart to a squaring method that's fairly common but I've modified slightly. Inside the square are 10th's ratios within a Gann Box. Lastly Elliot Wave ABC corrective wave on the weekly chart has satisfied all of my rules and could very-well be pushing this market into new higher highs.
afinalboss
Weekly Vizion

Weekly, Daily, Hourly basic ICT analysis.Weekly (Monday - Monday) Gann Boxes with 10k halves.-Long bias would be to find support off of the minor geometry in the Gann Box, which it is currently just above. Not the best levels to manage risk from for a buy position; in my opinion.-Short bias for this market would have price move back to the major 45º Gann Box angle and likely dropping to the lower box and its respective 45º angle; making this a great entry on the short and managed risk above the recent highs. Correlation with DXY. - I would consider the dxy "over extended" at this point to the down-side and if its to continue lower would likely LAUNCH bitcoin and other markets much higher.-Economically speaking, the USA still wants presence/respect globally, especially with "hot and cold wars" going on; it makes a lot of sense to see a bit of a flex across all markets.-You can always argue from a "conspiracy theorists perspective" that bitcoin itself was created to eventually pump money into selling the USD, thus driving its value up, from the typical perspective of how markets move.
Disclaimer
Any content and materials included in Sahmeto's website and official communication channels are a compilation of personal opinions and analyses and are not binding. They do not constitute any recommendation for buying, selling, entering or exiting the stock market and cryptocurrency market. Also, all news and analyses included in the website and channels are merely republished information from official and unofficial domestic and foreign sources, and it is obvious that users of the said content are responsible for following up and ensuring the authenticity and accuracy of the materials. Therefore, while disclaiming responsibility, it is declared that the responsibility for any decision-making, action, and potential profit and loss in the capital market and cryptocurrency market lies with the trader.