
adriyan_junior
@t_adriyan_junior

What symbols does the trader recommend buying?
Purchase History
پیام های تریدر
Filter
Signal Type
adriyan_junior
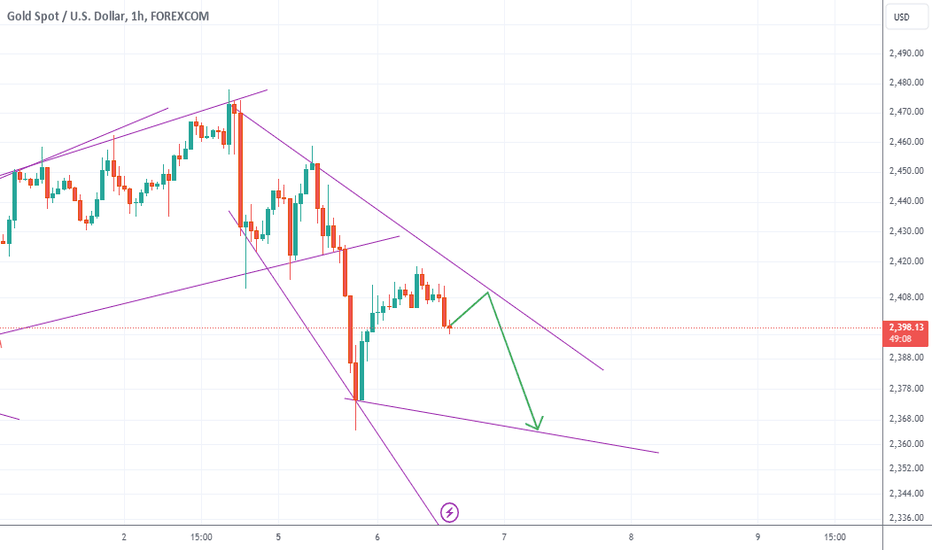
Gold Analysis Today Current Trend: Downtrend Key Observation: - Gold is in a strong downtrend, indicated by lower highs and lower lows. - Price action remains below the descending trendline, confirming bearish momentum. # Trend Analysis: - Trendline: The price is consistently below the downward trendline, indicating ongoing bearish pressure. # Price Action: - Bearish Patterns: Look for bearish candlestick patterns, such as bearish engulfing or shooting star, near resistance levels. - Volume: Increased volume on down moves suggests strong selling interest. # Support and Resistance Levels: - Resistance: Recent highs where selling pressure is evident. - Support: Recent lows where buying interest might appear. Trade Plan: 1. Trend Confirmation: Ensure the price stays below the trendline to confirm the downtrend. 2. Entry: Consider selling near resistance levels if bearish patterns emerge. 3. Stop-Loss (SL): Place above the resistance level. 4. Target Profit (TP): Set at the support level. Summary: Gold is in a confirmed downtrend. Look for bearish signals near resistance for selling opportunities, with stops above resistance and targets at support.
adriyan_junior
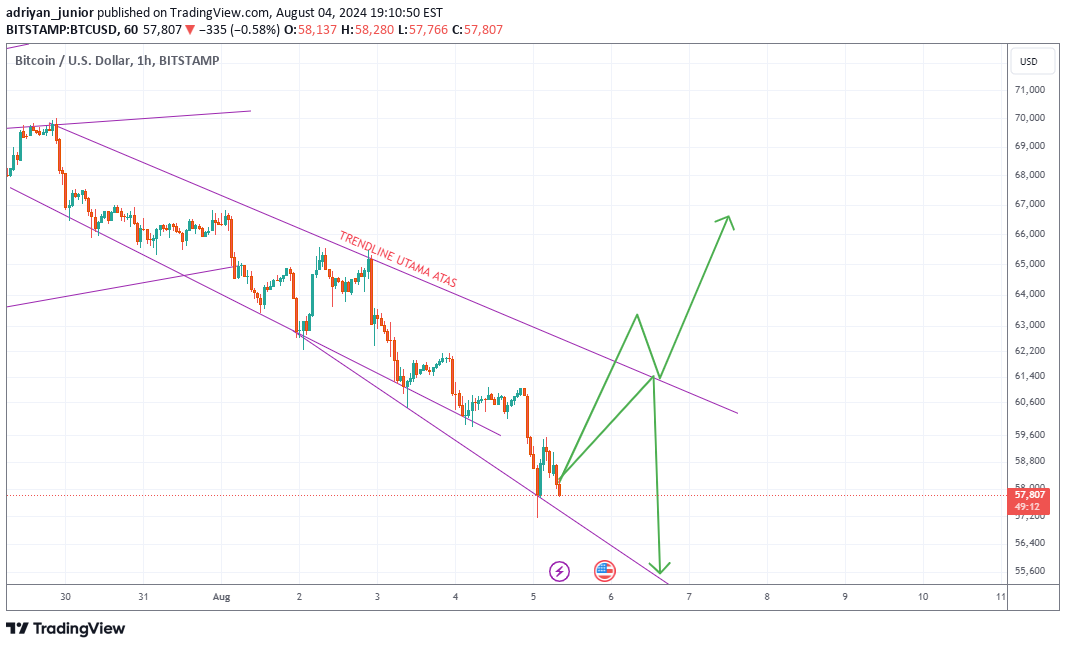
Current Trend: Strong Downtrend Key Observation: - Bitcoin is currently in a strong downtrend, evidenced by lower highs and lower lows. - However, a short-term upward move towards the trendline is anticipated before resuming the existing downtrend. If the price closes and remains consistently above the trendline, it could signal a potential trend reversal to the upside. Price Action Analysis: - Downtrend Indicators: Current bearish price action supports the continuation of the downtrend. - Short-Term Upward Move: A temporary rise towards the trendline is expected, presenting a potential selling opportunity if the price meets resistance. - Reversal Signal: If the price closes above the trendline and remains consistent, watch for bullish candlestick patterns, such as bullish engulfing or hammer, indicating the start of a new uptrend. Conclusion: Bitcoin remains in a strong downtrend, but a short-term upward movement to the trendline is predicted. Traders should be cautious and monitor for a potential reversal if the price closes and stays above the trendline. Consistent closes above the trendline would suggest a shift to an uptrend, making it essential to look for bullish confirmation before entering LONG positions.
adriyan_junior
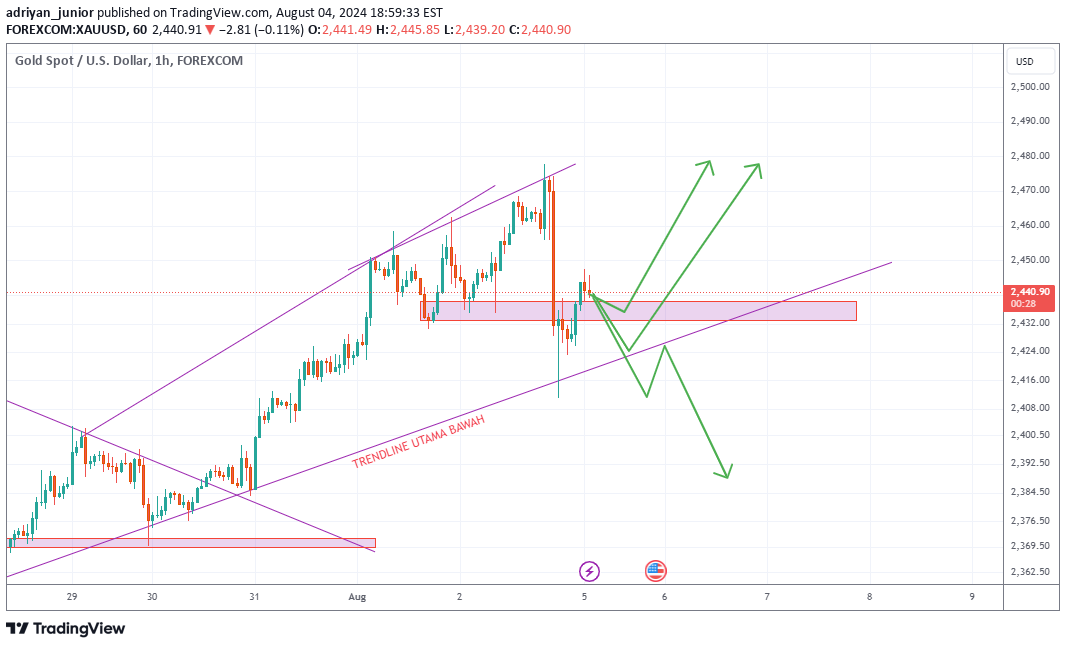
Current Trend: Strong Uptrend Key Observation: - Gold is experiencing a strong uptrend, characterized by higher highs and higher lows. - However, it is crucial to monitor the support levels and the trendline closely. If the price closes and remains consistently below the trendline, it indicates a potential trend reversal to the downside. Price Action Analysis: - Uptrend Indicators: Current price action shows strong bullish momentum with key support levels holding firm. - Reversal Warning: A close below the trendline, coupled with bearish candlestick patterns such as a bearish engulfing or a shooting star, could signal the start of a downward move. Conclusion: While Gold is in a robust uptrend, traders should be cautious of a potential reversal if the price closes and consistently stays below the trendline. Monitoring support levels and looking for bearish signals below the trendline will be critical for identifying a possible downtrend.
adriyan_junior
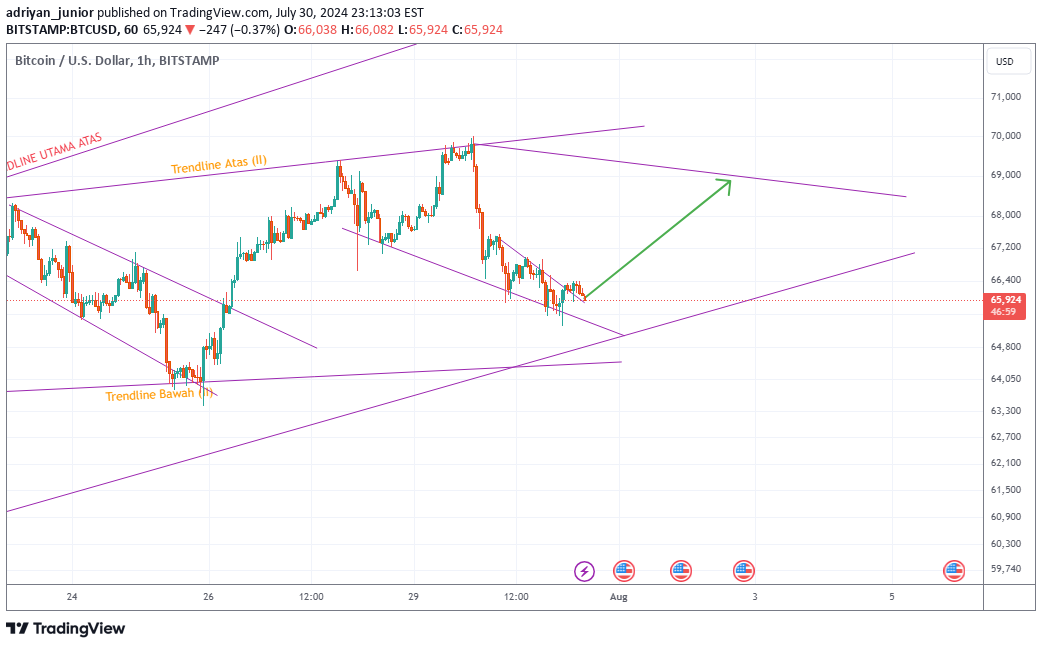
Bitcoin is showing strong bullish momentum, with price action confirming an uptrend through higher highs and higher lows, supported by increasing volume. If this trend continues and Bitcoin breaks through intermediate resistance levels, a LONG position targeting $68,900 could be feasible, provided key support levels hold to sustain the upward movement. SL at $65154
adriyan_junior
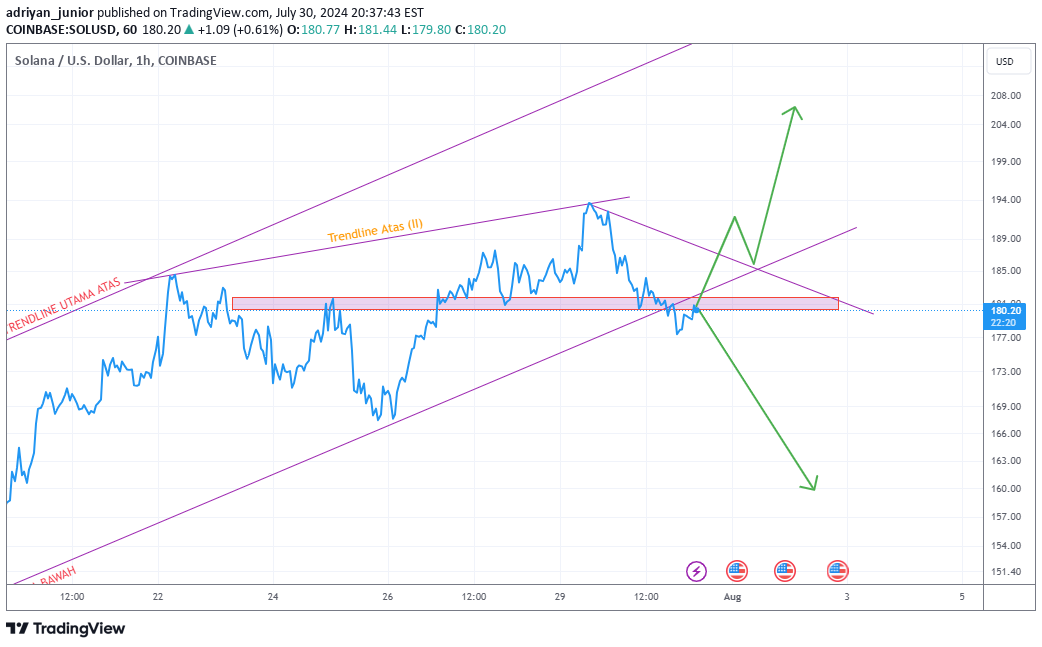
Solana (SOL) Trade Scenarios for Today Current Price: (Insert current price here) #Scenario 1: SELL at $180 1. Trend Analysis: - Trendline: Check if there is a bearish trendline confirming the downtrend. - Confirmation: Ensure price action is indicating a potential decline at $180. 2. Price Action: - Bearish Signals: Look for bearish candlestick patterns (e.g., bearish engulfing, shooting star) near $180. 3. Support and Resistance Levels: - Resistance Level: $180 (where you plan to SELL). - Support Level: Identify a recent support level to place your stop-loss. SELL Trade Plan: - Entry Point: $180 - Stop-Loss (SL): Above recent resistance level. - Target Profit (TP): Set a level below $180 where the price has previously bounced. #Scenario 2: LONG if Close Above $188.3 1. Trend Analysis: - Trendline: Ensure the price is breaking out above a key trendline resistance at $188.3. 2. Price Action: - Bullish Signals: Look for bullish candlestick patterns (e.g., bullish engulfing, hammer) indicating upward momentum. 3. Support and Resistance Levels: - Resistance Level: $188.3 (confirm breakout). - Support Level: Identify a recent support level to place your stop-loss. LONG Trade Plan: - Entry Point: Close above $188.3 - Stop-Loss (SL): Below $188.3 or recent support level. - Target Profit (TP): Set a level above $188.3 where the price has previously encountered resistance. Summary: - SELL at $180: - Trend: Bearish (confirm with trendline). - Entry: Bearish signals at $180. - Stop-Loss (SL): Above resistance. - Target Profit (TP): Below $180. - LONG if Close Above $188.3: - Trend: Bullish breakout. - Entry: Bullish signals with close above $188.3. - Stop-Loss (SL): Below $188.3. - Target Profit (TP): Above $188.3. This plan provides a clear approach for trading Solana based on the specified price levels, using trend analysis, price action, and key support/resistance levels for making informed trading decisions.
adriyan_junior
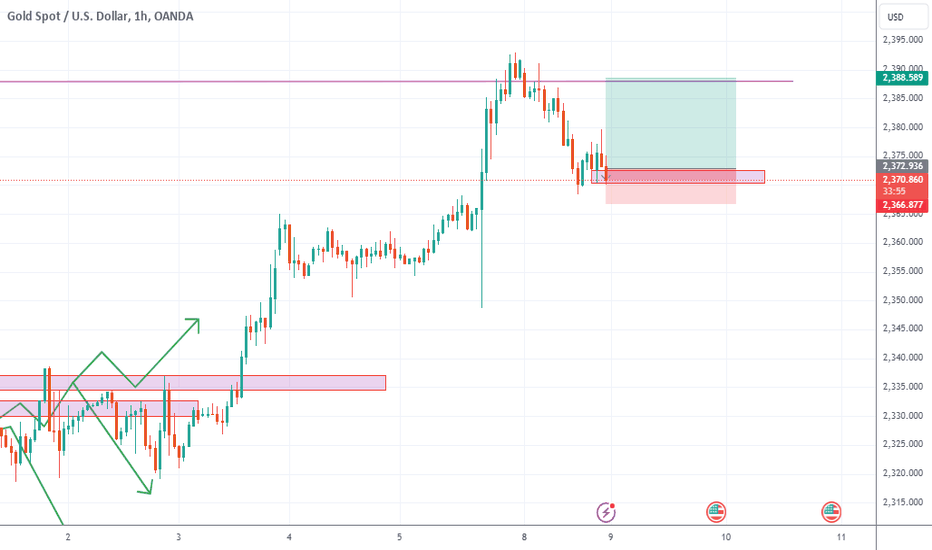
Gold Potential BUY/Long Analysis Trend Analysis: The current trend for gold is bullish, observed from the consistent higher highs and higher lows on the daily chart. Price Action: Recent price action shows bullish candlestick patterns near key support levels, indicating strong buying interest. Support and Resistance: - Support Level: 2367 (set as Stop-Loss) - Resistance Level: 2387.3 (set as Target Profit) Summary - Current Trend:Bullish - Entry Point: Near current market price, given bullish trend and price action. - Stop-Loss (SL): 2367 - Target Profit (TP): 2387.3 Given the strong upward trend and supportive price action near 2367, this provides a good potential for a BUY/long position with the SL at 2367 and TP at 2387.3.
adriyan_junior
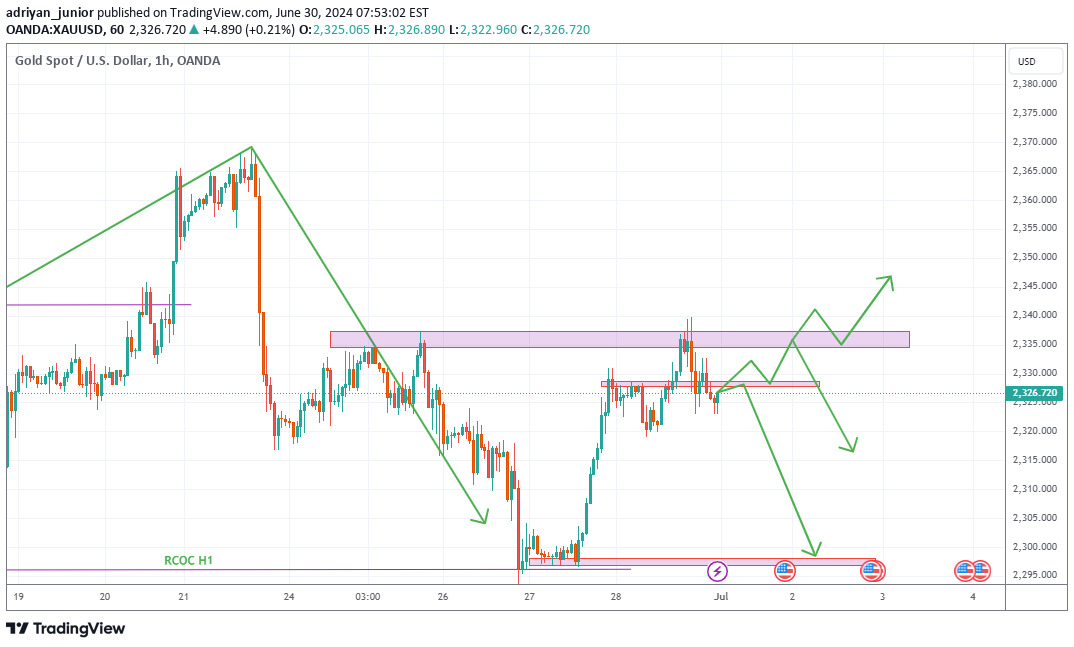
Here are three potential scenarios for Gold movement next week based on price action and trend analysis: Scenario 1: Price Closes Above 2328.765 Potential Movement: - The price could rise towards the area of 2334.556 - 2337.281. Entry Point: - Buy if the price closes above 2328.765. Take Profit (TP): - TP1: 2334.556 - TP2: 2337.281 Stop Loss (SL): - SL: 2322.765 (6 points below the entry to account for potential retracement). Scenario 2: Price Fails to Close Above 2328.765 Potential Movement: - The price could continue to decline towards the area of 2298 - 2297. Entry Point: - Sell if the price fails to close above 2328.765. Take Profit (TP): - TP1: 2298 - TP2: 2297 Stop Loss (SL): - SL: 2334.765 (6 points above the potential reversal point). Scenario 3: Price Closes at 2337.281 Potential Movement: - The price could rise towards 2363.625. Entry Point: - Buy if the price closes at 2337.281. Take Profit (TP): - TP: 2363.625 Stop Loss (SL): - SL: 2331.281 (6 points below the entry to account for potential retracement). Ensure to monitor the market movements in real-time and adjust the strategy according to the changing market conditions. This analysis is based on current price action and trend, but the market can change and should be adapted accordingly.
Disclaimer
Any content and materials included in Sahmeto's website and official communication channels are a compilation of personal opinions and analyses and are not binding. They do not constitute any recommendation for buying, selling, entering or exiting the stock market and cryptocurrency market. Also, all news and analyses included in the website and channels are merely republished information from official and unofficial domestic and foreign sources, and it is obvious that users of the said content are responsible for following up and ensuring the authenticity and accuracy of the materials. Therefore, while disclaiming responsibility, it is declared that the responsibility for any decision-making, action, and potential profit and loss in the capital market and cryptocurrency market lies with the trader.