
aaqureshi01
@t_aaqureshi01

What symbols does the trader recommend buying?
Purchase History
پیام های تریدر
Filter
aaqureshi01
تحلیل طلایی بیت کوین (BTC/USDT): فرصت خرید کمریسک با ۳ هدف سود در تایم فریم ۴ ساعته
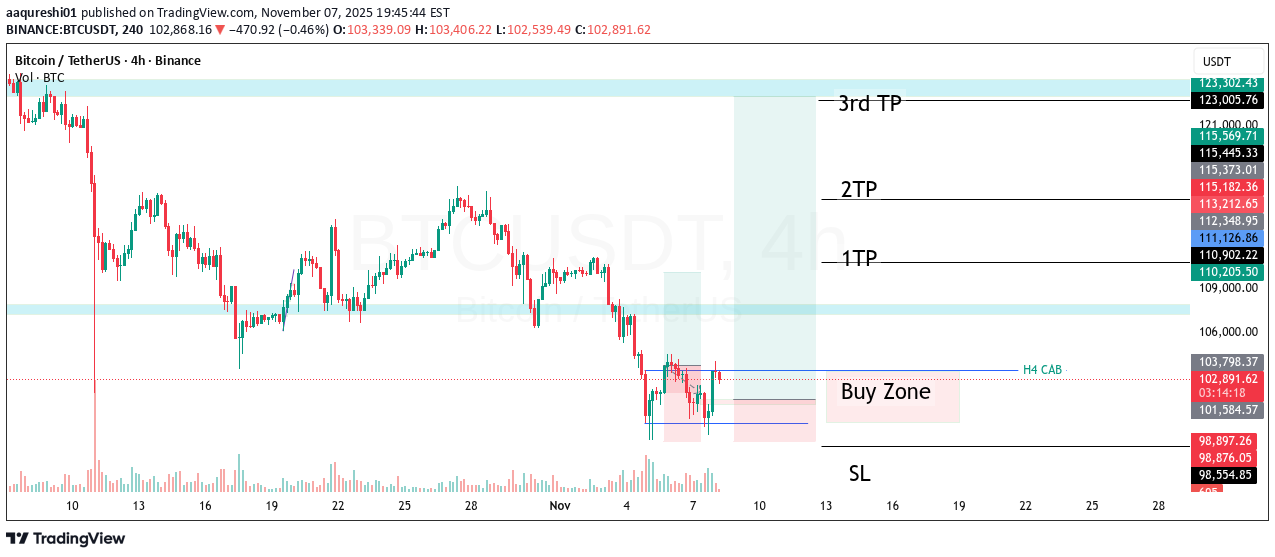
📌 BTC/USDT (4H) This chart shows a clean bullish setup on the 4-hour timeframe, with a clearly marked Buy Zone, Stop Loss, and three Take-Profit (TP) levels. The analysis highlights a potential reversal after a downtrend. ✅ 1. Market Structure Overview The market has been in a downtrend for several days, but recent candles show that price is giving a strong reaction from a major support zone. A H4 CAB (Change of Character + Aggressive Buyers) is visible on the chart, indicating that sellers are weakening and buyers are stepping in. This shift signals a possible trend reversal or short-term bullish push. ✅ 2. Buy Zone Explanation The chart highlights a Buy Zone, which is the area where: Strong buyers previously stepped in Liquidity was collected A bullish move started earlier Price has returned to this zone again, offering a low-risk buy opportunity. Entering inside this Buy Zone gives a trader: ✅ Better Entry ✅ Smaller Stop Loss ✅ Higher Risk-to-Reward Ratio ✅ 3. Stop Loss (SL) The Stop Loss is placed below the Buy Zone, under the previous structural low. This placement is logical because: If the market is truly bullish → SL will not be hit If price makes a new lower low → the trade is invalid and exits immediately This reflects proper risk management. ✅ 4. Take-Profit Targets (TP Levels) 🔹 1st TP — (110,205 / 111,126) This is the nearest resistance zone where price may give an early reaction. A good place for partial profits. 🔹 2nd TP — (113,212 / 115,373) A mid-level liquidity zone. If bullish momentum continues, price can move here smoothly. 🔹 3rd TP — (123,005 / 123,302) The major upper resistance zone and a previous supply area. Strong profit-taking is expected here. Suitable for swing traders aiming for a bigger move. ✅ 5. Trade Logic Summary This setup follows a textbook bullish pattern: Support zone tapped Liquidity swept H4 Change of Character (CAB) Market structure shift Price returns to Buy Zone for a clean re-entry TP levels aligned with previous liquidity zones The risk-to-reward ratio is strong and structurally sound. ✅ 6. Overall Sentiment According to the chart: 🔹 Bias: Bullish 🔹 Reason: Market structure shift + CAB + support reaction 🔹 Entry: Buy Zone retest 🔹 Targets: TP1 → TP2 → TP3 If the Buy Zone holds, this becomes a high-probability setup. Disclaimer: This analysis is shared strictly for educational and informational purposes only. It is not financial advice, not a signal to buy or sell, and should not be considered investment guidance. Trading in crypto, forex, or any financial market involves risk, and you are responsible for your own trading decisions. Always do your own research and use proper risk management.
aaqureshi01
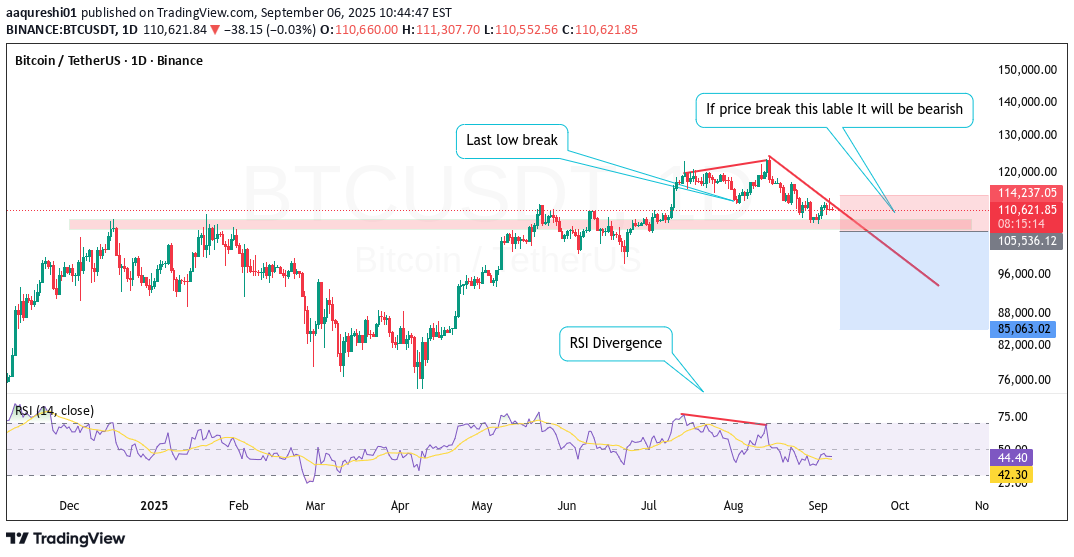
Bitcoin (BTC) Price Analysis: Bearish Outlook Based on the daily chart for BTC/USDT, a bearish sentiment is building. The analysis is supported by a classic RSI (Relative Strength Index) divergence, a strong signal that the current uptrend is losing its momentum. An RSI divergence happens when the price makes a higher high, but the RSI indicator fails to do the same, creating a lower high. This indicates that the buying pressure is weakening, and a price reversal is likely to occur. Additionally, the chart shows that if the price breaks below the last key low, it would confirm a shift in the market trend from bullish to bearish. This breakdown could lead to a significant price decline. Based on this analysis, here are the potential trade levels: Entry Price: Look for a short entry if the price breaks and closes below the support level of $105,536. Stop Loss (SL): To manage risk, place the stop loss just above the recent swing high at $114,237. This will protect your position if the price unexpectedly reverses and continues its upward trend. Take Profit (TP): The first target for profit taking is the next major support level at $85,063. This level represents a key point of previous support where the price could find a floor. Disclaimer: This is a trading idea based on technical analysis and is not financial advice. Trading cryptocurrencies carries a high risk of loss, and you should always do your own research before making any trading decisions.
aaqureshi01
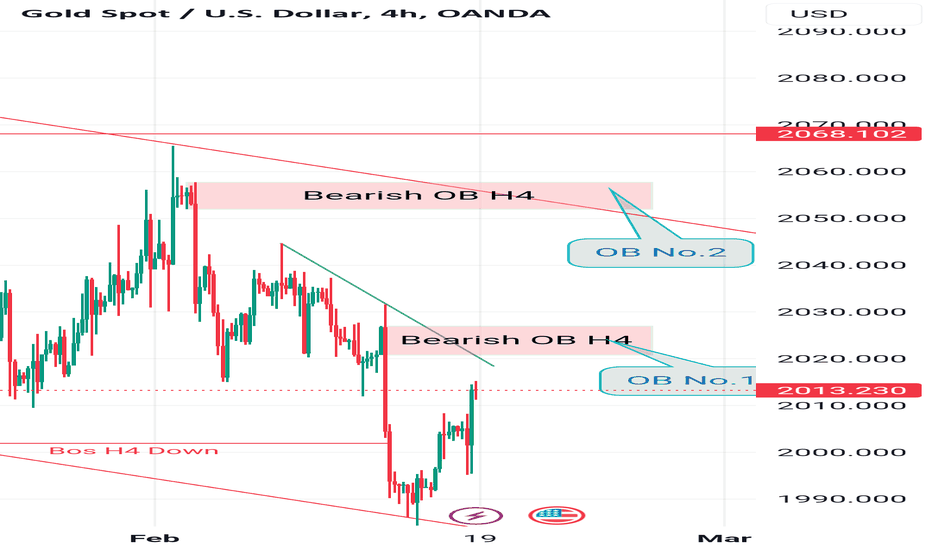
In the SMC Trading setup for gold, where the market is displaying a bearish trend with lower lows and lower highs, identifying key order blocks becomes crucial. These order blocks serve as potential areas of interest for traders looking to enter or exit positions. By marking these order blocks, traders can anticipate potential reversal or continuation zones within the bearish context. This strategic approach allows traders to make informed decisions based on price action and market structure, enhancing their chances of successful trading in the bearish gold market.
Disclaimer
Any content and materials included in Sahmeto's website and official communication channels are a compilation of personal opinions and analyses and are not binding. They do not constitute any recommendation for buying, selling, entering or exiting the stock market and cryptocurrency market. Also, all news and analyses included in the website and channels are merely republished information from official and unofficial domestic and foreign sources, and it is obvious that users of the said content are responsible for following up and ensuring the authenticity and accuracy of the materials. Therefore, while disclaiming responsibility, it is declared that the responsibility for any decision-making, action, and potential profit and loss in the capital market and cryptocurrency market lies with the trader.