
ZorgOros
@t_ZorgOros

What symbols does the trader recommend buying?
Purchase History
پیام های تریدر
Filter
Signal Type
ZorgOros
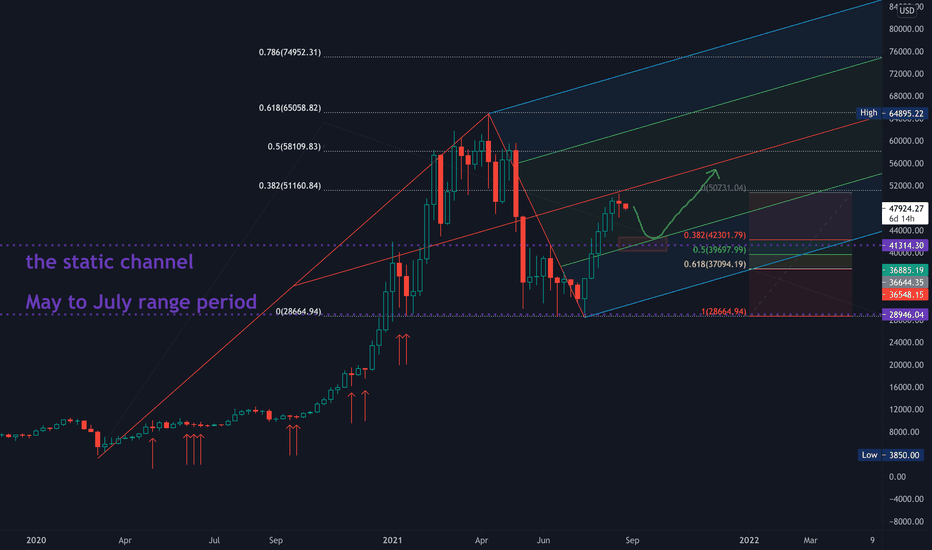
this would be a little long idea, I'm sincerely asking you to read until the end with all the comments to understand my idea completely. I'm gonna analyze the bitcoin chart from weekly to hourly time frame and using some kind of different indicators to see as much reaction and knots as we can to find the proper behavior of price since the last dump. generally, I have 2 kinds of view for this idea: 1- bullish and. 2- correctional. I believe there is no falling or another dumping view for this chart anymore ( at least until there is no global financial crisis ). we start from weekly : as I see from the start of the bullish movement in march 2020 we reach the ATH of almost $65k which was the 0.68 point of FIBO extension, then we had a retrace to 0 points of it. As can be seen from the past chart. The price will not grow evenly, so we need retracements along the way. And given the location and collisions of the candlesticks with the specified levels, the price may be currently in a place that needs a retracement. From the beginning of the last uptrend on July 19, 2021, until now, we have started a perfect bullish movement, and now it is possible to retrace it by reaching the first target, which is the range of 0.38 Fibo and median fork. considered the target : Given that the static channel front range (indicate in purple) with a green line ( representing the 50% range of the fork) can indicate a good level for the target of the corrective movement.when we check the RSI in the WEEKLY rime frame we can also see that there is a resistance which price reacted to it and heading to the 50 % line. due to the behavior of the past, rsi MAY break 50% line and reach the support line beneath.DOMINANCE also is ranging in a static channel which we can imply that as long as dominance does not break the channel we could not expect a sharp and powerful movement behavior for the price.in the daily time frame we can see how perfect price reaches its targets from 0 to 1 point of Fibo extension. and also the loss of momentum is so obvious.in the daily time frame, RSI is also in a downtrend and it will be until It can break the bearish trend line, but we should consider that 50% level of RSI in daily time frame was respectful always so there is a possible reaction to that level. MACD is also in the bearish phase we had the cross already and the histogram growing under the zero line which indicates the sellers are getting more power. however it could react to the yellow trend line .in daily time frame is struggling with the midline of the static channel. we can see from the past there was a pump after any range so it could be the same scenario here which may cause the price to retrace. and the midline was a respectful level always.in 4-hour time frame, we have lots of information first, check how perfectly the candles react to the different levels of the FIBO. so as I mentioned before after reaching the target of 1 we could have a correction wave in which any of the fibo levels could be a knot for price and a potential reversal level. there is a breakout and a perfect pull back from the bottom of the bullish channel which indicates momentum loss and reversal movement possibility.incase of reversal and correctional scenario we can indicate some levels for the target. the low pivots and 3 important levels of Fibo retracement. On the way down our targets have a different value for me to consider them as the price holder or reversal points. for example, the purple dotted line which is the upper band of the range area ( static channel from May to July ) I believe is important but as we see it has not enough value to hold the price, so in case of reaching there is a possible and probable breakout and reaching to 50 % of Fibo , and the most powerful level is the 68% level of fibo . On the other hand, I believe there could be also a range area here which I indicate with green box .4H RSI and MACD is also bearish supports and resistance levels are shown every thingthere are more bearish signs than bullish for me : bitcoin in the long term is powerfully bullish so if you want to invest in these temporary corrections shouldn't mind you. if you are a trader you could find good points for opening short positions I believe. and at the end, I'm not a financial adviser and I just try to explain what I see in the chart and analyze the behavior of the movement and the price. be happy and DYORwatch this level carefully its importantthe second scenario ( orange ) happened I have some thought that may we have a couple of days or weeks range in the blue area even it could extend to the lower area, but the range is probable, until macD or RSI show us some sign of break out from range area. its just an idea and could be false or fail so DYORdamn this analysis was totally correct , :)DONE
ZorgOros
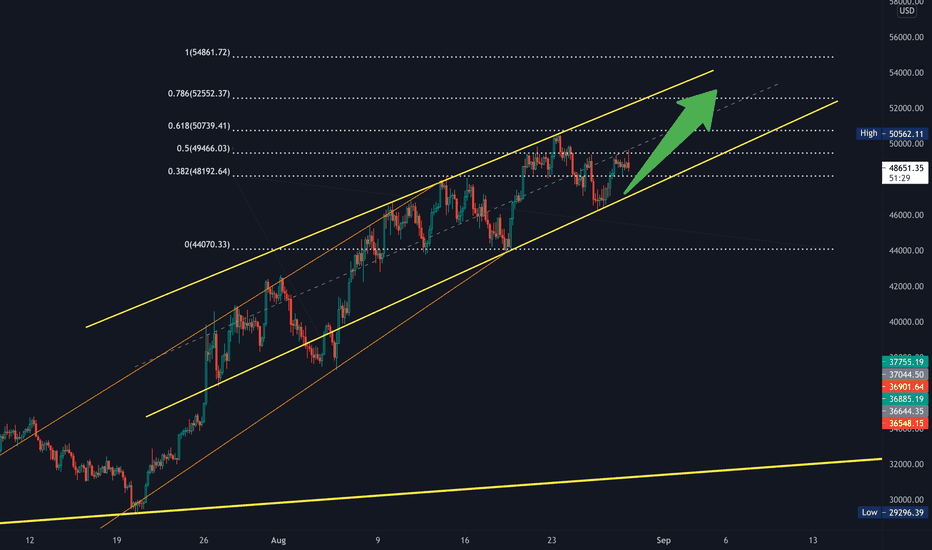
hello everybody after a small break out from the bottom of the channel, I decided to make some changes to my chart. so I drew a new channel which shows us we had a small change in our momentum, and the new fibo extension indicates new support and resistance level. I expect the price goes to the further targets up to the top of channel, surely we will have some fluctuations in the way, if nothing special won't happen during the week this is my idea. DYORdue to complicated markets situations I tried to check the chart from different angles in the different time frame which gave me lots of different ideas about the price movement I will make a new idea from scratch and pul all updates on it . and will attach that idea below here
ZorgOros
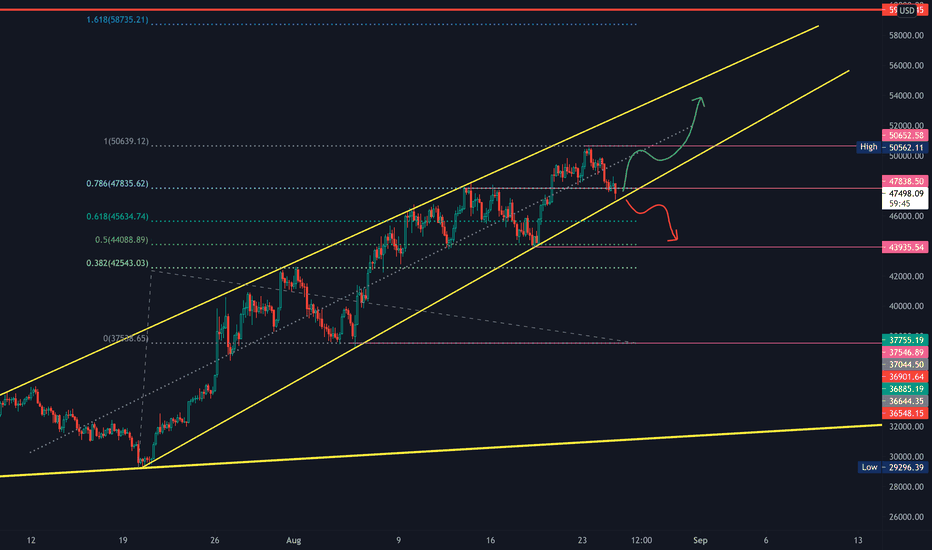
hi guys. after the first pump from 29K, the extension fibo got us proper and fine targets till now , we just reach the target and because the distance of the next target from here is a little high I believe we need a proper correction OR a huge amount of money and investing from whales or big institutions, by the way from 29k till here we have about 70 % growth so if the correction scenario happens it would take 38 to 50 percent of it back or less. so I hope you all saved some profit and watch the chart carefully. if the yellow channel (a wedge shape ) will break we have our targets in pink line which any of them could be the reversal potential area. the extension fibo also can help us to find good levels of knots. this idea will attach in the comment section of previous ideajust updated
ZorgOros
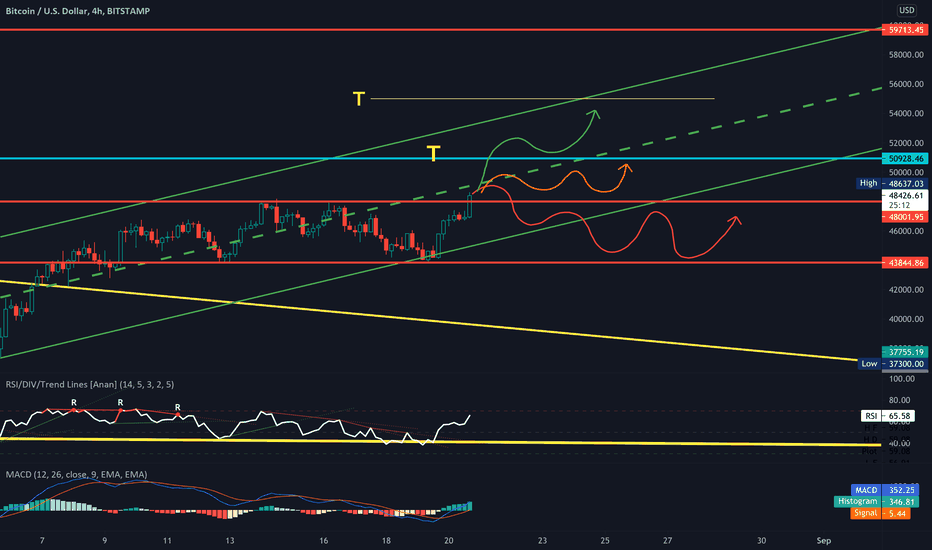
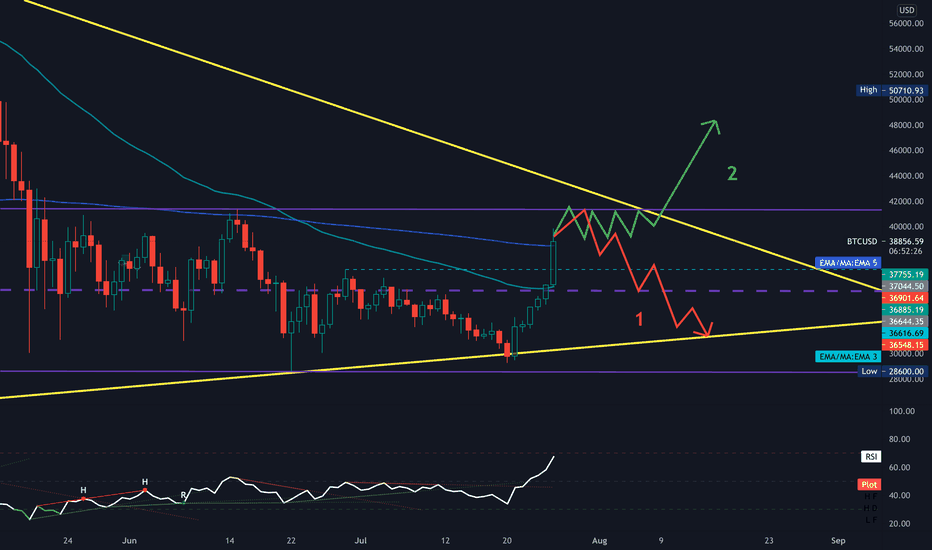
as mentioned in my previous ideas the green upward channel is still valid, I see 2 tension point that are targets for bitcoin which I mentioned them in the chart with ( T ). in my opinion, there is 3 scenario : green: due to the market news and situations in the overall financial market, I believe other markets need a retracement and lately cryptocurrency has had enough news to get attention, also the adaptivity of crypto is increasing day by day, so I believe if any dump or retrace will happen for other markets the smart money will fall into crypto and the green arrow will move into green channel even there is the possibility to break it above. orange: there is a possibility for the price to range between blue and red line this would happen if in close future any fud news will make for BTC and makes doubts in the people mind. RED: this would be the worst scenario which would happen a range market between two red lines and altcoin will suffer if this scenario happens. I don't see any bearish movement, there would be a little retracement for accumulating but no dump for the future, for now, 40 is the basement for BTC.The idea below is a probability which considers the previous behavior id price in this channel.hi guys. after the first pump from 29K, the extension fibo got us proper and fine targets till now , we just reach the target and because the distance of the next target from here is a little high I believe we need a proper correction OR a huge amount of money and investing from whales or big institutions, by the way from 29k till here we have about 70 % growth so if the correction scenario happens it would take 38 to 50 percent of it back or less. so I hope you all saved some profit and watch the chart carefully. if the yellow channel (a wedge shape ) will break we have our targets in pink line which any of them could be the reversal potential area. the extension fibo also can help us to find good levels of knots.
ZorgOros
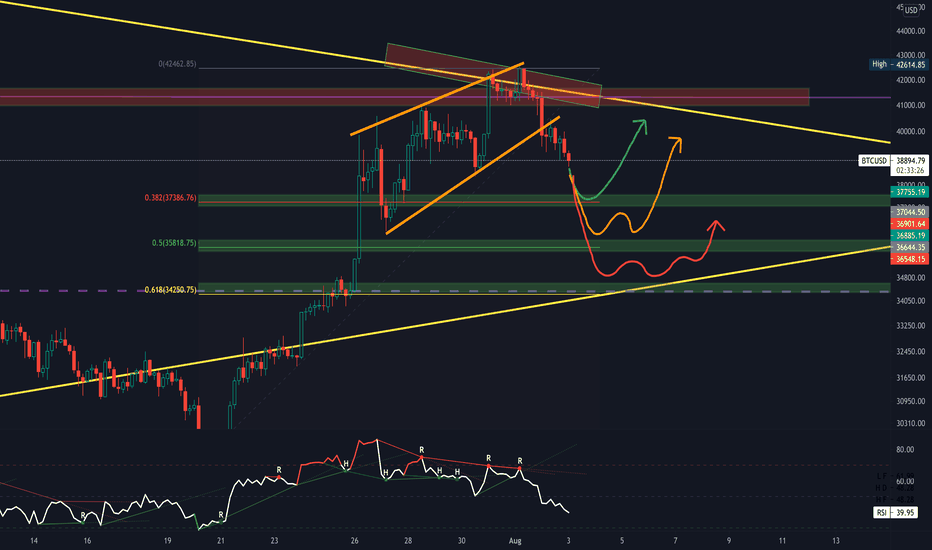
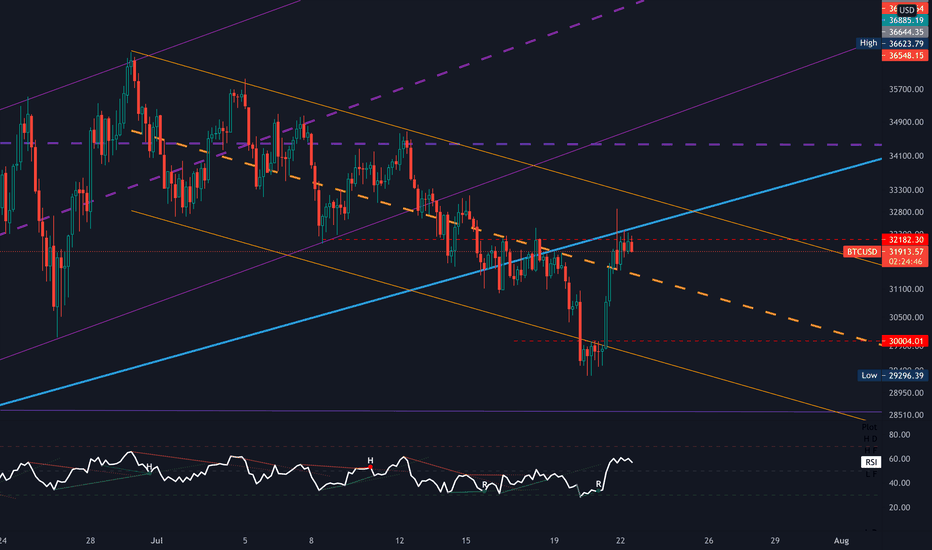
this is a new idea, my previous idea about BTC will be attached as the first update below. as I predicted before in the 1H time frame we had a obvious rising wedge which fulfilled and candles broke from the bottom and fall, now I'm seeing 4 possible scenarios which I mentioned in color in the chart . the green and most probable scenario we have 38% fibo retracement AND POC line ( red dotted line ) from volume profile, which making a good and reliable support area for us . (considering RSI which is 40% right now , i thing when RSI reach over sold area price reach the 38% fibo and could be the cause for reverse ) then we have the orange one that area related to 50% fibo and the red one is for fibo 68% and the midline of static horizontal channel ( purple channel ). in the daily time frame, we have 59% RSI which I have to say RSI 50% is really strong support and I believe rsi could not break it, ( probable ) it's all my ideas and not a piece of financial advice. THE FIRST CHART BELOW IS MY PREVIOUS IDEA ABOUT BTC .👆🏻👆🏻👆🏻👆🏻👆🏻👆🏻👆🏻👆🏻👆🏻👆🏻 the idea above is my old idea about BTC and from below I will update BTC 👇🏻👇🏻👇🏻👇🏻👇🏻👇🏻👇🏻👇🏻I believe if we couldn't break the static channel so we have to range in it, and we will range in the upper half of the channel for this week and the next. RSI should get support at 50 and bounce upthese days fluctuations are not predictable so all the analysis for every crypto is not valid more than 2 dayswe are in a PRZ zone, this area is important if the price will reject again from this resistance it could cause the price to fall to the midline and even bottom of the static channel ( purple ).retracements good for the price retracing after any sharp or continuous upward movement makes the situation stable and makes more opportunities for more growth. as I see the green or yellow scenario is the most probable scenario to happen, each of them is good enough for BTC and ALTS there a red scenario that would happen if the world financial market reacts negatively to the lockdown news or FUDs.the bullish channel is still valid until the price breaks the bottom of the channelstill continue , a new idea will continue the trend
ZorgOros
in my point of view, this scenario could happen IF bitcoin start a correction in the daily time frame:)
ZorgOros
hash ribbon talks . on daily time frame we got some moves and signals , which could lead us for a bull-run . as i see this is a optimistic probability and due to the situation of the over all markets might be failed . but we have to say what we see in our perspectivei think even if we break the upper band of the rectangle ( static channel ) we cannot break the triangle it's just an ideabulls are trying to pass the resistance, but it still has the powerdaily RSI is on overbought area , surely for continue we need an retracement to gain more power , midline of static channel is a really good and reasonable level for it,definitely, we will break all the resistances, the important point is when, as I see we don't have enough power for breaking these two powerful areas, so we need a correction. RSI is in over bought area and needs to correct itself.damn this unpredictable BTC always surprises every body breaking and retestingstill trying to hold itself at the area, the good thing is that we are just on support right now. the bad thing is to need lot of money flow for rising and breaking the resistances. so far its surely possible for breaking like this but it will be better if we have a retracement pulse4h time frame some thing new shaped , a rising wedge , due to having this pattern the retracement scenario is still valid , Actually the retracement scenario will fail if price break the yellow dynamic down trend . Retracement targets are the previous targets that i mentionedNext update will be in another idea , i will put it under here , the last picture will be next idea , follow from therethe idea below is the idea i will continue BTC in it
ZorgOros
ok after some kinda pumping time, we have a good and strong resistance ahead which is the upper band of the same rectangle we are stuck in from MAY 19. we also have to consider some. other information such as RSI which will be in the overbought area at the time price reaches the upper band. 1st scenario: I think we will bounce down, but it's just an idea there are lots of possibilities, 2nd scenario: if the price could hold itself there and accumulate for 1 or 2 weeks, we could expect the break out of the upper band and continue the bull-run. surely there are other possibilities, but I will wait and see what will happen tonight, and tomorrow we can decide what should we do . I will update this IDEA and I will put the 2 of my ideas here which I made before . 1- 2-in the daily time frame, we broke the EMA 50. now we can consider it as a support.4H time frame : A-we have two EMA 50 and 200, midline static channel, and the power full zone between Fibo 0.5 and 0.68 which indicates a great support PRZ zone there B- I have 3 scenarios here : 1: prz zone or the blue support line will support price and we rise again 2: price won't go up nor down and will accumulate in the midline for a while 3: price will break the prz zone and reach the lower band of our static channelwe are on a strong support level right now , there is possibility for price to rise again. but we should pay attention to the world economic news , cause they define the money flow between markets. last night we saw GOLD and DXY correlation went positive and its surely affect the whole market .if the RSi fall below 50% i think the uptrend move will diewe are finish here i will continue updating BTC in separate idea
ZorgOros
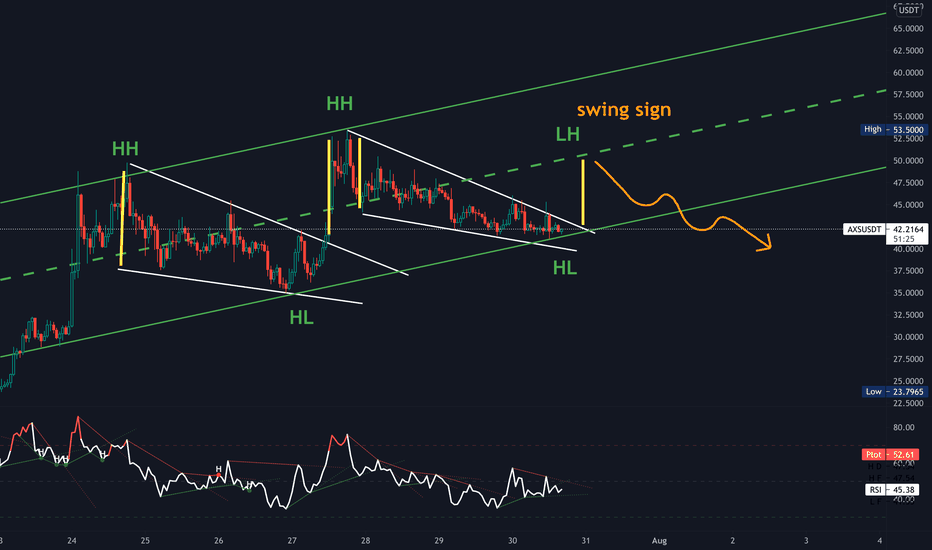
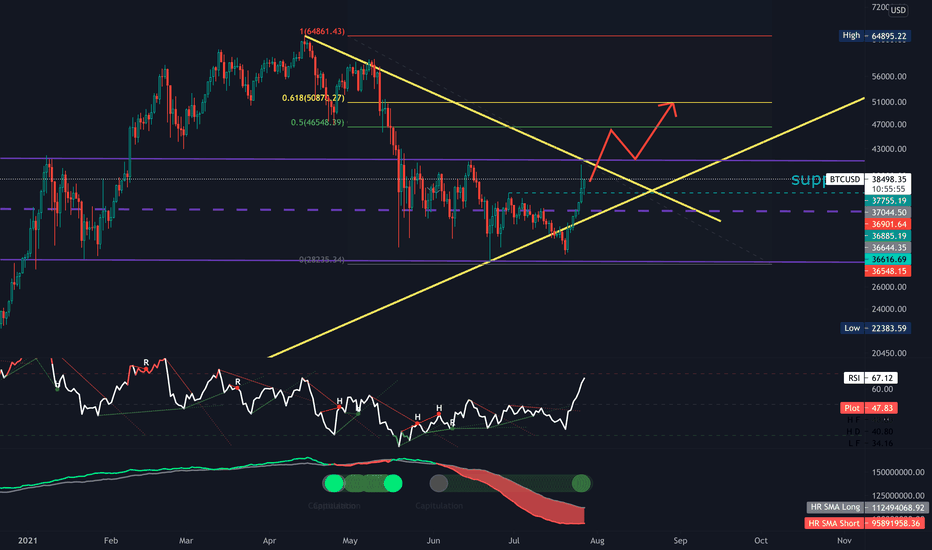
as long as we are in this bearish channel, we are in a bearish/sideways trend, for me first bullish sign is to break and retest this channel.1st target: top of the bearish channel 2nd target: purple static channel midline 3rd target: top of the purple static channel in my opinion, we are still sideways, all these days was just a minor motion in the market. it's just my ideaFibo 0.5 and 0.68 are 2 important areas that could indicate the supply and demand zone, passing 0.5 and breaking 0.68 for me is a short-term bullish sign, and otherwise reacting to 0.5 and failed to break out would be a short-term bearish sign for me. Daily time frameding ding ding , as I expected, the price broke up, now it depends on on-demand power, there could be a pullback to the bearish channel to confirm the break . let's see what will happen there is 3 possible scenario for me15m time frame , hidden divergencehell yeah, will we reach the next target or no? from rsi perspective in a daily time frame, we have enough power to go there but in lower time frames we need to rest for a couple of candles to gain power .
ZorgOros
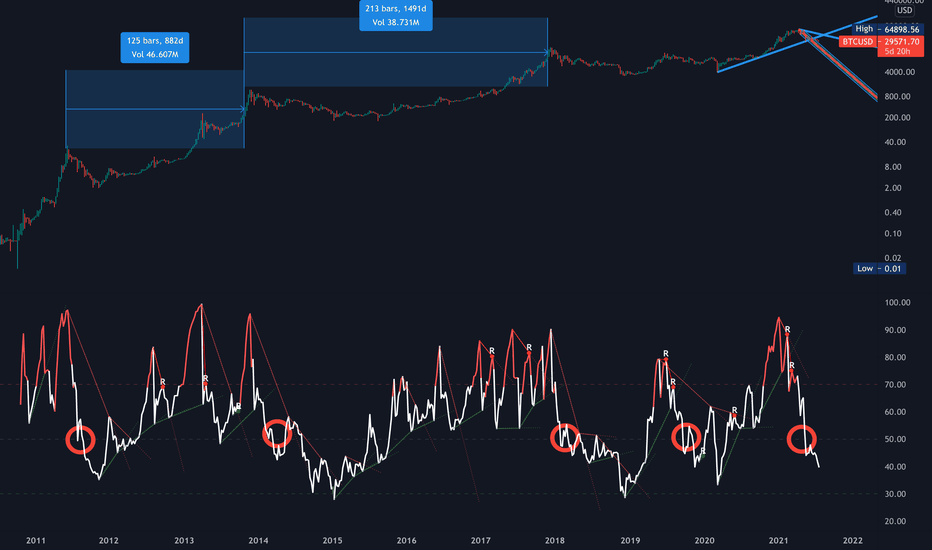
every time the RSI breaks 50% to down, it reaches the bottom of the channel ( about 30 to 34 ). as I see it will reach the 30-34 then it can pump.let me say AT LEAST 30-34 it may go further even reach over sold area , which I want it go there so much
Disclaimer
Any content and materials included in Sahmeto's website and official communication channels are a compilation of personal opinions and analyses and are not binding. They do not constitute any recommendation for buying, selling, entering or exiting the stock market and cryptocurrency market. Also, all news and analyses included in the website and channels are merely republished information from official and unofficial domestic and foreign sources, and it is obvious that users of the said content are responsible for following up and ensuring the authenticity and accuracy of the materials. Therefore, while disclaiming responsibility, it is declared that the responsibility for any decision-making, action, and potential profit and loss in the capital market and cryptocurrency market lies with the trader.