
Zoom_Out_Analysis
@t_Zoom_Out_Analysis

What symbols does the trader recommend buying?
Purchase History
پیام های تریدر
Filter
also looks a bit like inverted head and shoulders
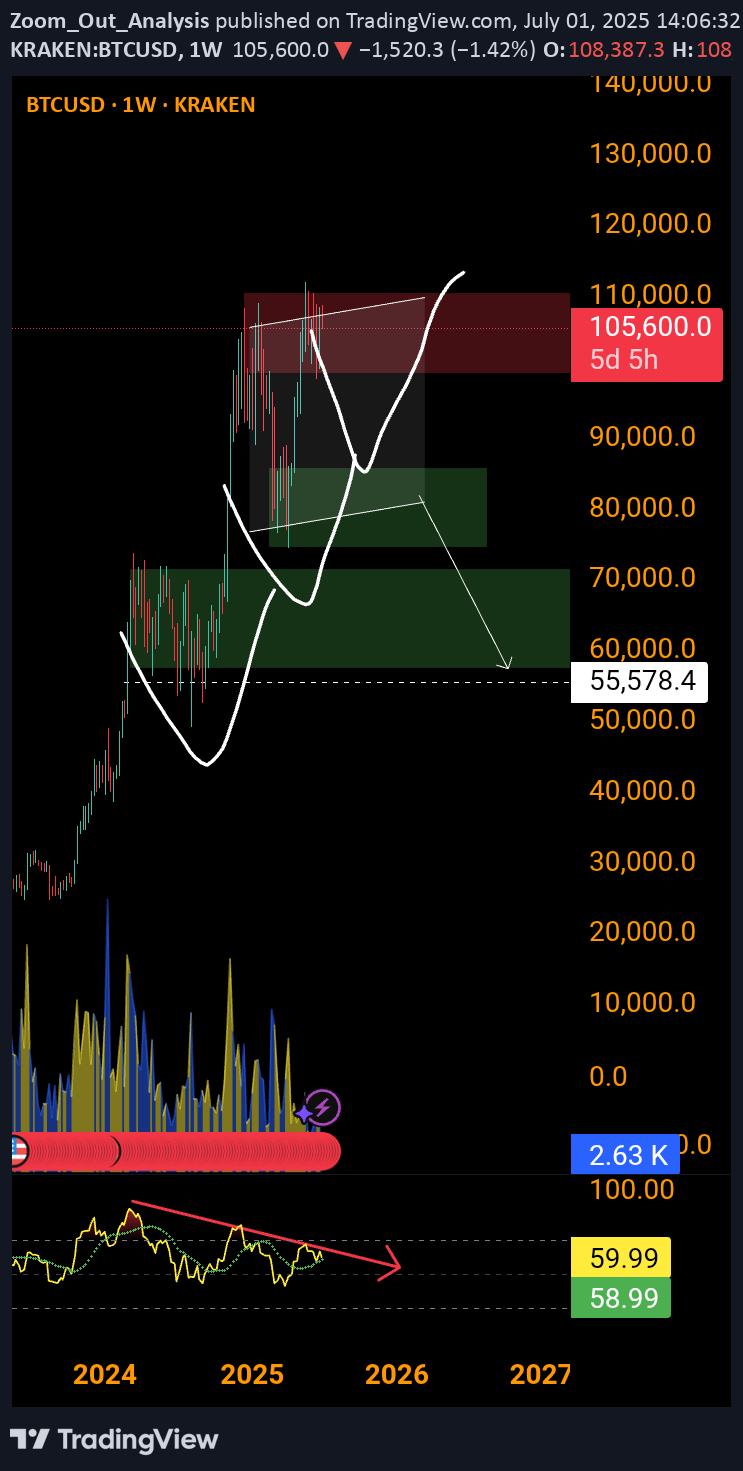
bitcoin wouldnt be bitcoin , if from time to time a more or less head and shoulders pattern comes along. in this case it looks a bit like the right inverted shoulder is being made. but the bearish div is also present. it might be possible , a sharp move up to new highs around 135 k , followed by a drop below 100k .
bearish divergence on the weekly , pullback seems to be coming
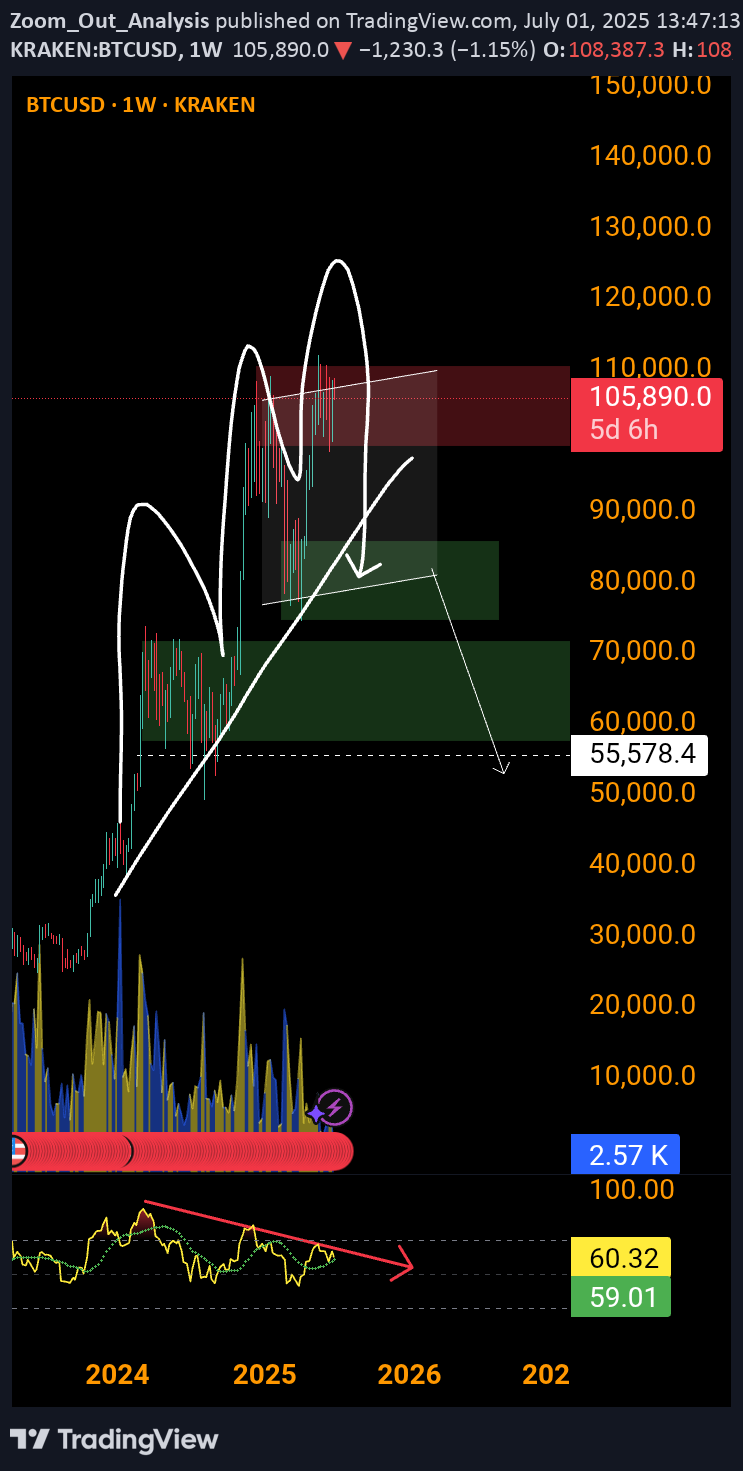
after a bullish run up , it looks like it is about time to cool down a bit . retrace to below 100k , and test support . bearish diversion is clearly showing on the bigger timeframes and can play out very soon.
MicroStrategy , just take a look .. :)
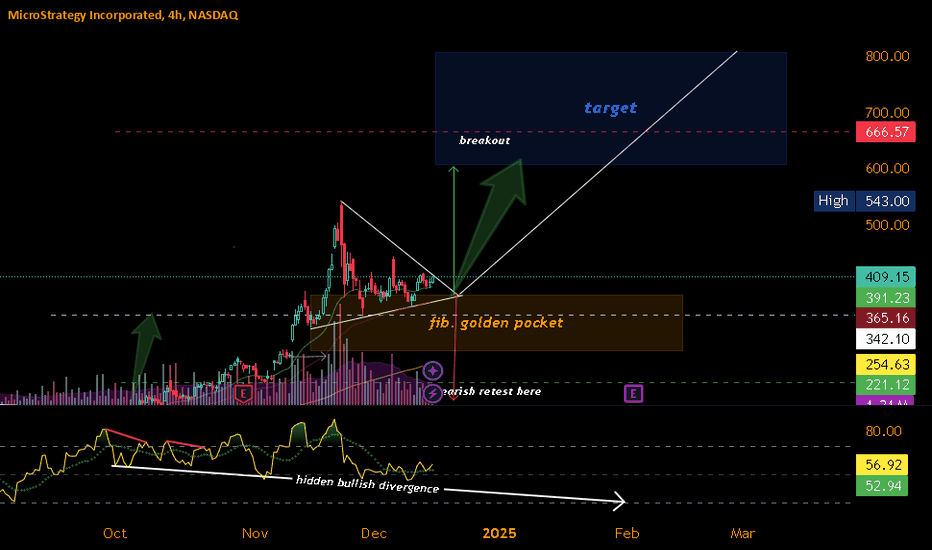
i normally do only crypto, but i want to see if my charting style also works for stocks. After a bullish +380% outbreak back in september, MSTR has made a bullish symmetrical triangle, the apex (point where support and resistance come together) is almost reached, if the uptrend breaks, the price might drop to around 220 - 230 dollar area. if price breaks out bullish , price could reach 600 - 800 dollar between january and februari 2025 hidden bullish diversion in the RSI on bigger timeframe, bullish breakout coming ? this chart is intended as training and NOT as financial advice
Brand new : MOVE is on the move
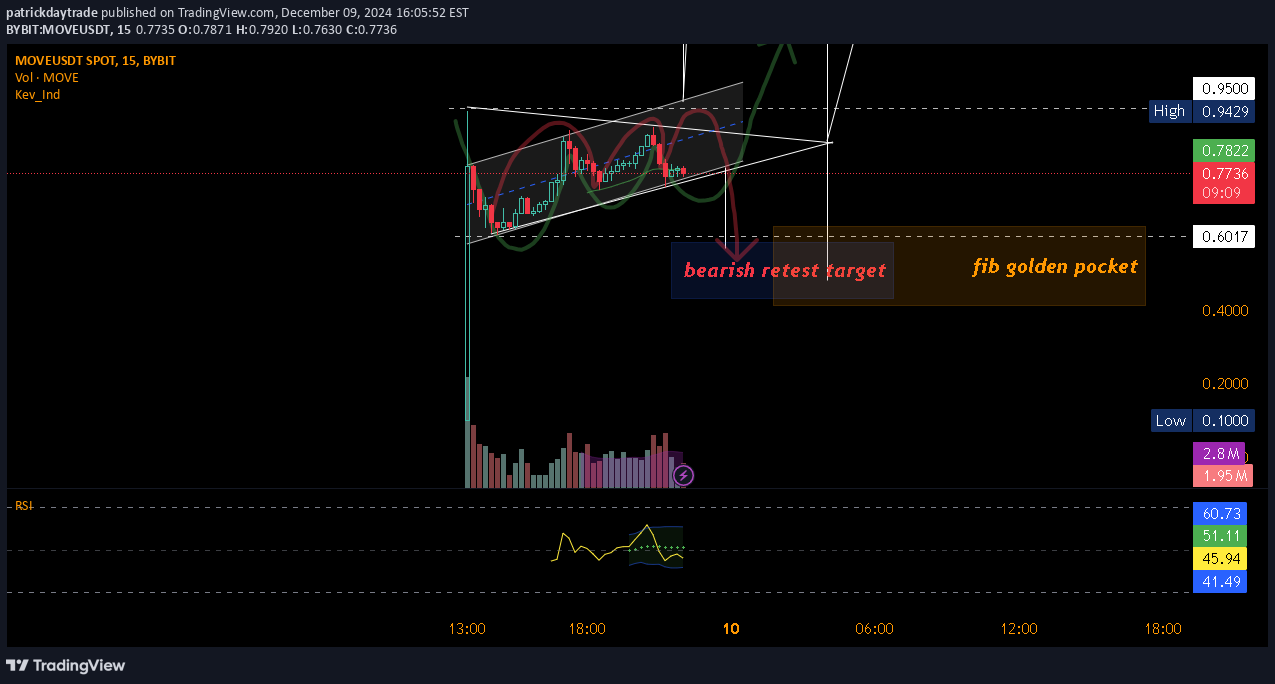
I dont know this coin because it is brand new ,it is just listed there is not that much to chart yet, but the chart so far seems clear , bullish of bearish, you always need te be prepared for both scenario's . please dont just do something because you saw or heard someone saying or drawing something. do your own research . my chart is not intended as financial advice enjoy your holidays , be safe , and dont invest any money you cannot afford to lose !
Siacoin : One simple clean chart can show more than 1000 words..

While we are bouncing between support and resistance, sia is looking strong on the bigger time frames. Supp. and res. lines are getting closer towards each other,in a symmetrical triangle. price is also making a sort of inverted head and shoulders pattern between those support and resistance lines. For now it looks like, everytime the rsi crossed 70 , we get a quick and strong price movement. If we break , and retest the 0.02 resistance area as our new support, the higher pricetargets , around 0.30 cents are coming into play. correct me if i'm wrong , but if bitcoin stays bullish , this is what we are looking at on the monthly chart.. i also overlayed the 2016 - 2021 bars pattern , to show what sia's price did in the past. After that, i stretched the blue bars pattern out just a little , to account for the exponantional growth of the whole crypto industry. off course there also should be a fib , and some moving averages, but i wanted to keep the chart as clean as possible, to show the expected price action most clearly. as always , -always use a stoploss -never trade without charting first -never invest any money you cannot afford to lose ! -my charts are not financial or investment advise -my warnings are.
Vechain is bullish breaking out of its daily timeframe pattern

Vechain is breaking out of it's descending triangle. we must expect resistance in the zone between 0.034 and 0.037 , if we break through, and bullish retest, the price target will be around the 0.045 region. remember : trade safe and always use a stoploss never ever invest money you cannot afford to lose MY CHARTS ARE NOT FINANCIAL ADVISE, FOR INSPIRATIONAL USE ONLY i just visualise what i see in the charts
Disclaimer
Any content and materials included in Sahmeto's website and official communication channels are a compilation of personal opinions and analyses and are not binding. They do not constitute any recommendation for buying, selling, entering or exiting the stock market and cryptocurrency market. Also, all news and analyses included in the website and channels are merely republished information from official and unofficial domestic and foreign sources, and it is obvious that users of the said content are responsible for following up and ensuring the authenticity and accuracy of the materials. Therefore, while disclaiming responsibility, it is declared that the responsibility for any decision-making, action, and potential profit and loss in the capital market and cryptocurrency market lies with the trader.