
Zeiierman
@t_Zeiierman

What symbols does the trader recommend buying?
Purchase History
پیام های تریدر
Filter
Liquidity ≠ Volume: The Truth Most Traders Never Learn
█ Liquidity ≠ Volume: The Truth Most Traders Never Learn Most traders obsess over volume bars, but volume is the footprint, not the path forward. If you’ve ever seen price explode with no volume or fail despite strong volume, you’ve witnessed liquidity in action. █ Here’s what you need to know ⚪ Volume Is Reactive — Liquidity Is Predictive Volume tells you what happened. Liquidity tells you what can happen. █ Scenario 1: Price Jumps on Low Volume ❝ A price can jump on low volume if no liquidity exists above.❞ ⚪ What’s happening? The order book is thin above the current price (i.e., few or no sellers). Even a small market buy order clears out available asks and pushes price up multiple levels. Volume is low, but the impact is high because there’s no resistance. ⚪ Implication: This is called a liquidity vacuum. It can happen before news, during rebalancing, before session openings, on illiquid instruments, or during off-hours. Traders often overestimate the strength of the move because they only see the candle, not the absence of offers behind it. █ Scenario 2: Move Fails on High Volume ❝ A move can fail on high volume if it runs into a wall of offers or bids.❞ ⚪ What’s happening? There’s a strong surge of aggressive buying or selling (high volume). But the order book has deep liquidity at that level — large resting limit orders. The aggressive traders can’t chew through the liquidity wall, and price stalls or reverses. ⚪ Implication: This is called liquidity absorption. Market makers or institutions may intentionally absorb flow to stop a breakout. Many retail traders mistake this for “fakeouts,” but it’s really liquidity defending a level. ⚪ What the Research Says Cont, Stoikov, Talreja (2014): Price responds more to order book imbalance than trade volume. Bouchaud et al. (2009): Liquidity gaps, not trade size, are what truly move markets. Hasbrouck (1991): Trades only impact price if they consume liquidity. Institutions don’t chase candles — they model depth, imbalance, and liquidity resilience. ⚪ Where the Alpha Lives Liquidity tells you where the market is weak, strong, or vulnerable — before price moves. Fakeouts happen in thin books. Reversals occur at hidden walls of liquidity. Breakouts sustain when liquidity follows the price, not pulls away. If you understand this, you can: Enter before volume shows up Avoid chasing dead breakouts Fade failed moves into empty space █ Final Truth Volume is the echo. Liquidity is the terrain. Alpha is in reading the terrain. You want to study the structure, because price moves toward weakness and away from strength. Learn to see where liquidity is, or where it’s missing, and you’ll see trading with new eyes. ----------------- Disclaimer The content provided in my scripts, indicators, ideas, algorithms, and systems is for educational and informational purposes only. It does not constitute financial advice, investment recommendations, or a solicitation to buy or sell any financial instruments. I will not accept liability for any loss or damage, including without limitation any loss of profit, which may arise directly or indirectly from the use of or reliance on such information. All investments involve risk, and the past performance of a security, industry, sector, market, financial product, trading strategy, backtest, or individual's trading does not guarantee future results or returns. Investors are fully responsible for any investment decisions they make. Such decisions should be based solely on an evaluation of their financial circumstances, investment objectives, risk tolerance, and liquidity needs.
Why the Best Strategies Don’t Last — A Quant Truth
Over the years, I’ve built strong connections with traders on the institutional side of the market. One of the most interesting individuals I met was a former trader at Lehman Brothers. After the collapse, he transitioned into an independent quant. I flew to Boston to meet him, and the conversations we had were eye-opening, the kind of insights retail traders rarely get exposed to. We didn’t talk about indicators or candlestick patterns. We talked about how fast and aggressive algorithmic trading really is. He told me something that stuck: " People think hedge funds build one algorithm, run it for years, and collect returns. That’s rarely the case. Most algos are extremely reactive. If something stops working, we don’t fix it — we delete it and move on. That’s how the process works." This isn’t an exception — it’s standard practice. What stood out most in our talks was how adaptable these algorithms are. If market conditions shift — even slightly — the logic adapts immediately. These systems aren’t built on beliefs or opinions. They’re built to respond to liquidity, volatility, and opportunity — nothing more. This level of responsiveness is something most retail traders never factor into their approach, but it’s core to how modern markets operate. █ How Quant Funds Use Disposable Strategies — And What Retail Can Learn One of the most misunderstood realities in modern trading is how top quantitative funds like Two Sigma, Citadel, and Renaissance Technologies deploy, monitor, and replace their strategies. Unlike traditional investors who develop a strategy and stick with it for years, many quant funds take a performance-first, outcome-driven approach. They: Build hundreds of strategies, Deploy only the ones that currently work, and Retire or deactivate them the moment performance drops below their internal thresholds. This is a deliberate, statistical, and unemotional process — and it's something that most retail traders have never been taught to think about. █ What This Means Quantitative firms often run: 100s of models simultaneously, Each targeting a specific edge (e.g. trend-following, mean reversion, intraday order flow), With tight risk controls and performance monitoring. When a model: Falls below a minimum Sharpe ratio (risk-adjusted return), Starts underperforming vs benchmark, Experiences a breakdown in statistical significance… …it is immediately deprecated (removed from deployment). No ego. No "fixing it." Just replace, rebuild, and redeploy. █ It runs live… until it doesn’t. If slippage increases → they pull it. If volatility regime changes → they pull it. If too many competitors discover it → they pull it. If spreads tighten or liquidity dries → they pull it. Then? They throw it away, rebuild something new — or revive an old one that fits current conditions again. █ Why They Do It ⚪ Markets change constantly What worked last month might not work this week — due to regime shifts, volatility changes, or macro catalysts. These firms accept impermanence as part of their process. ⚪ They don’t seek universal truths They look for temporary edges and exploit them until the opportunity is gone. ⚪ Risk is tightly controlled Algorithms are judged by hard data: drawdown, volatility, Sharpe ratio. The moment a strategy fails to meet these metrics, it’s shut off — just like any risk engine would do. ⚪ They don’t fix broken models — they replace them Time spent “tweaking” is time lost. New strategies are always in the pipeline, ready to rotate in when older ones fade. █ Research & Real-World Validation "Modern quantitative funds must prioritize real-time adaptability and accept that any statistical edge has a short shelf life under competitive market pressures." Adaptive Trading Agents” (Li, 2023) Donald MacKenzie’s fieldwork on HFT firms found that algos are treated like disposable tools, not long-term investments. Studies on adaptive algorithmic trading (e.g., Li, 2023; Bertsimas & Lo, 1998) show that funds constantly evaluate, kill, and recycle strategies based on short-term profitability and regime changes. A former Two Sigma quant publicly shared that they regularly deploy hundreds of small-scale models, and once one fails risk thresholds or decays in Sharpe ratio, it’s immediately deprecated. Walk-forward optimization — a method used in quant strategy design — is literally built on the principle of testing a strategy in live markets and discarding it if its forward performance drops. █ Why Retail Rarely Hears This Retail traders are often taught to: “Stick with a system” “Backtest 10 years” “Master one setup” But in the real quant world: There is no perfect system. There are only edges that work until they don’t. And the moment market structure shifts — new volatility, different volume profile, regime change — the strategy is gone, no questions asked. █ What This Means for Retail Traders ⚪ Don’t idolize “one perfect system.” What worked in April might not work in June. Treat your strategies as temporary contracts, not lifelong beliefs. ⚪ Build modular logic. Create systems you can tweak or retire quickly. Test new regimes. Think in frameworks, not fixed ideas. ⚪ Learn from regime shifts. Volatility, spread, volume profile, macro tone — track these like a quant desk would. ⚪ Use metrics like: - Win streak breakdown - Market regime tracker - Edge decay time (how long your setups last) █ Final Thought The best traders — institutional or retail — understand that there’s no such thing as a permanent edge. What matters is: Having a repeatable process to evaluate strategy performance, Being willing to shut off or rotate out what’s no longer working, And staying adaptable, data-driven, and unemotional. If you start treating your strategies like tools — not identities — you’ll begin operating like a professional. ----------------- Disclaimer The content provided in my scripts, indicators, ideas, algorithms, and systems is for educational and informational purposes only. It does not constitute financial advice, investment recommendations, or a solicitation to buy or sell any financial instruments. I will not accept liability for any loss or damage, including without limitation any loss of profit, which may arise directly or indirectly from the use of or reliance on such information. All investments involve risk, and the past performance of a security, industry, sector, market, financial product, trading strategy, backtest, or individual's trading does not guarantee future results or returns. Investors are fully responsible for any investment decisions they make. Such decisions should be based solely on an evaluation of their financial circumstances, investment objectives, risk tolerance, and liquidity needs.
When Intuition Beats the Algorithm
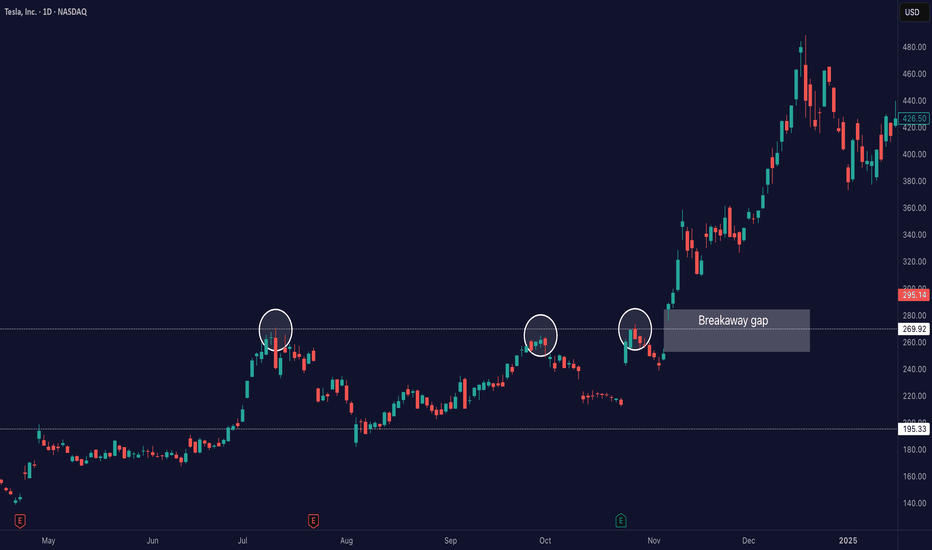
█ When Gut Feeling Beats the Bot: How Experience Can Improve Algorithmic Trading In today’s world of fast, data-driven trading, we often hear that algorithms and rules-based systems are the future. But what happens when you mix that with a trader’s intuition, the kind that only comes from years of watching charts and reading price action? A recent study has some surprising results: A seasoned discretionary trader (someone who trades based on what they see and feel, not just rules) was given a basic algorithmic strategy. The twist? He could override the signals and use his instincts. The result? He turned a losing system into a winning one, big time. █ What Was the Experiment? Researchers Zarattini and Stamatoudis (2024) wanted to test whether a skilled trader’s experience could boost a mechanical system. They took 9,794 stock “gap up” events from 2016 to 2023, where a stock opens much higher than the day before, and let the trader pick which ones looked promising. ⚪ To make it fair: All charts were anonymized — no names, no news, no distractions. The trader had only the price action to guide his choices. He could also manage open trades — adjusting stop-losses, profit targets, and position sizing based on what the price was doing. ⚪ The Trading Setup █ What Did They Find? The trader only selected about 18% of all the gap-ups. But those trades performed far better than the full list. Here's what stood out: Without stop-losses, the basic strategy lost money consistently (down -0.25R after just 8 days). With the trader involved, profits rose fast, hitting +0.80R just 4 days after entry. Risk was tightly managed: only 0.25% of capital was risked per trade. ⚪ So what made the difference? The trader could spot things the system missed: Strong momentum early in a move Clean breakouts from long sideways ranges Patterns that had real follow-through, not just random gaps He avoided weak setups and managed trades like a pro, cutting losers, letting winners run, and trailing positions with smart stop placements. ⚪ Example An experienced trader can quickly identify a breakaway gap, when a stock gaps up above a clear resistance level. Unlike random gaps, this setup often signals the start of a strong move. While a system might treat all gaps the same, a skilled trader knows this one has real potential. █ What Does This Mean for You? This research shows that trading experience still matters — a lot. If you’re a systematic trader, adding a discretionary filter (whether it’s your own review or someone else’s) could drastically improve your results. A clean chart read can help you avoid false signals and focus only on the best setups. If you’re a discretionary trader, this study is proof that your skills can add measurable value. With the right tools and discipline, you don’t need to throw away your instincts, you can combine them with structure and still win. █ Key Takeaways ⚪ Gut feeling isn’t just noise, trained instincts can spot what rules miss. ⚪ Trade selection matters more than just following every signal. ⚪ Managing risk and exits well is just as important as picking good entries. ⚪ Hybrid trading, rules plus judgment — might be the most powerful combo. ----------------- Disclaimer The content provided in my scripts, indicators, ideas, algorithms, and systems is for educational and informational purposes only. It does not constitute financial advice, investment recommendations, or a solicitation to buy or sell any financial instruments. I will not accept liability for any loss or damage, including without limitation any loss of profit, which may arise directly or indirectly from the use of or reliance on such information. All investments involve risk, and the past performance of a security, industry, sector, market, financial product, trading strategy, backtest, or individual's trading does not guarantee future results or returns. Investors are fully responsible for any investment decisions they make. Such decisions should be based solely on an evaluation of their financial circumstances, investment objectives, risk tolerance, and liquidity needs.
Why Volume Bar Colors Can Mislead You

█ The Truth Behind Volume Bars — What Do Green and Red Actually Mean? Most traders learn early on that green volume bars mean bullish activity, and red bars mean bearish pressure. But is it really that simple? What does volume truly reflect, and are we making assumptions that can mislead us? █ What Volume Actually Is Volume represents the number of shares/contracts traded during a specific time interval. Every transaction includes both a buyer and a seller. So, volume itself doesn’t distinguish whether a trade was bullish or bearish. Instead, platforms color volume bars based on price movement: Green: If price closed higher than it opened. Red: If price closed lower than it opened. Some platforms, like TradingView, allow you to color volume based on whether the price closed higher or lower than the previous candle’s close. So YOU, as a trader, have the chance to decide whether to assign volume bars either bullish or bearish! It’s a setting parameter anyone can change. Traders around the globe might look at the same volume bar, but some interpret it as bearish, while others interpret it as bullish. What is the most correct way? █ The Assumption Behind the Color This coloring assumes that: A rising price means buyers were more aggressive (lifting the ask). A falling price means sellers were more aggressive (hitting the bid). This is a proxy — an approximation. It simplifies market pressure into a binary outcome: if price goes up, it's bullish volume; if it goes down, it's bearish. But the market isn't always so binary. However, the assumption is only an approximation of buying vs. selling. In reality, every single trade involves both a buyer and a seller, so volume itself isn’t inherently “buy” or “sell” – what matters is who initiated the trades. As one trading expert explains, talking about “buying volume” vs “selling volume” can be misleading: for every buyer there is a seller, so volume cannot be literally split into purchases and sales. Instead, what traders really mean by “bullish volume” is that buyers were more aggressive (lifting offers) and drove the price up, whereas “bearish volume” means sellers were more aggressive (hitting bids) and drove the price down. The colored volume bar is essentially a proxy for which side won the battle during that bar. █ Why This Can Mislead You Price might close higher, not because there were more buyers than sellers (there never are — every trade has both), but because buyers were more urgent. And sometimes price moves due to other forces, like: Short covering. Stop-loss runs. Liquidity vacuums. This means a green bar might not reflect strong demand, just urgency from the other side closing their positions. ⚪ Example: Take the well-known GameStop short squeeze as an example. If you looked only at the volume bars during that rally, you’d see a wall of strong green candles and high volume, which might suggest aggressive bullish buying. However, that interpretation would be misleading. Under the surface, the surge wasn't driven by fresh bullish conviction — it was massive short covering. Traders who were short were forced to buy back shares to cover their positions, which drove prices even higher. The volume was categorized as bullish, but the true intent behind the move had nothing to do with new buying pressure. This demonstrates why relying solely on volume color or candle direction can lead to false conclusions about market sentiment. Does this simple up/down volume labeling truly reflect buying vs. selling pressure? To a degree, yes – it captures the net price outcome, which often corresponds to who was more aggressive. For example, if many buyers are willing to pay higher prices (demand), a bar will likely close up and be colored green, reflecting that buying interest. Conversely, if eager sellers are dumping shares and undercutting each other, price will drop, yielding a red bar that flags selling pressure. Traders often use rising volume on up-moves as confirmation of a bullish trend’s strength, and high volume on down-moves as a warning of distribution, which indeed aligns with traditional analysis That said, the method has important limitations and nuances, documented both anecdotally and in research: ⚪ Volume is not one-dimensional: Since every trade has both a buyer and seller, one cannot literally count “buy volume” vs “sell volume” without more information. The green/red coloring is a blunt classification based on price direction, not an actual count of buys or sells. It assumes the price change direction is an adequate proxy for the imbalance of buying vs. selling. This is often true in a broad sense, but it’s not a precise measure of order flow. ⚪ Intrabar Dynamics Are Lost: A single bar’s color only tells the end result of that interval, not the story of what happened during the bar. For instance, a 4-hour candle might be red (down) overall, but it could have contained three hours of rally (buying) followed by a steep selloff in the final hour that erased the gains. The volume bar will be colored red due to the net price drop, even though significant buying occurred earlier in the bar. In other words, a large red bar can mask that there were pockets of bullish activity within – the selling just happened to win out by the close of that period. Without looking at smaller time frames or detailed data, one can’t tell from a single color how the buying/selling tug-of-war progressed within the bar. ⚪ Gap Effects and Criteria Choices: The choice of using open vs. close or previous close can alter the interpretation of volume. As discussed, a day with a big gap can be labeled differently under the two methods. Neither is “right” or “wrong” – they just highlight different perspectives (intraday momentum vs. day-over-day change). Traders should be aware that colored volume bars are an approximation. A green volume bar under one method might turn red under the other method for the same bar. This doesn’t mean volume changed – it means the classification scheme changed. For example, a stock that closes below its open but still higher than yesterday will show a red volume bar by the intraday method but would be considered an “up-volume day” in OBV terms (previous close method). ⚪ No Indication of Magnitude or Commitment: A single color also doesn’t convey how much buying or selling pressure there was, only which side won. Two green volume bars might both be green, but one could represent a modest uptick with tepid buying, whereas another could represent an aggressive buying spree – the color alone doesn’t distinguish this (other than one bar likely being taller if volume was higher). Traders often need to consider volume relative to average (e.g. using volume moving averages or looking for volume spikes) to judge the significance of a move, not just the color. █ Summary The coloring of volume bars is a visual shortcut, not an exact science. It’s a guess based on price direction — useful, but imperfect. Understanding this helps traders avoid reading too much into what a green or red volume bar actually means. ----------------- Disclaimer The content provided in my scripts, indicators, ideas, algorithms, and systems is for educational and informational purposes only. It does not constitute financial advice, investment recommendations, or a solicitation to buy or sell any financial instruments. I will not accept liability for any loss or damage, including without limitation any loss of profit, which may arise directly or indirectly from the use of or reliance on such information. All investments involve risk, and the past performance of a security, industry, sector, market, financial product, trading strategy, backtest, or individual's trading does not guarantee future results or returns. Investors are fully responsible for any investment decisions they make. Such decisions should be based solely on an evaluation of their financial circumstances, investment objectives, risk tolerance, and liquidity needs.
Mastering Volatile Markets: Why Patience is Your Biggest Edge

█ Mastering Volatile Markets Part 3: Why Patience is Your Biggest Edge If you've read Part 1 about position sizing and Part 2 on liquidity , then you already know how to adapt to the mechanics of volatile markets. The next great tool in your arsenal will be patience. Your biggest opponent in wild markets is your own mind. In volatile markets, your emotions can easily get the best of you. Fear of missing out (FOMO) is one of the most dangerous emotions that drives poor decisions. █ FOMO (Fear of Missing Out) Hits Hardest in Volatile Markets Wild price swings, like 300-500 point moves in the Nasdaq or Bitcoin jumping $1000 in seconds, can make it feel like easy money is everywhere. You can quickly get the overwhelming temptation to chase moves , especially when it seems like you're missing every opportunity. This is where most traders lose. Let me state some harsh truths that I had to learn the hard way through many losses: Volatility doesn't equal opportunity. Fast moves don't mean easy trades. Most wild price moves are designed to trap liquidity and punish impatience. The true reality is that the market wants you to overreact in these conditions. It wants you to buy after a big move. It wants you to short after a flush. It thrives on you being emotional, chasing, and reacting. Because reactive traders = liquidity providers for smart money. Every single trader has made this mistake — not just once, but over and over again. Jumping into the market after a big move, hoping it will continue… but what usually happens? The market snaps back and stops you out. Can you relate? Share your story or experience with this in the comments below! █ What Experienced Traders Do Instead ⚪ They Know the First Move is Often the Trap Breakout? Expect a fakeout. Breakdown? Expect a snapback. New high? Watch for stop hunts. New low? Watch for a flush. Effectively speaking, pro traders don't chase the market. We wait for stop hunts to complete, liquidity grabs to finish, price to return into their zone, and for confirmations before entering the market. ⚪ They Train Patience Like a Skill Professional traders aren't more patient because they're "special." We are patient because we’ve learned the hard way that chasing leads to pain. ⚪ They Know When Not to Trade It is bad to trade when there’s no clear structure, no clean confirmation, if the spread is too wide or when the liquidity is too thin. Instead, pro traders let the market come to them , not the other way around. ⚪ They Turn FOMO into Confidence Instead of saying, "I'm missing the move…" , I recommend you think: "If it ran without me — it wasn't my trade." "If it comes back into my setup — now it's my trade." █ So, what have we learned today? Volatility triggers FOMO. FOMO triggers bad decisions. Bad decisions trigger losses. To win long-term, you must stay calm, selective and professional. Let other traders be emotional liquidity. That's how you survive volatile markets. █ What We Covered Already: Part 1: Reduce Position Size Part 2: Liquidity Makes or Breaks Your Trades Part 3: Why Patience is Your Biggest Edge █ What's Coming Next in the Series: Part 4: Trend Is Your Best Friend ----------------- Disclaimer The content provided in my scripts, indicators, ideas, algorithms, and systems is for educational and informational purposes only. It does not constitute financial advice, investment recommendations, or a solicitation to buy or sell any financial instruments. I will not accept liability for any loss or damage, including without limitation any loss of profit, which may arise directly or indirectly from the use of or reliance on such information. All investments involve risk, and the past performance of a security, industry, sector, market, financial product, trading strategy, backtest, or individual's trading does not guarantee future results or returns. Investors are fully responsible for any investment decisions they make. Such decisions should be based solely on an evaluation of their financial circumstances, investment objectives, risk tolerance, and liquidity needs.
Mastering Volatile Markets: Liquidity Makes or Breaks Trades

█ Mastering Volatile Markets Part 2: Why Liquidity Makes or Breaks Your Trades If you've read the first part of this four-part series, you know that reducing position size is a key strategy for surviving volatile markets. The second crucial factor that determines success or failure in wild markets is understanding liquidity. In volatile markets, liquidity is often the real reason behind those massive price spikes — whether 300-500 point moves in the NAS100, violent whipsaws in crypto or stop hunts in forex. █ Liquidity: The Silent Killer in Wild Markets In normal market conditions, liquidity is everywhere. You can enter and exit trades with minimal slippage, and everything feels smooth. But in volatile conditions, liquidity can disappear quickly. Here's why it happens: Market makers pull back to avoid getting caught in wild moves. Spreads widen , making execution harder. Order books thin out , meaning there aren't enough buy or sell orders to absorb aggressive price movements. Even small orders can cause significant price changes when liquidity is low. This is what causes those huge candles you often see in volatile markets. It's not just about more buyers or sellers; it's about less liquidity available to absorb those trades. There’s also a common misunderstanding at play here: High Volume = High Liquidity Many newer traders see a big volume candle and think, "Oh, high volume means it's safe to trade." But that’s an inaccurate conclusion. ⚪ Volume refers to the number of transactions happening. ⚪ Liquidity refers to how much depth the market has to handle those transactions without causing price instability. In volatile markets, high volume doesn't mean there's enough liquidity. And low liquidity causes wild wicks, huge spreads, higher slippage and unstable price action. █ How to Navigate Low Liquidity in Volatile Markets So, how can you trade effectively in these conditions? 1) Expect Crazy Moves — Levels Will Get Violated In high-volatility, low-liquidity markets: Support and resistance levels won't hold as they usually do. Price will blow through key levels like they were nothing. Fakeouts become extremely common. 2) Don't Rely Solely on Support & Resistance As a newer trader, it's vital not to blindly rely on S/R levels in these markets. Here's why: Don't expect clean bounces or perfect reactions. Fakeouts, wicks, and stop hunts are normal. Tight stops right behind these levels? You'll get stopped out a lot. Experienced traders know this, which is why we adapt the strategies to handle the market's unpredictability. 3) Split Your Orders Into Smaller Chunks One of the most effective techniques in volatile markets is order splitting. Break it into smaller chunks instead of entering your full position at one price. This would help you survive fakeouts, scale in better across larger price moves and avoid becoming liquidity for bigger players. Example: Let's say you want to go long at support (15,000 on the NAS100), instead of entering all at 15,000. Instead Enter: 25% at 15,000 25% at 14,950 25% at 14,900 25% at 14,850 This way, if the market fakes out below support due to low liquidity, you get filled at better prices without panic. 4) Control Your Emotions — Understand the Environment This is HUGE in volatile markets. Many retail traders panic when prices move against them quickly. But if you understand the nature of low liquidity , you can remain calm: It's normal for the price to move wildly. Levels will get swept. Fake moves are common before the market plays out the right way. █ Summary Let’s take stock of what we learned today about liquidity in highly volatile markets: High volatility often equals low liquidity. High volume does not equal high liquidity. Expect fakeouts , wild price behavior, and wide spreads. Don't rely blindly on support/resistance levels. Split your orders into smaller chunks to manage risk. Trade smaller position sizes and stay calm. Remember, you must adapt not only your size but also your execution . Understand liquidity, or it will punish you. █ What We Covered Already: Part 1: Reduce Position Size Part 2: Liquidity Makes or Breaks Trades █ What's Coming Next in the Series: Part 3: Patience Over FOMO Part 4: Trend Is Your Best Friend ----------------- Disclaimer The content provided in my scripts, indicators, ideas, algorithms, and systems is for educational and informational purposes only. It does not constitute financial advice, investment recommendations, or a solicitation to buy or sell any financial instruments. I will not accept liability for any loss or damage, including without limitation any loss of profit, which may arise directly or indirectly from the use of or reliance on such information. All investments involve risk, and the past performance of a security, industry, sector, market, financial product, trading strategy, backtest, or individual's trading does not guarantee future results or returns. Investors are fully responsible for any investment decisions they make. Such decisions should be based solely on an evaluation of their financial circumstances, investment objectives, risk tolerance, and liquidity needs.
Order Imbalance and Change Point Detection

█ Order Imbalance and Change Point Detection Trading might sometimes seem like magic, but at its core, the market operates on simple principles, supply and demand, and the flow of information. Recent academic work shows that retail traders can gain an edge even without expensive data feeds by understanding some fundamental ideas, like order imbalance and change point detection. In this article, we break down key concepts such as order imbalance, sudden volume shifts, change point detection, and the CUSUM algorithm. We also explain how retail traders can apply these ideas to improve their strategies. █ What Is the Order Book and Order Imbalance? ⚪ The Order Book Every market has an order book, simply a list of all buy orders (bids) and sell orders (asks) for an asset. ⚪ Order Imbalance – A Key Indicator Order imbalance measures the difference between the total buying and selling orders for the order book. Definition: Order imbalance is the difference in volume between buy orders and sell orders. Why It Matters: A strong imbalance means one side (buyers or sellers) is dominating. For example, if there are significantly more buy orders than sell orders, the market may be gearing up for a price increase. ⚪ How It’s Detected in Research: Researchers calculate a volume-weighted average price (VWAP) across multiple price levels in the order book (typically the top 20 levels) and compare it to the mid-market price. A positive imbalance indicates aggressive buying, while a negative imbalance suggests selling pressure. █ Sudden Volume Shifts and Change Point Detection ⚪ Sudden Volume Shifts What It Means: Sometimes, there is an abrupt and noticeable change in the number of orders placed. This sudden shift in volume can signal a big move on the horizon. Example: In a trading context, this might be seen when volume bars spike unexpectedly on a price chart, often accompanying rapid price moves or breakouts. ⚪ Why They Are Crucial: Sudden volume increases often coincide with significant order flow events. For instance, if a large number of buy orders hit the market at once, this could indicate a rapid shift in trader sentiment and serve as a precursor to a sustained price move. █ Change Point Detection – Spotting the Shift Definition: Change point detection is a statistical technique used to identify the exact moment when the properties of a data series change significantly. Purpose: In trading, it helps distinguish meaningful shifts in market behavior from random noise. How It’s Used: Researchers apply this to order imbalance data to flag moments when the market’s buying or selling pressure changes abruptly. These flagged moments (or “change points”) can then be used to forecast short-term price movements. █ Meet CUSUM: The Cumulative Sum Algorithm CUSUM stands for Cumulative Sum. It’s a simple yet powerful algorithm that detects changes in a data series over time. ⚪ How CUSUM Works: Tracking Deviations: The algorithm continuously adds up minor differences (or deviations) from an expected value (like a running average). Signal for Change: When the cumulative sum exceeds a predetermined threshold, it signals that a significant change has occurred. In Trading: CUSUM can be applied to measure the order imbalance. When the cumulative deviation is high enough, it indicates a strong change in market pressure, an early warning signal for a potential price move. For example, a rising cumulative sum based on increasing buy-side pressure might indicate that the price will likely move upward. █ How Can Retail Traders Benefit Without Full LOB Data? Full access to the order book (all price levels and orders) can be expensive and is usually reserved for institutional traders. However, retail traders can still gain valuable insights by: ⚪ Using Proxies for Order Imbalance: Many trading platforms offer basic volume indicators. Look for volume spikes or unusual shifts in trading volume as a sign that order imbalance might occur. ⚪ Leveraging Simplified Change Detection: Even if you don’t have complex LOB data, you can set up simple alerts on your trading platform. For instance, you might create a custom indicator that watches for rapid increases in volume or price moves, similar to a basic version of the CUSUM algorithm. ⚪ Focusing on Key Price Levels: Even with limited data, monitor support and resistance levels. A sudden break (accompanied by high volume) can serve as a proxy for a change in market dynamics. ⚪ Adopting a Data-Driven Mindset: Integrate these concepts into your routine analysis. When you see a significant volume shift or a sudden spike in activity, consider it a potential “change point” and adjust your strategy accordingly. █ In Summary Order Imbalance measures the difference between buying and selling volumes in the order book, offering insights into market direction. Sudden Volume Shifts are significant changes in trading volume that can signal a shift in market sentiment. Change Point Detection helps identify the precise moments when these shifts occur, filtering out noise and highlighting actionable signals. CUSUM is a powerful tool that continuously tracks cumulative deviations in market data, alerting traders when the market undergoes a significant change. For retail traders, these methods underscore the importance of watching price and understanding the underlying order flow. While you might not have access to full-depth order book data, using volume indicators and setting up alert systems can help you capture the essence of these insights, providing a valuable edge in your trading decisions. ----------------- Disclaimer The content provided in my scripts, indicators, ideas, algorithms, and systems is for educational and informational purposes only. It does not constitute financial advice, investment recommendations, or a solicitation to buy or sell any financial instruments. I will not accept liability for any loss or damage, including without limitation any loss of profit, which may arise directly or indirectly from the use of or reliance on such information. All investments involve risk, and the past performance of a security, industry, sector, market, financial product, trading strategy, backtest, or individual's trading does not guarantee future results or returns. Investors are fully responsible for any investment decisions they make. Such decisions should be based solely on an evaluation of their financial circumstances, investment objectives, risk tolerance, and liquidity needs.
Insights from Financial Influencers: Lessons for Retail Traders

In today’s digital age, social media has become a cornerstone of information for nearly every aspect of our lives. From lifestyle tips to financial advice, influencers wield significant power over public sentiment. Among them are financial influencers, or "finfluencers," who share investment tips, stock picks, and market analyses. But how reliable is their advice? Can retail traders use their recommendations to improve their trading strategies? A recent research paper titled Finfluencers by the Swiss Finance Institute dives deep into these questions. The study examines the accuracy, influence, and implications of finfluencers’ advice. Its findings are both eye-opening and actionable for retail traders looking to navigate the crowded world of social media-driven investing. █ The Truth About Finfluencers The study analyzed tweet-level data from over 29,000 finfluencers on StockTwits, classifying them into three distinct groups: Skilled Finfluencers: These individuals represent 28% of the sample and are the true gems among finfluencers. Their advice generates an average of 2.6% monthly abnormal returns, indicating that they provide genuinely valuable insights. Skilled finfluencers often tweet less frequently and tend to post data-driven and sometimes negative assessments, which align with their ability to outperform. Unskilled Finfluencers: Accounting for 16% of the sample, unskilled finfluencers have little to no impact on returns. Their advice is neither harmful nor particularly beneficial, making them neutral players in the social media finance space. Despite their lack of effectiveness, these influencers still attract some attention due to their activity levels and relatability. Antiskilled Finfluencers: Shockingly, 56% of finfluencers fall into this category, making them the majority. Antiskilled influencers consistently provide poor advice, generating an average of -2.3% monthly abnormal returns. Their recommendations often reflect overly optimistic or flawed beliefs, leading followers astray. Despite their negative track record, antiskilled finfluencers tend to have the largest followings and the most influence, driven by behavioral biases such as homophily and their frequent activity on social media. Surprisingly, the study found that unskilled and antiskilled finfluencers have more followers and exert greater influence than their skilled counterparts. This phenomenon is linked to behavioral biases such as homophily—a tendency for people to align with others who share similar opinions, even if those opinions lack merit. █ Why Antiskilled Influencers Thrive One might wonder how antiskilled finfluencers manage to amass large followings despite their poor track records. The research highlights several reasons: Popularity Over Precision: Social media rewards engagement and relatability, often sidelining the importance of accuracy. Behavioral Biases: Retail traders are drawn to familiar or optimistic messages, even when they’re unfounded. Tweet Frequency: Antiskilled influencers tend to post more frequently, increasing their visibility and perceived authority. Interestingly, the study also found that skilled finfluencers tend to post less frequently and are more likely to share negative but accurate assessments. This trait aligns with their ability to generate better returns but limits their mass appeal. █ How Retail Traders Can Benefit The research offers valuable lessons for retail traders looking to cut through the noise and make informed decisions: ⚪ Think Critically About Popular Advice Just because an influencer has a large following doesn’t mean their advice is sound. Popularity often correlates with engagement rather than expertise. Before acting on any recommendation, evaluate the influencer’s track record and consider the rationale behind their advice. ⚪ Embrace Contrarian Investing One of the study’s most intriguing findings is the profitability of a contrarian approach. By systematically trading against the advice of antiskilled influencers, traders can achieve abnormal returns. This strategy, humorously dubbed “the wisdom of the antiskilled crowd,” underscores the potential of doing the opposite of what bad advice suggests. ⚪ Look for Quality Over Quantity Skilled finfluencers often tweet less frequently but provide higher-quality insights. Traders should prioritize substance over volume, seeking out influencers who back their recommendations with data and sound reasoning. ⚪ Understand Behavioral Biases Being aware of biases like homophily can help traders make more rational decisions. Instead of gravitating toward advice that feels familiar or comforting, focus on advice that is well-supported and objective. █ A Practical Example Imagine you follow an antiskilled finfluencer who frequently posts bullish advice on various stocks. According to the research, these recommendations are likely to lead to losses. Instead of following their advice, you could develop a contrarian strategy by shorting or avoiding their suggested stocks. Backtesting this approach could reveal a consistent edge over time. Similarly, tracking skilled finfluencers who post less often but provide thoughtful analyses can complement this strategy, offering a balanced approach to decision-making. █ Final Thoughts The Finfluencers research sheds light on the complex dynamics of financial advice on social media. While social platforms have democratized access to information, they’ve also amplified the voices of unskilled and antiskilled influencers. For retail traders, this presents both challenges and opportunities. By approaching social media advice with a critical eye and leveraging the insights from this research, traders can navigate the pitfalls of herd mentality and capitalize on the inefficiencies created by antiskilled influencers. Ultimately, the key is to focus on evidence-based strategies and remember that the messenger’s popularity doesn’t always reflect the quality of their message. As the researchers aptly conclude: “The message is more important than the messenger.” In the ever-evolving world of retail trading, this is advice worth heeding. ----------------- Disclaimer This is an educational study for entertainment purposes only. The information in my Scripts/Indicators/Ideas/Algos/Systems does not constitute financial advice or a solicitation to buy or sell securities. I will not accept liability for any loss or damage, including without limitation any loss of profit, which may arise directly or indirectly from the use of or reliance on such information. All investments involve risk, and the past performance of a security, industry, sector, market, financial product, trading strategy, backtest, or individual's trading does not guarantee future results or returns. Investors are fully responsible for any investment decisions they make. Such decisions should be based solely on evaluating their financial circumstances, investment objectives, risk tolerance, and liquidity needs. My Scripts/Indicators/Ideas/Algos/Systems are only for educational purposes!
Short Sellers: Liquidity Providers or Market Disruptors?
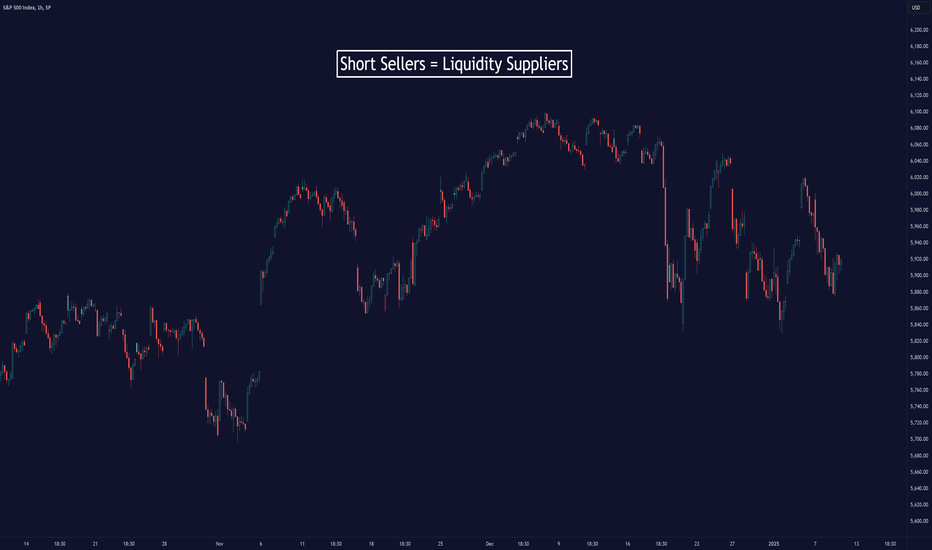
█ Understanding Short Sellers: Liquidity Providers or Market Disruptors? Short sellers often have a controversial reputation, viewed by many as market manipulators who profit from falling stock prices. However, recent research sheds light on an unexpected and valuable role they play: providing liquidity to the market, especially during critical moments like news releases. Let’s break down this concept in a way that’s approachable for everyone while maintaining the insights of the academic findings. █ What Is Short Selling? In simple terms, short selling is a trading strategy where an investor borrows shares of a stock, sells them, and hopes to buy them back later at a lower price to pocket the difference. While this might sound straightforward, it’s a high-risk activity because the potential losses are unlimited if the stock price rises instead of falling. For long-term investors, the goal is usually to buy strong companies that will grow over time, benefiting from compounding returns and supporting broader economic growth. On the other hand, short selling tends to attract risk-seekers who aim to profit from price declines. Unfortunately, many inexperienced short sellers get burned by the complexities of market dynamics, including the balance of supply and demand for liquidity. █ Why Is Short Selling Important? Despite the risks, short sellers are essential to the financial markets. They help correct overpriced stocks and bring balance to valuations, contributing to more accurate pricing. Moreover, they provide critical insights during times of market euphoria or uncertainty. One example of their importance is the role of short sellers during events like the “short squeezes” in GameStop or Volkswagen. These situations occur when a stock’s price skyrockets, often fueled by retail traders or unexpected news, forcing short sellers to buy back shares at higher prices. While dramatic, such events highlight the complex interaction between short selling and market liquidity. █ A Fresh Perspective: Short Sellers as Liquidity Providers Traditional thinking often casts short sellers as aggressive traders who demand liquidity—placing orders that consume existing bids or offers in the market. However, a recent study challenges this view, showing that some short sellers do the opposite: they provide liquidity. Using transaction-level data, the study reveals that informed short sellers strategically supply liquidity by posting and maintaining limit orders. These orders help stabilize markets, especially during volatile periods like news days. This behavior contrasts with the common perception of short sellers as disruptive forces, instead positioning them as contributors to market efficiency. █ Key Findings from the Research The research, titled Stealthy Shorts: Informed Liquidity Supply, presents several critical insights: ⚪ Liquidity-Supplying vs. Liquidity-Demanding Short Sales: Liquidity-supplying short sellers place limit orders, offering to sell shares at specific prices. Liquidity-demanding short sellers use market orders, which take the best available prices. The study found that liquidity-supplying short sales are more predictive of future stock returns than liquidity-demanding ones. ⚪ Predictive Power of Liquidity-Supplying Shorts: Stocks with high levels of liquidity-supplying short sales underperform those with low levels over a 21-day holding period. This pattern suggests that these short sellers have a long-term informational edge. ⚪ Impact on Price Discovery: By providing liquidity, these short sellers help narrow bid-ask spreads, making it easier for other investors to enter or exit positions at favorable prices. ⚪ Informed Trading: Liquidity-supplying short sellers often act on information not yet fully reflected in stock prices. For example, they are particularly active and accurate around news days when fresh information enters the market. █ Implications for Investors and Regulators The findings challenge regulators and market participants to rethink their views on short sellers. While short selling is often criticized for its potential to destabilize markets, this study highlights a more nuanced role: informed short sellers contribute to market liquidity and efficiency. For everyday investors, this means that short sellers aren’t just betting against companies but also helping ensure that stock prices reflect their true value over time. █ Takeaways for Beginners If you’re new to investing, here’s what you should know: Short selling is risky and generally not recommended for beginners. The potential for unlimited losses makes it a strategy better suited for experienced traders. Short sellers play a vital role in financial markets by helping correct mispricings and improving liquidity. Understanding the mechanics of liquidity supply and demand can provide valuable insights into how markets function. █ Final Thoughts This research highlights the dual role of short sellers, particularly the most informed ones, as both traders and market stabilizers. By offering liquidity and acting on long-lived information, these traders help create more efficient markets, benefiting everyone from retail investors to large institutions. As always, a deeper understanding of market dynamics can empower better investment decisions and help you navigate the complexities of the financial world with confidence. ----------------- Disclaimer This is an educational study for entertainment purposes only. The information in my Scripts/Indicators/Ideas/Algos/Systems does not constitute financial advice or a solicitation to buy or sell securities. I will not accept liability for any loss or damage, including without limitation any loss of profit, which may arise directly or indirectly from the use of or reliance on such information. All investments involve risk, and the past performance of a security, industry, sector, market, financial product, trading strategy, backtest, or individual's trading does not guarantee future results or returns. Investors are fully responsible for any investment decisions they make. Such decisions should be based solely on evaluating their financial circumstances, investment objectives, risk tolerance, and liquidity needs. My Scripts/Indicators/Ideas/Algos/Systems are only for educational purposes!
Understanding Window Dressing: What It Is and Why It Happens
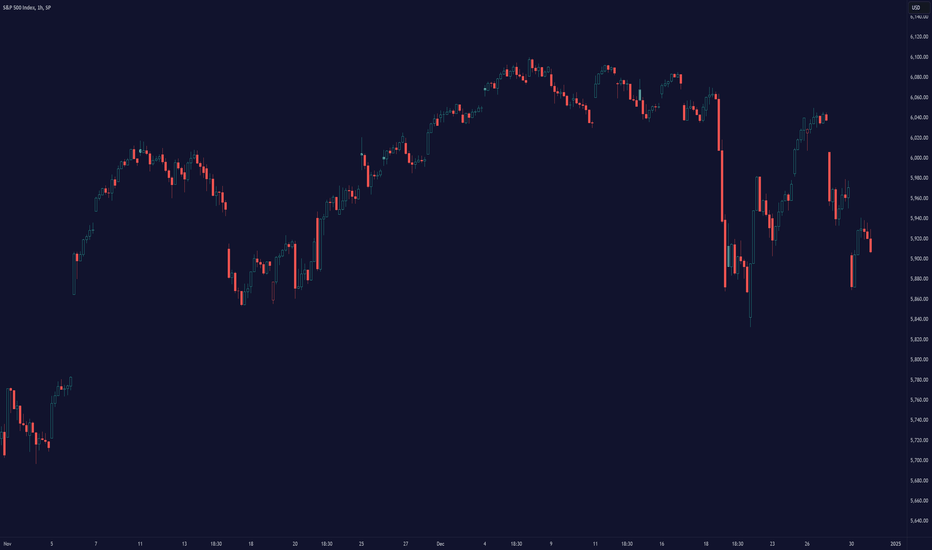
█ Understanding Window Dressing: What It Is and Why It Happens At the end of every quarter or year, especially in December, some fund managers engage in a practice called window dressing. While it may sound like a holiday tradition, it’s actually a financial strategy designed to make a portfolio look more attractive to investors. Here's what you need to know: █ What Is Window Dressing? Window dressing happens when fund managers adjust their portfolios right before reporting periods. They sell underperforming stocks and buy high-performing ones to present a cleaner, more successful-looking portfolio in reports to clients or investors. This tactic gives the appearance of strong investment decisions, even if the actual performance over the quarter or year was lackluster. █ Why Do Fund Managers Do It? To Impress Investors: Fund managers want their reports to show a strong portfolio, which can attract new investors and retain current ones. To Boost Confidence: A portfolio filled with "winning" stocks makes it seem like the fund consistently picks the right investments. To Justify Performance: If a fund struggled during the year, window dressing can shift focus away from losses. █ How Does It Work? Selling Losing Stocks: Underperforming stocks are sold off so they don't appear in the end-of-year report. Example: A fund holding a struggling tech stock might sell it in December to avoid questions about its performance. Buying Winning Stocks: Managers may buy stocks that performed well recently, even if they didn’t hold them earlier, to create the illusion of good timing. Example: Adding shares of a high-flying AI company to the portfolio in December to make it seem like they capitalized on the trend. █ Examples in Action ⚪ Market Volatility in December As the 2024 trading year wrapped up, U.S. stock markets experienced notable declines, reflecting a mix of profit-taking, year-end adjustments, and portfolio rebalancing. One key driver of this volatility was window dressing. Fund managers, aiming to improve the appearance of their portfolios, sold off underperforming stocks in bulk before the year-end reporting period. This large-scale activity added pressure to the already vulnerable market, amplifying price movements, particularly in weaker stocks. Example: Imagine a fund holding several tech stocks that underperformed in 2024. By December, the fund may decide to sell these stocks en masse, effectively clearing them from their books. This sudden selling can further depress the stock prices of those underperforming companies, creating a ripple effect across the broader market. Broader Market Impact: The sharp sell-offs from window dressing contribute to increased market fluctuations, which can mislead casual investors into thinking these stocks are worse off than they might be in the long term. ⚪ Tax-Loss Selling In addition to window dressing, another widespread practice that overlaps with it during December is tax-loss selling. This is when fund managers or individual investors sell losing stocks to offset their capital gains for tax purposes. This allows them to reduce their taxable income while simultaneously adjusting their portfolios for the new year. How It Overlaps: A fund manager selling a losing stock for tax purposes might also be engaging in window dressing, as this helps clean up the portfolio's appearance for the year-end report. The dual motivation often drives even more selling pressure on underperforming stocks in December. Example: Suppose a fund owns shares of a biotech company that fell significantly during the year. Selling the shares not only offsets gains elsewhere in the portfolio but also removes the "blemish" of a losing position from the annual report. █ Is Window Dressing Legal? Yes, it’s legal, but it’s often criticized for being misleading. Investors might think the fund's performance was better than it actually was. Regulators like the SEC are taking steps to increase transparency. For example, mutual funds will soon have to report their holdings monthly instead of quarterly, making it harder to hide these tactics. █ How Does It Affect You as an Investor? Short-Term Market Volatility: Window dressing can cause unusual price movements in December as funds adjust their portfolios. Misleading Reports: If you’re investing in mutual funds or ETFs, the end-of-year portfolio may not reflect the manager’s true strategy or the fund’s performance throughout the year. █ Takeaway for Investors Window dressing is a reminder to look beyond year-end reports when evaluating a fund. Focus on long-term performance and consistency rather than just the holdings shown in December. Transparency regulations will help, but it’s always wise to dig deeper. By understanding window dressing, you can make more informed decisions about your investments and avoid being misled by this common, yet questionable, practice. ----------------- Disclaimer This is an educational study for entertainment purposes only. The information in my Scripts/Indicators/Ideas/Algos/Systems does not constitute financial advice or a solicitation to buy or sell securities. I will not accept liability for any loss or damage, including without limitation any loss of profit, which may arise directly or indirectly from the use of or reliance on such information. All investments involve risk, and the past performance of a security, industry, sector, market, financial product, trading strategy, backtest, or individual's trading does not guarantee future results or returns. Investors are fully responsible for any investment decisions they make. Such decisions should be based solely on evaluating their financial circumstances, investment objectives, risk tolerance, and liquidity needs. My Scripts/Indicators/Ideas/Algos/Systems are only for educational purposes!
Disclaimer
Any content and materials included in Sahmeto's website and official communication channels are a compilation of personal opinions and analyses and are not binding. They do not constitute any recommendation for buying, selling, entering or exiting the stock market and cryptocurrency market. Also, all news and analyses included in the website and channels are merely republished information from official and unofficial domestic and foreign sources, and it is obvious that users of the said content are responsible for following up and ensuring the authenticity and accuracy of the materials. Therefore, while disclaiming responsibility, it is declared that the responsibility for any decision-making, action, and potential profit and loss in the capital market and cryptocurrency market lies with the trader.