
YetAnotherTA
@t_YetAnotherTA

What symbols does the trader recommend buying?
Purchase History
پیام های تریدر
Filter
YetAnotherTA
بیت کوین رکورد زد اما چرا تحلیلگران نگرانند؟ (هشدار ساختار صعودی خطرناک)

BTCUSD hit it's all time high above 126000 yesterday and yet, when you look at the structure of #BTCUSD, it doesn't inspire confidence. It looks like a huge rising wedge with bearish implications. And if this structure is going to play out then bitcoin is likely near it's top.
YetAnotherTA
کفسازی بیتکوین تمام شد؟ علائم صعود یا تله بزرگ قبل از جهش بزرگ BTC!

BTCUSD weekly is showing breakout from a base around 119500. Volumes are increasing but not good enough yet so a retest maybe. Or could this be a fake-out? Only time will tell ...
YetAnotherTA
شکست تاریخی انویدیا (NVDA): آیا سقف 200 دلار در دسترس است؟

NVDA is just unstoppable. It broke out again from this base which can also qualify as a cup and handle (C&H) continuation. Going by the size of pattern, it could very well he hitting 200 soon, though exact size comes at around 205.
YetAnotherTA

NVDA and AMD are both showing 5 wave rise in weekly chart after a correction in WXY. I haven't checked but other AI related stocks also might be doing something similar. Once the 5 waves are over, we can expect some correction but the 5-wave rise post a correction typically signals fresh uptrend so it might be worth keeping an eye on these stocks. Waiting till retracement/correction of this rise is complete.
YetAnotherTA
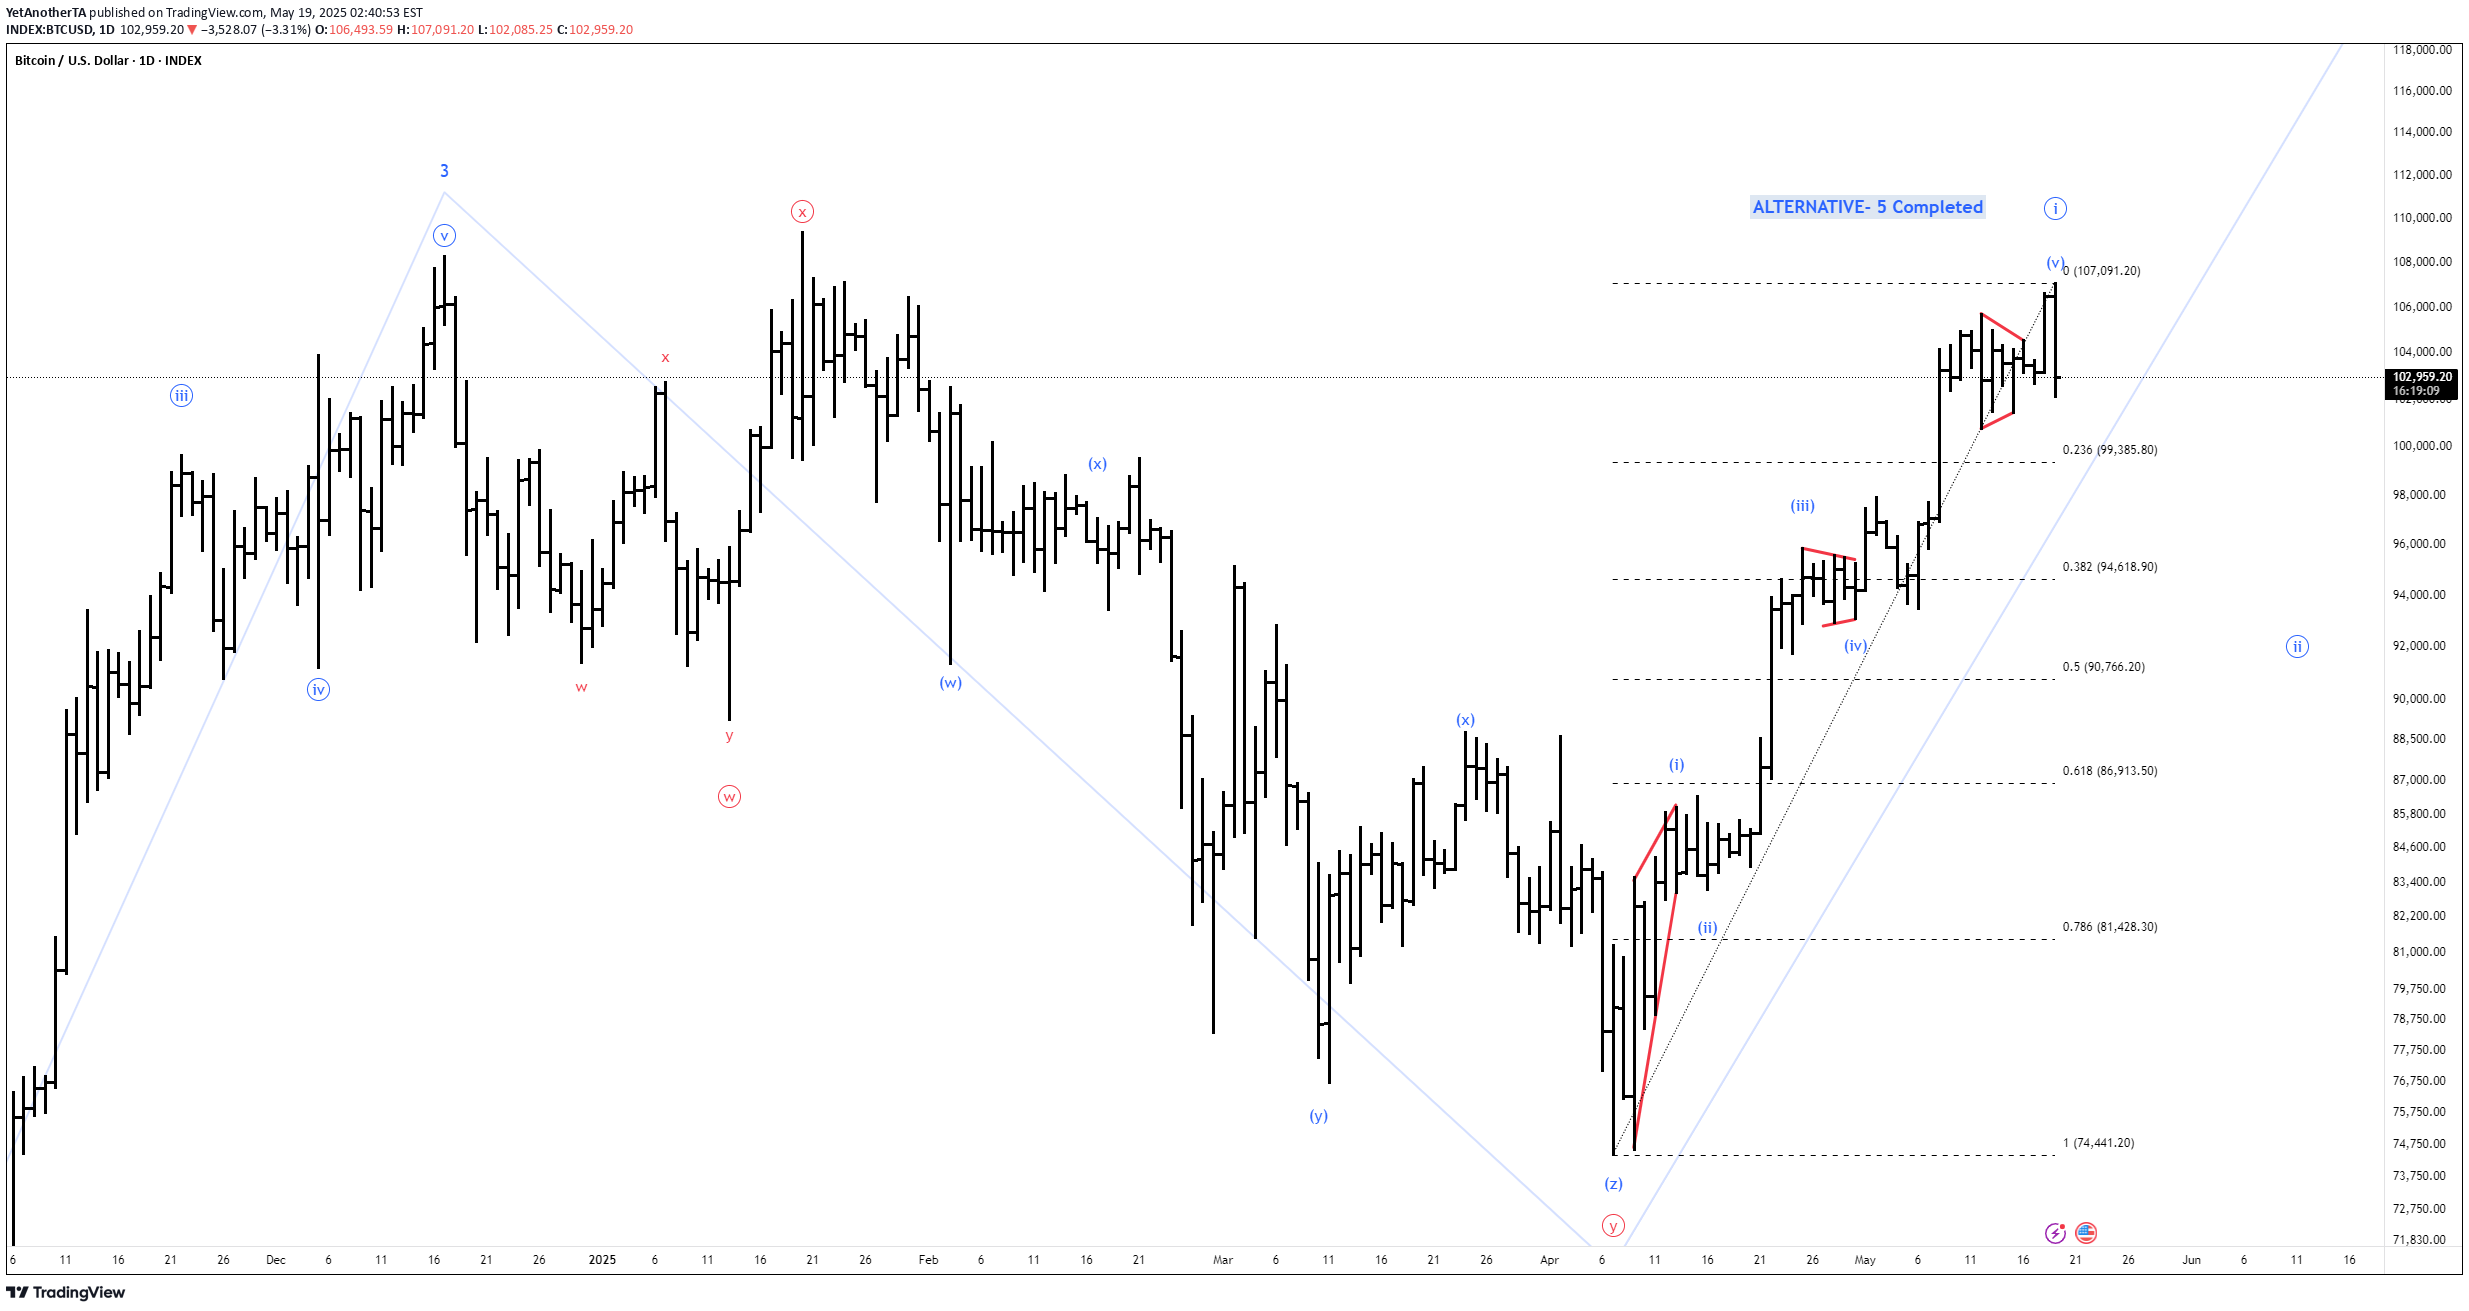
Some degree of 5 waves completed yesterday and reversal signs are there. Now, this 5 waves up could be just 1st leg of larger 5th or the 5th itself since this leg was 2.6 times of leg 1. Either way, we are heading towards 90K and if this was larger 5th that got complete then it's time for "serious worry", specially if you are a HODLer.
YetAnotherTA
Being cautiously optimistic - I can see a potential leading diagonal formation followed by 3-3 legs which could be legs w-x of w-x-y or w-x-y-x-z.Only time will tell if this is what I think it is o it evolves into another corrective rise followed by further downside.
YetAnotherTA
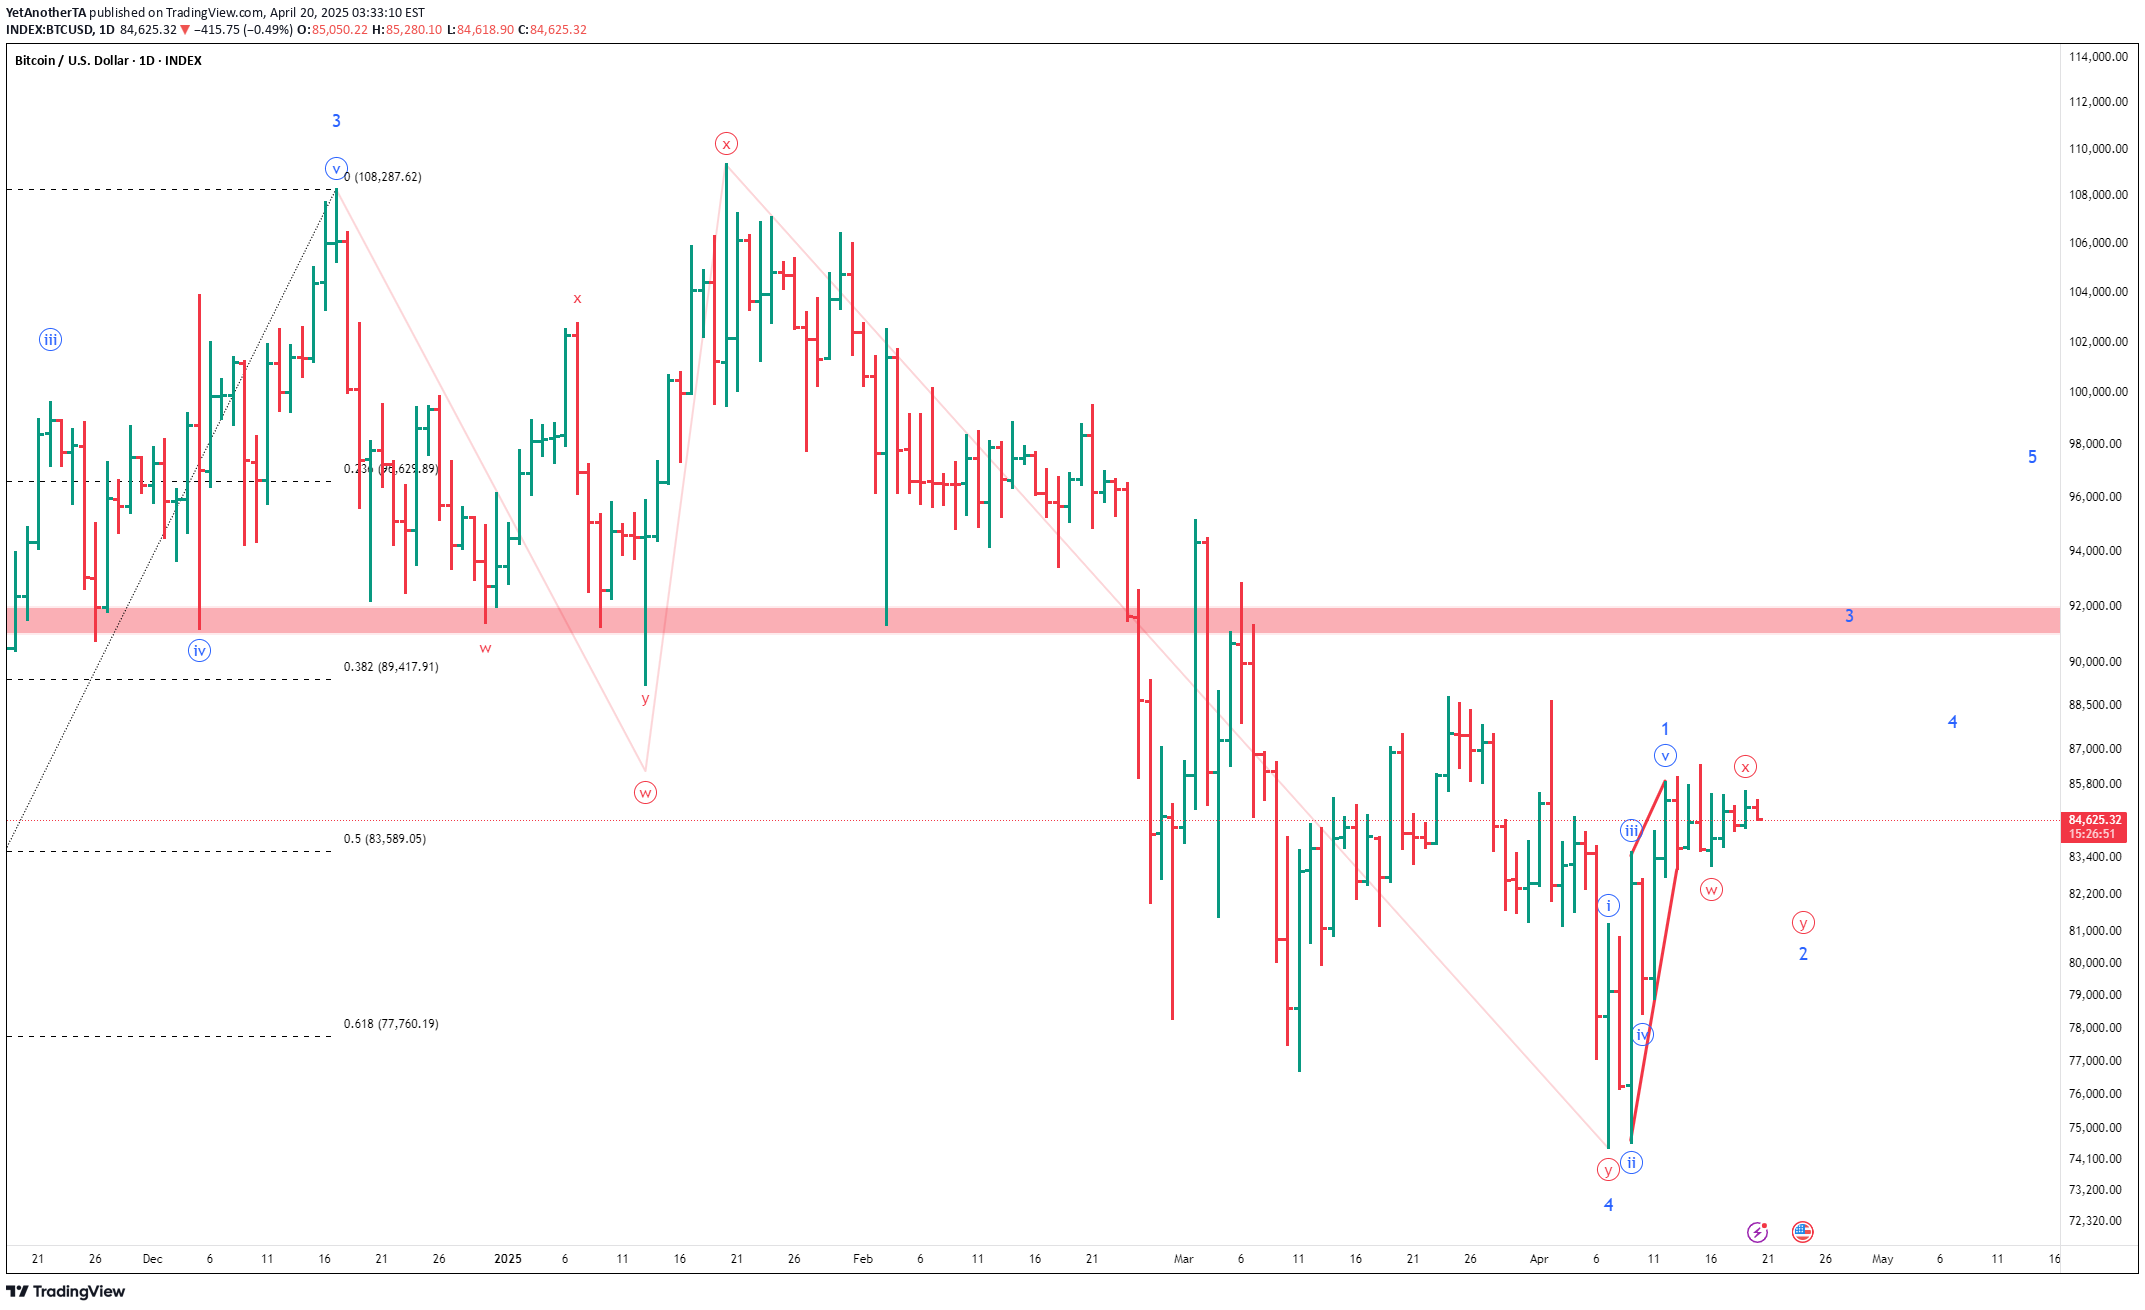
BTCUSD has broken down from a bearish wedge in hourly. I expect it to do at least 38.2% retracement around 84k, though it could likely go lower around 50% as well which is around 82,600. Closing below 80k might open doors to resumption of downside trend.
YetAnotherTA
YetAnotherTA
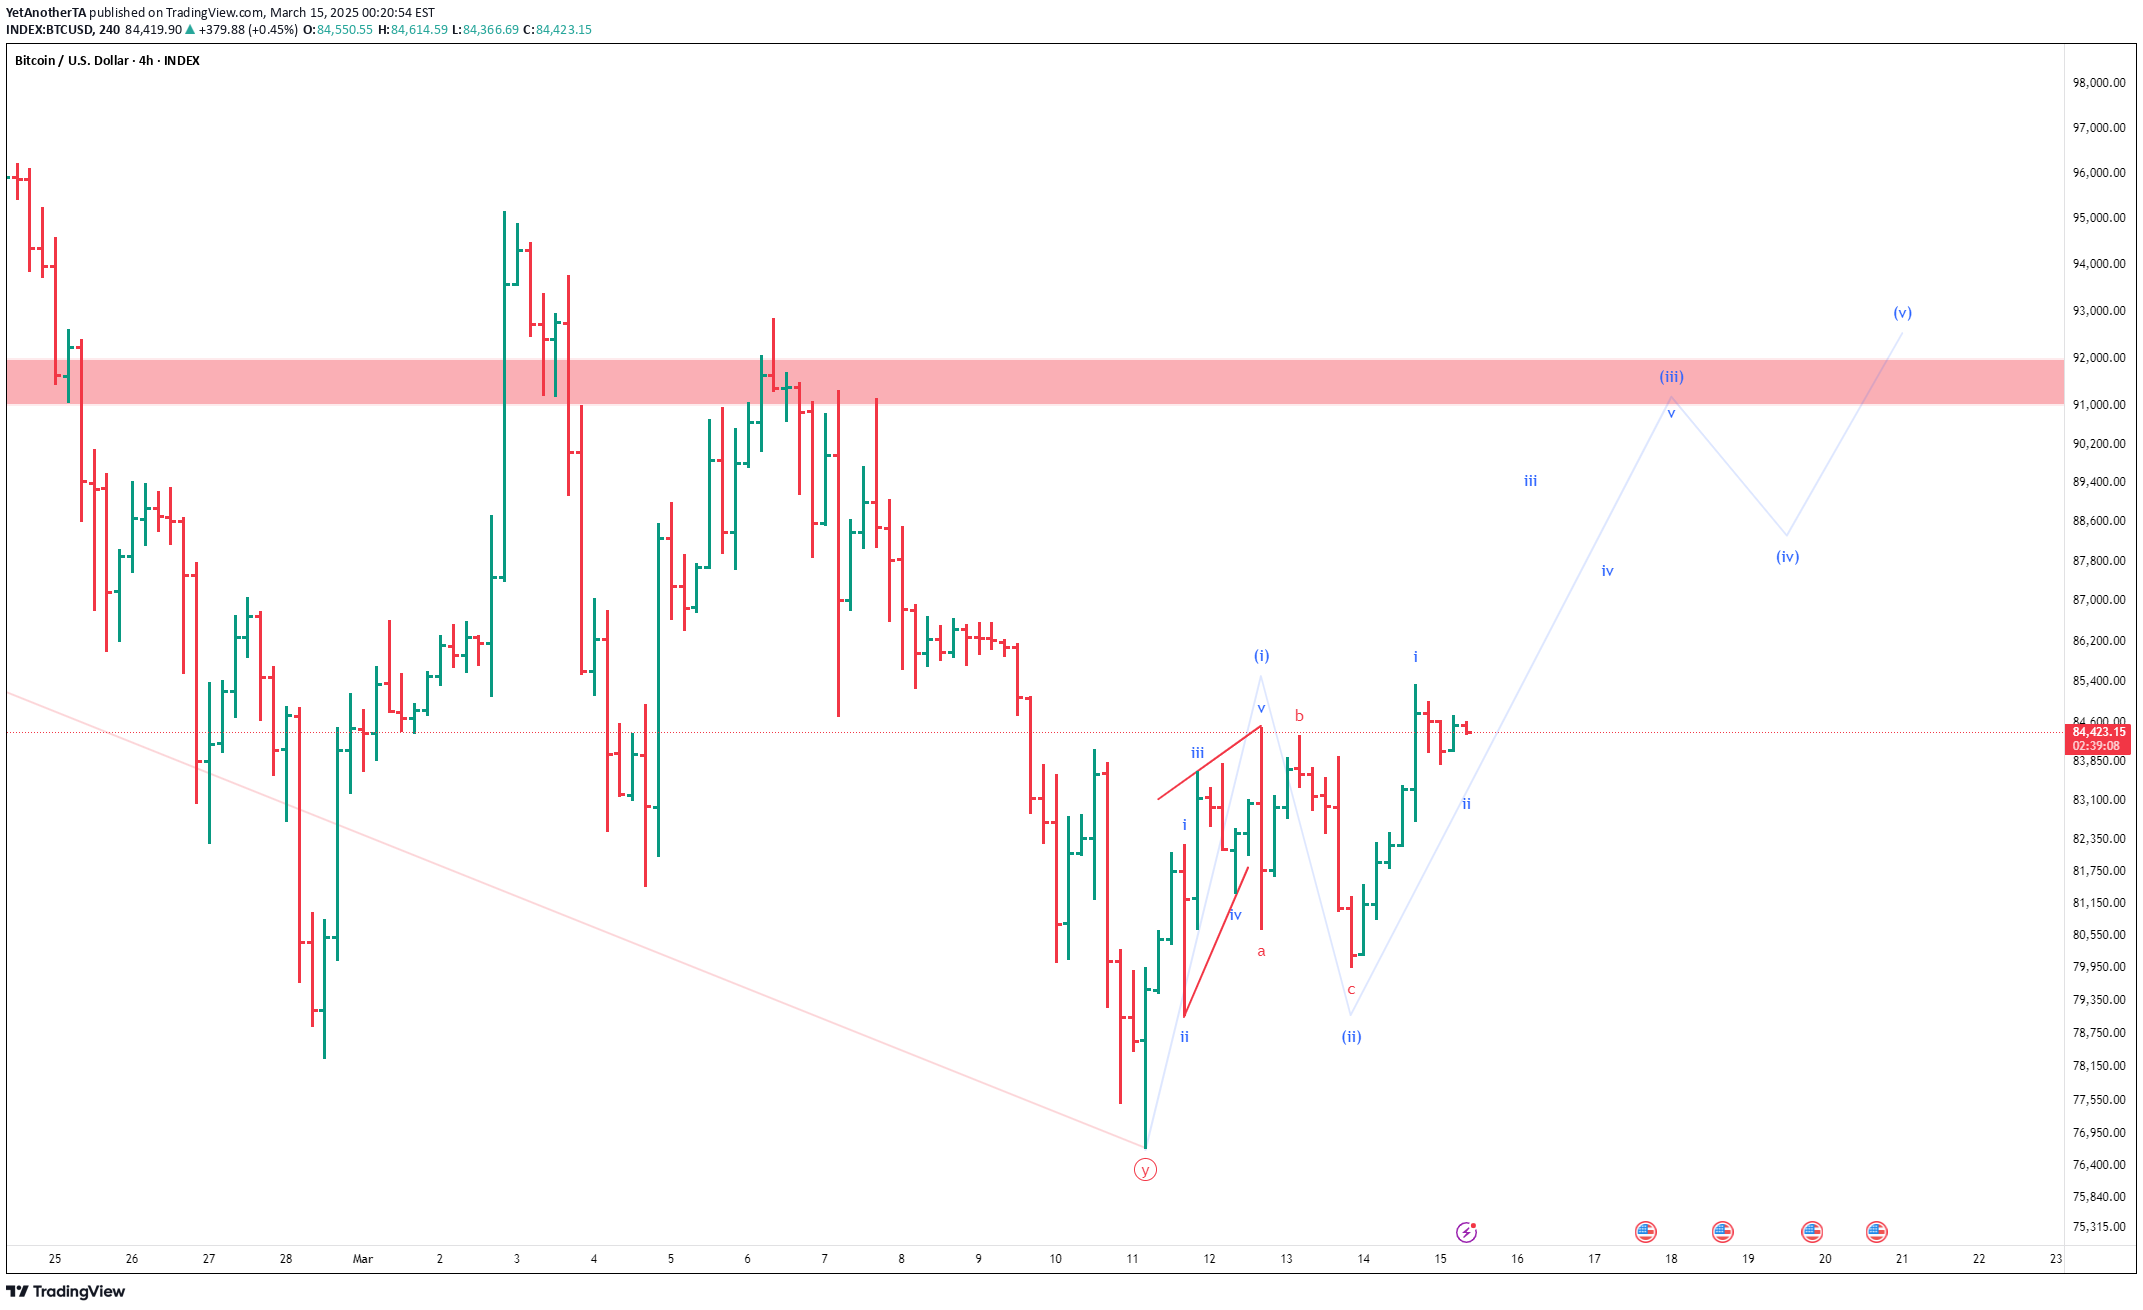
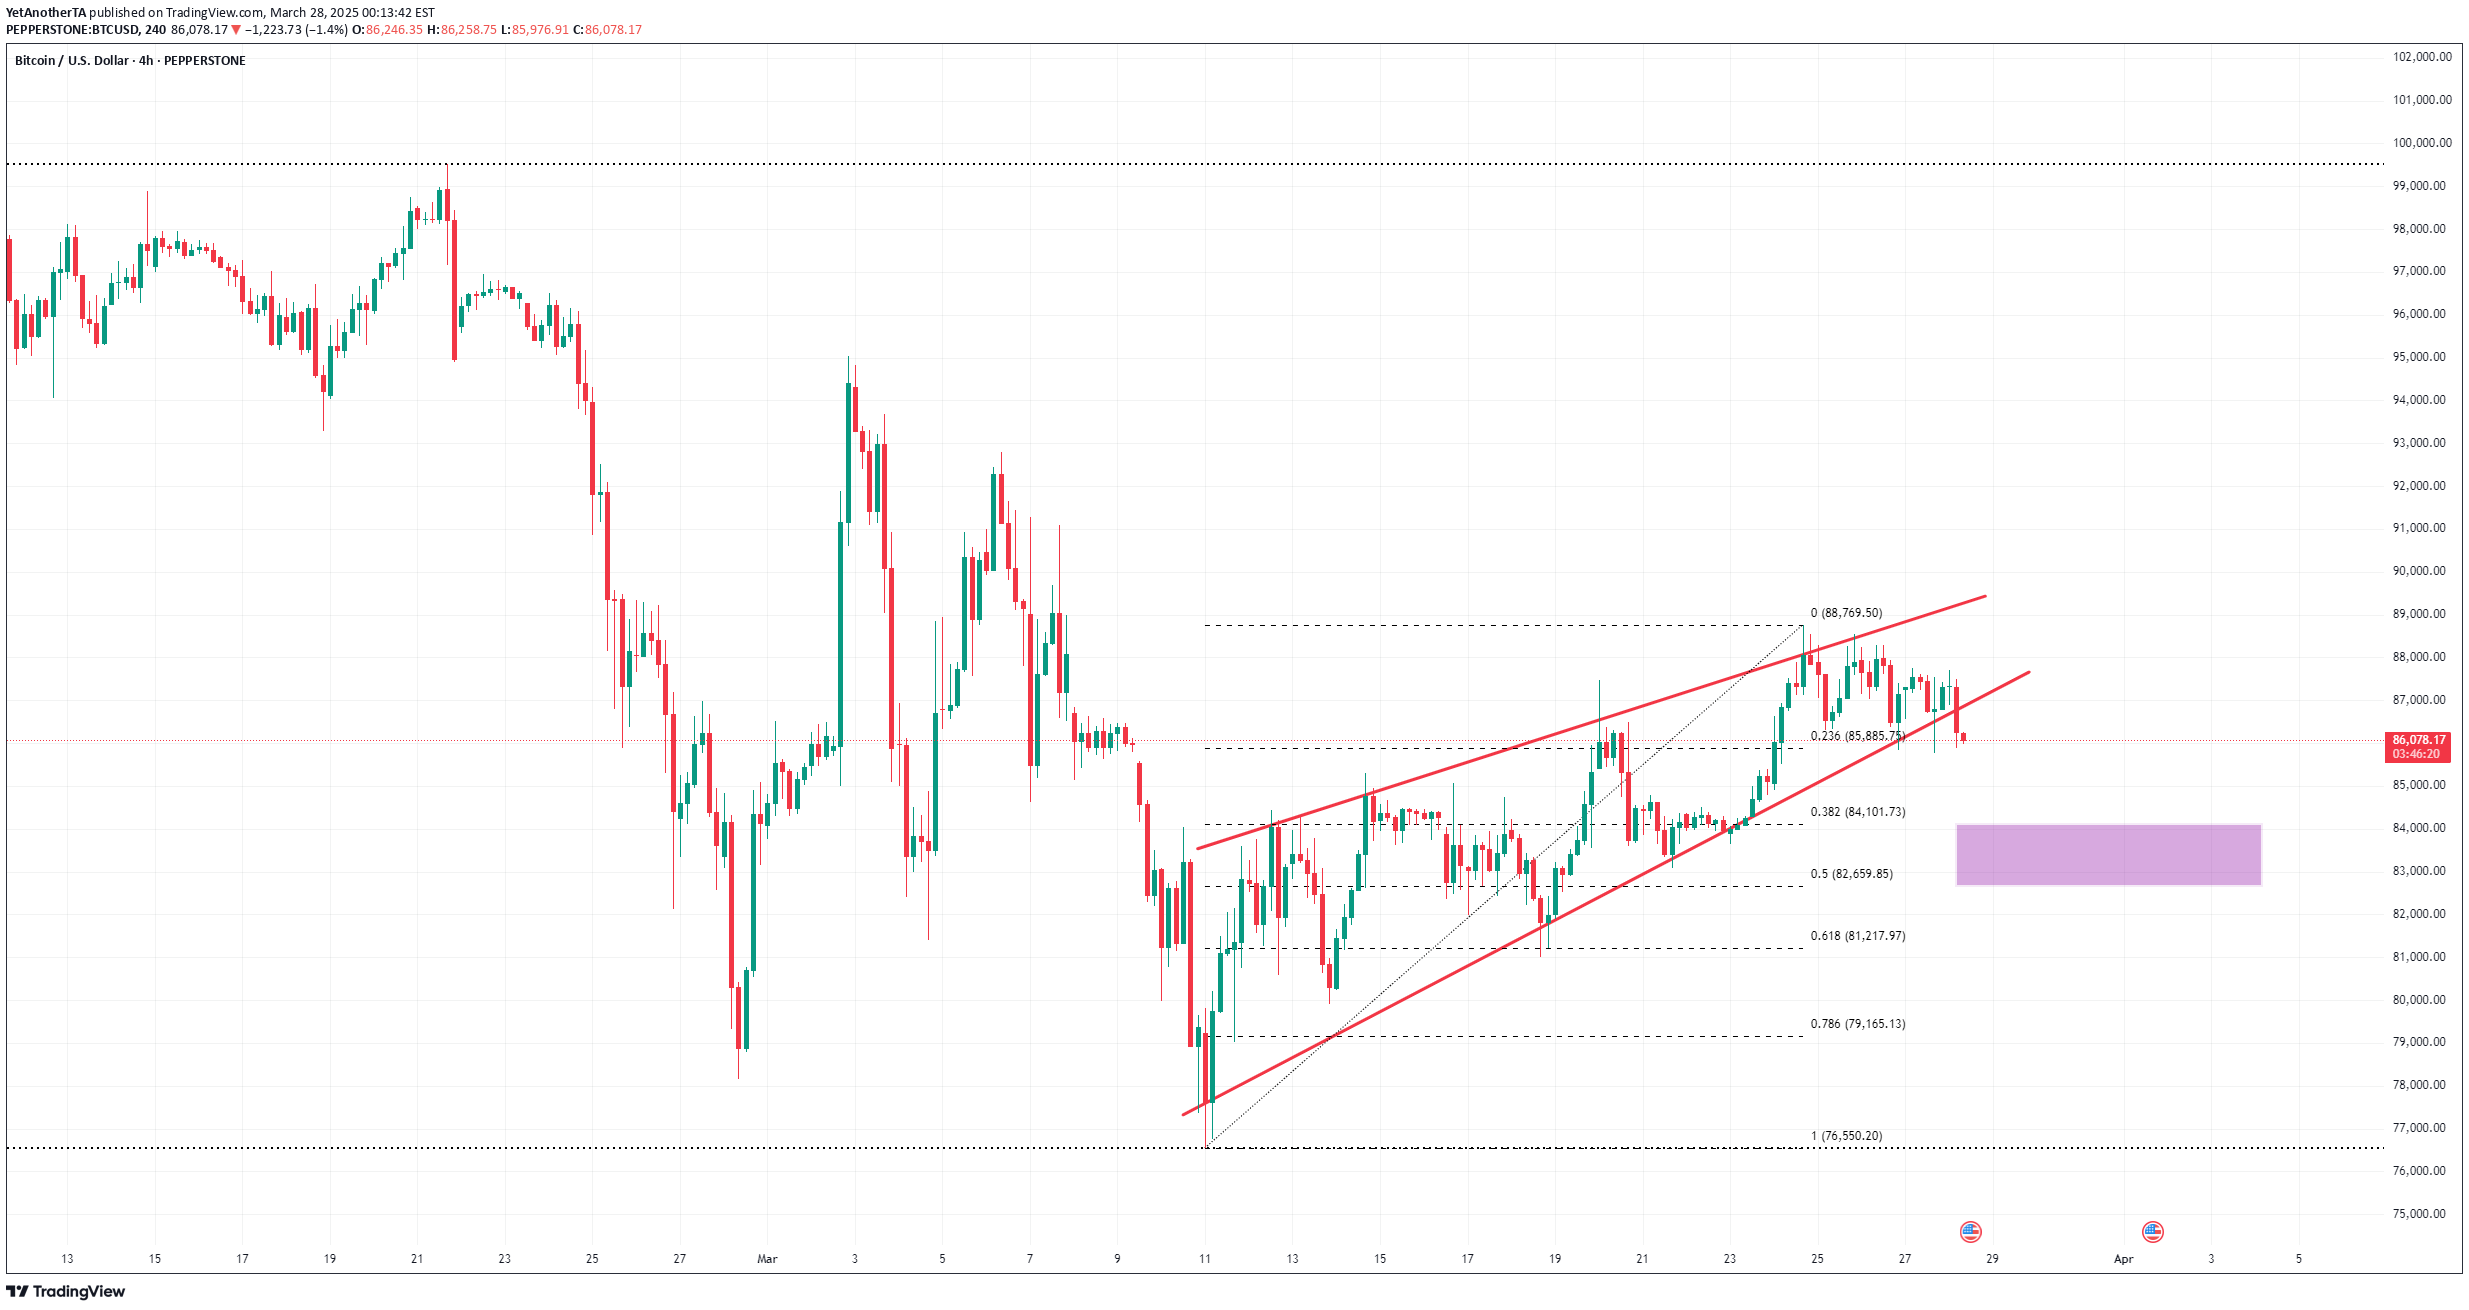
Let's face it. None of us want BTCUSD to go down. Isn't it?So whenever I see a potential/local bottom, I start looking for a bullish possibility. Few days back, #BTC dipped below 77K so I started counting waves from that point to see if there could be anything good happening here.On the 4H chart here, I can see a 5 wave move up (wave (i)) which could be described as a leading diagonal followed by a a-b-c down in wave (ii). The next move up (supposedly wave (iii)) seem to be looking fine so far. I can easily count 5 wave impulse in it by drilling it down to 1H chart. Note that, this would be just i of (iii). SO far so good.Disclaimer: Note that this is something we all elliott wave chartists do when we see a bottom to assess if a new trend could be starting. This is just one (bullish) alternative that I am exploring. There are bearish alternatives as well.
YetAnotherTA
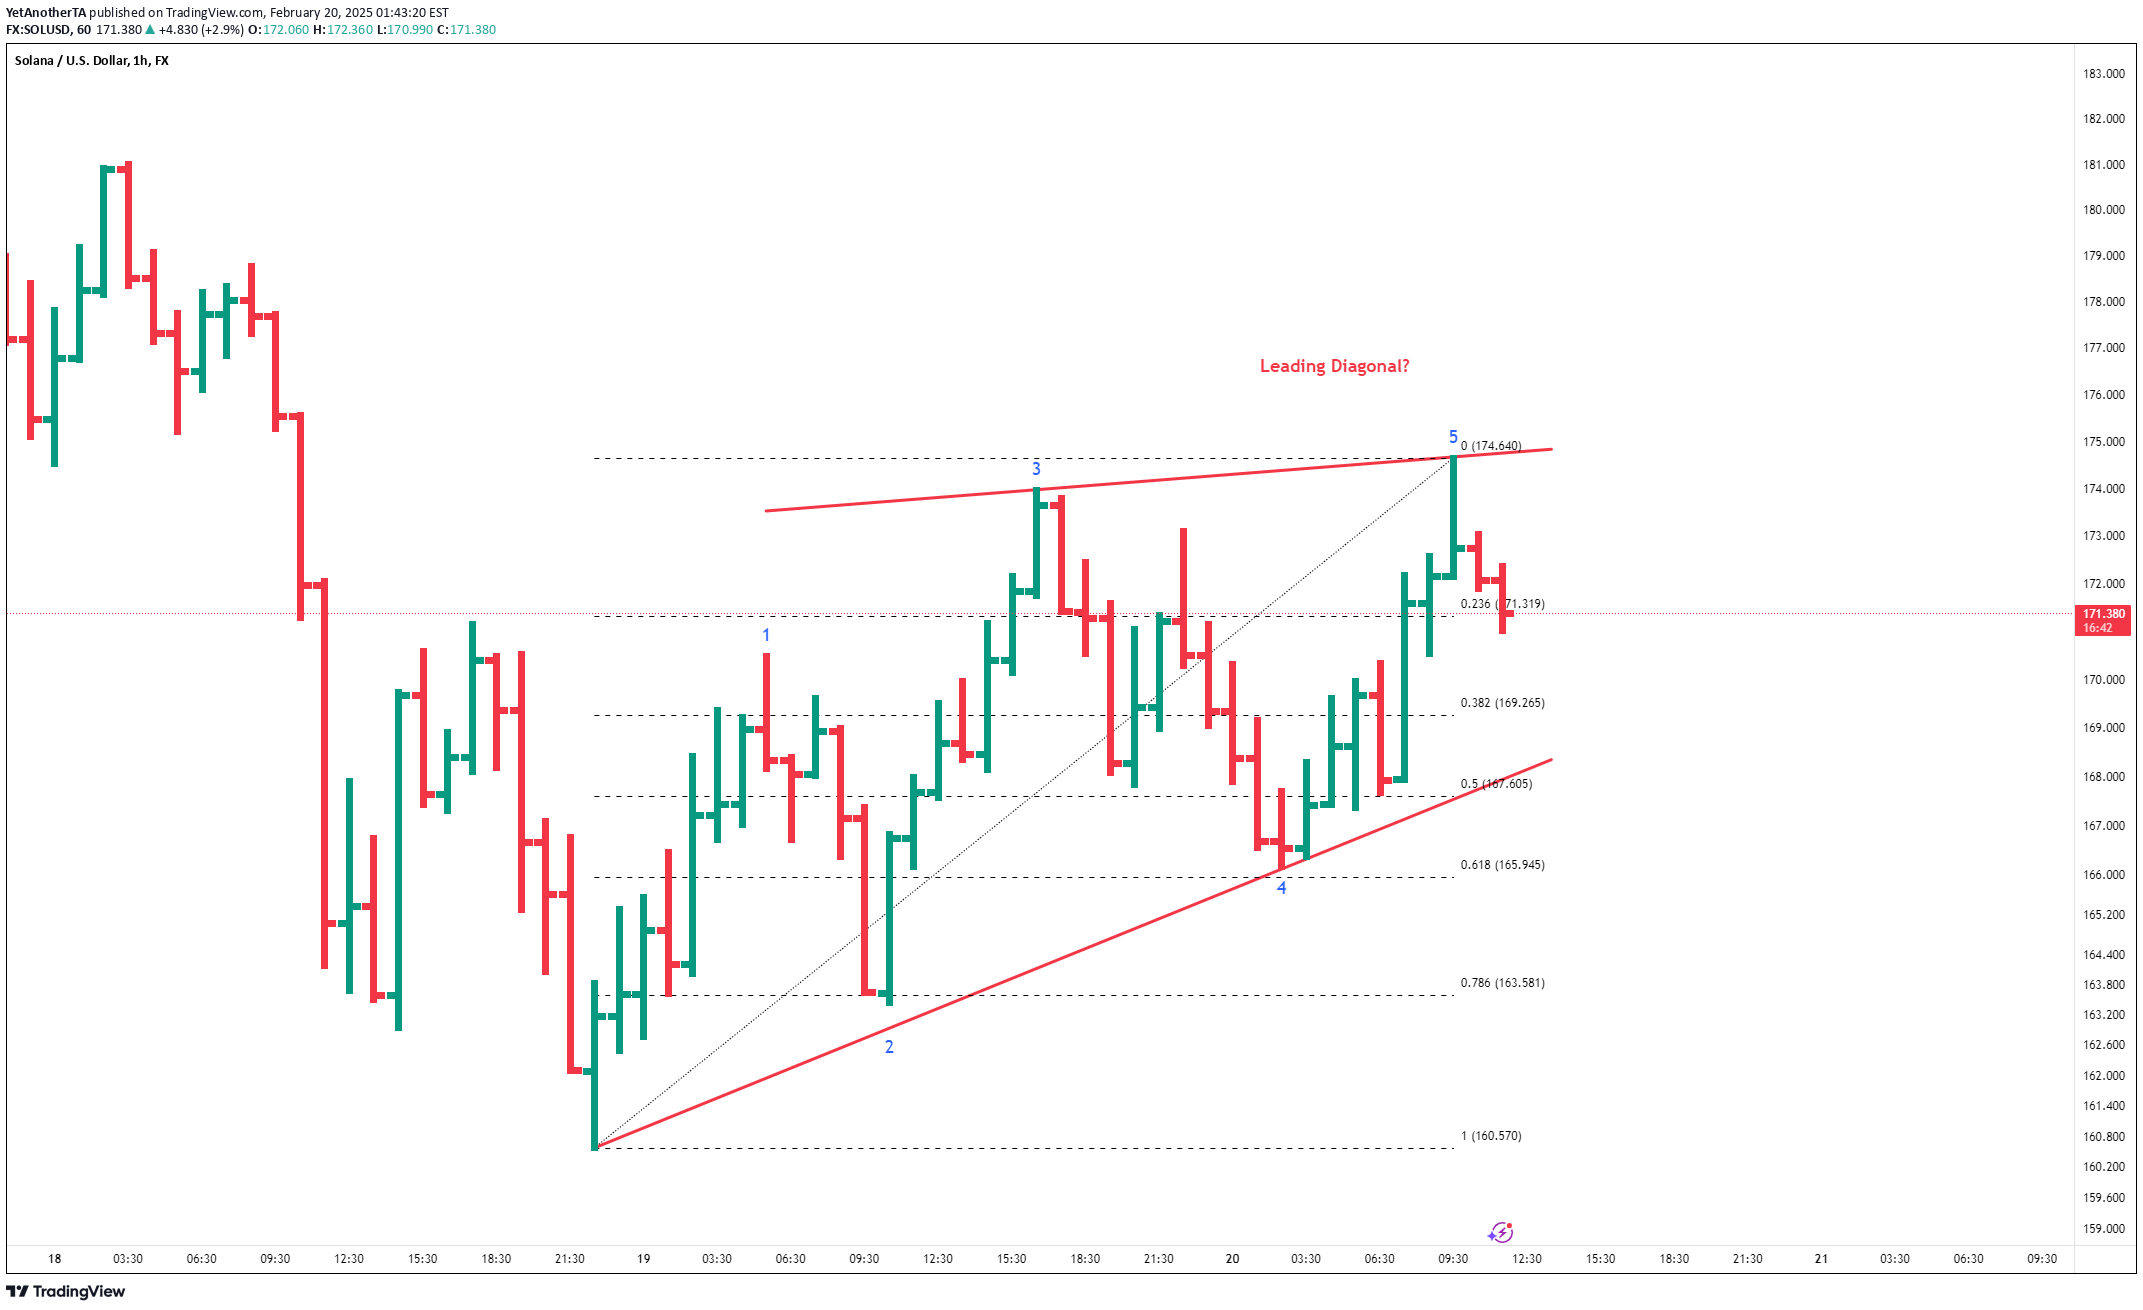
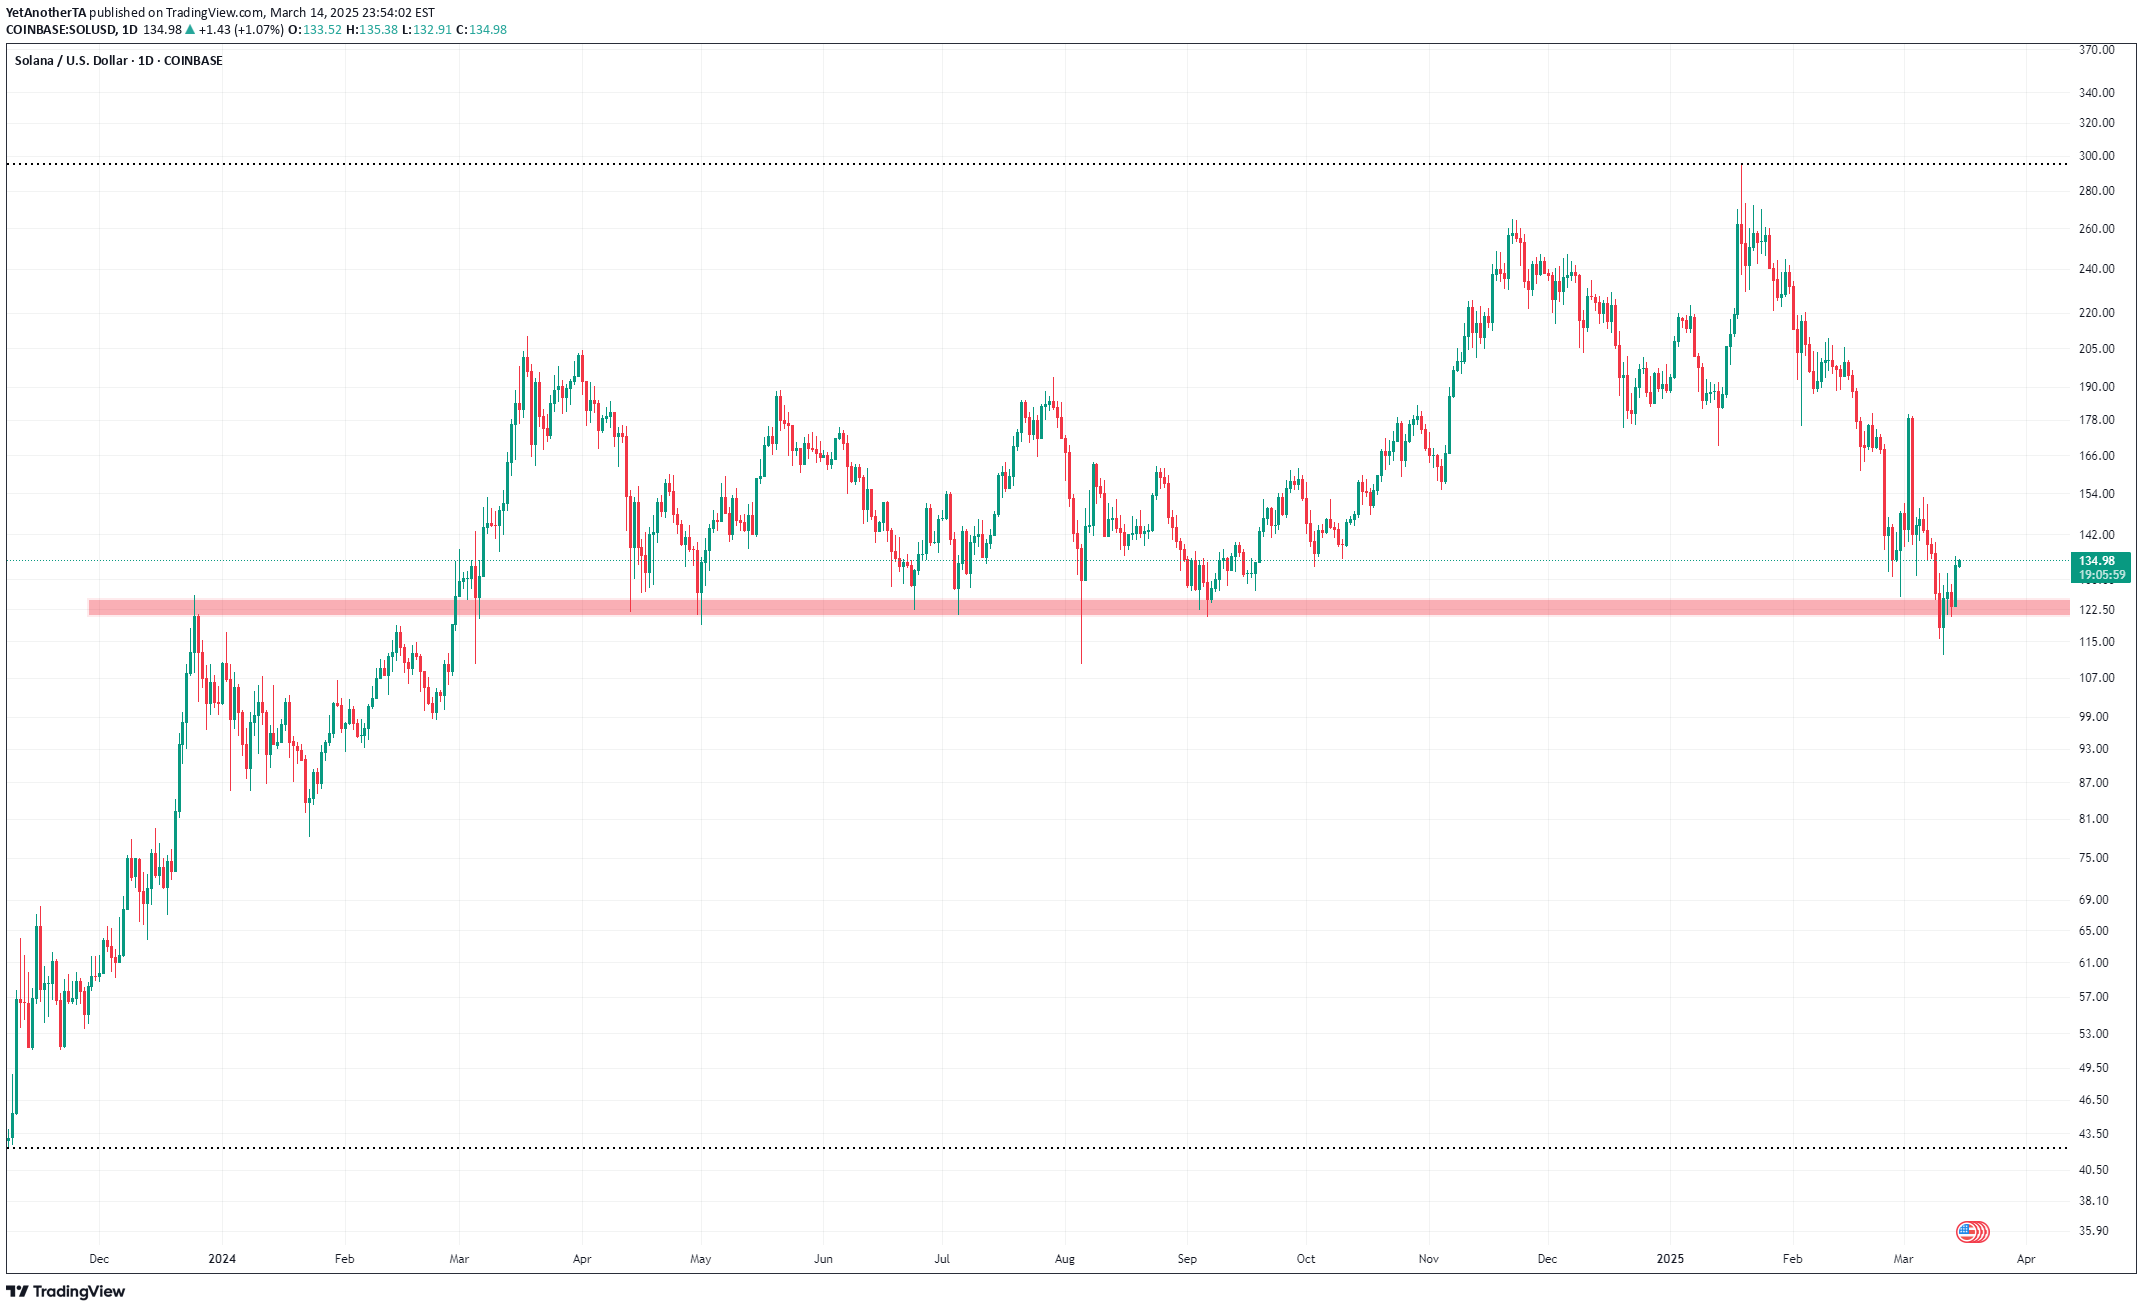
SOLUSD has been a nightmare and has fell significantly in past few days, much more than #BTC and #ETH relatively.But I can see a potential leading diagonal (3-3-3-3-3) rise. It the retracement of it holds above/around 61.8% which also happens to be the wave 4 low (165.945) then the next leg up should start which would give more insight into whether this is really an impulse up in progress or just another corrective leg.
Disclaimer
Any content and materials included in Sahmeto's website and official communication channels are a compilation of personal opinions and analyses and are not binding. They do not constitute any recommendation for buying, selling, entering or exiting the stock market and cryptocurrency market. Also, all news and analyses included in the website and channels are merely republished information from official and unofficial domestic and foreign sources, and it is obvious that users of the said content are responsible for following up and ensuring the authenticity and accuracy of the materials. Therefore, while disclaiming responsibility, it is declared that the responsibility for any decision-making, action, and potential profit and loss in the capital market and cryptocurrency market lies with the trader.