
Xanrox
@t_Xanrox

What symbols does the trader recommend buying?
Purchase History
پیام های تریدر
Filter
Xanrox
Bitcoin - Soon pump to 98k! But sell here, because...

Bitcoin is temporarily bullish, and from a technical point of view, we can expect 98,439 USD in the short term. There are many reasons behind this movement, the first is that Bitcoin is forming a bigger bearish flag that is well visible on the daily chart. This is not the ultimate bottom on Bitcoin - I believe we are going to see levels around 60k later this year! In the short term Bitcoin is forming an ascending parallel channel projection or a bearish flag, so if the price hits the upward trendline, that's a good time to open a short position or take profit on your long position. After that we can go all the way down to the bottom of the channel and test the upward-sloping trendline at around 89k. Why 60k later this year? Please look at my previous posts, because the fundamentals are extremely negative for Bitcoin. I think all ETFs' early investors will get liquidated! Also, bitcoin halving cycles are bearish this year. So in short - take your profit below 98,439 USDT or open a short position below 98,439 USDT because this is a very significant level and point of interest. Write a comment with your altcoin + hit the like button, and I will make an analysis for you in response. Thank you, and I wish you successful trades!
Xanrox
Bitcoin - Soon pump to 98k! But sell here, because...

Bitcoin is temporarily bullish, and from a technical point of view, we can expect 98,439 USD in the short term. There are many reasons behind this movement, the first is that Bitcoin is forming a bigger bearish flag that is well visible on the daily chart. This is not the ultimate bottom on Bitcoin - I believe we are going to see levels around 60k later this year! In the short term Bitcoin is forming an ascending parallel channel projection or a bearish flag, so if the price hits the upward trendline, that's a good time to open a short position or take profit on your long position. After that we can go all the way down to the bottom of the channel and test the upward-sloping trendline at around 89k. Why 60k later this year? Please look at my previous posts, because the fundamentals are extremely negative for Bitcoin. I think all ETFs' early investors will get liquidated! Also, bitcoin halving cycles are bearish this year. So in short - take your profit below 98,439 USDT or open a short position below 98,439 USDT because this is a very significant level and point of interest. Write a comment with your altcoin + hit the like button, and I will make an analysis for you in response. Trading is not hard if you have a good coach! This is not a trade setup, as there is no stop-loss or profit target. I share my trades privately. Thank you, and I wish you successful trades!
Xanrox
Bitcoin - Soon pump to 98k! But sell here, because...

Welcome to the matrix in 2026! If you still think Bitcoin is a great technology, please watch this video . This video is getting popular on YouTube. But we are here in crypto just to make money, it's not about technology! If someone tells you that they are investing in crypto because of technology, not because of money, they are lying to you. Bitcoin is temporarily bullish, and from a technical point of view, we can expect 98,439 USD in the short term. There are many reasons behind this movement, the first is that Bitcoin is forming a bigger bearish flag that is well visible on the daily chart. This is not the ultimate bottom on Bitcoin - I believe we are going to see levels around 60k later this year! In the short term Bitcoin is forming an ascending parallel channel projection or a bearish flag, so if the price hits the upward trendline, that's a good time to open a short position or take profit on your long position. After that we can go all the way down to the bottom of the channel and test the upward-sloping trendline at around 89k. Why 60k later this year? Please look at my previous posts, because the fundamentals are extremely negative for Bitcoin. I think all ETFs' early investors will get liquidated! Also, bitcoin halving cycles are bearish this year. So in short - take your profit below 98,439 USDT or open a short position below 98,439 USDT because this is a very significant level and point of interest. Write a comment with your altcoin + hit the like button, and I will make an analysis for you in response. Trading is not hard if you have a good coach! This is not a trade setup, as there is no stop-loss or profit target. I share my trades privately. Thank you, and I wish you successful trades!
Xanrox
Bitcoin will die! Silver pumped +200% - GOLD (2026 prediction)

Bitcoin will die in 2026, and a lot of traders will get liquidated! Silver pumped by 200% this year, gold by 75%, and the US stock index Nasdaq by 61%, while Bitcoin dropped from 126k to 80k in 2025. I will tell you exactly why in this analysis! First, let's take a look at Bitcoin and the main reason behind this drop. If you started investing in Bitcoin, I have to warn you because the total market capitalization is already extremely big. In other words, Bitcoin will never go up exponentially as it did in previous years! You are late to the Ponzi, so forget about 10x or 50x profit. The price of Bitcoin, the code of Bitcoin, and the future of Bitcoin are completely controlled by the banks and huge institutions. Crypto technology is not new in the galaxy, it has been brought to planet Earth by aliens. So why is Bitcoin going down? As an investor, you should probably know that Bitcoin experiences halving events +- every 4 years. From a technical point of view, we have 3 years of growth and 1 year of sharp decline. We already had the 3-year growth cycle (2022-2025), so we can expect a massive drop in 2026. How low can Bitcoin go? My prediction is 40k to 60k. What about silver and gold? Why are these precious metals going up like crazy? Mostly because the price has been kept very low for a very long time. The banks did their best to keep the price low. Over 99% of gold and silver is in a virtual form or in the form of contracts. So they artificially decreased the price of these metals for their own benefits. There are still people who think that gold, silver, and Bitcoin are enemies to the traditional banking system and banks in general. That is 100% false; in fact, it's the opposite - they love them. Banks make money mostly on providing services, such as keeping your money safe, or loans or payments... It really doesn't matter if they give you a loan in gold or bitcoin fiat dollars as long as they make money. Bitcoin is not a threat to the financial system. I think banks would love to loan you 1 Bitcoin so you can pay them 2 BTC back. Sounds like a great deal, doesn't it? In fact, with Bitcoin, every transaction is monitored, and anonymous payments are not possible anymore. If you can't make money on Bitcoin, you can still make money on some altcoins (hidden gems). Write a comment with your altcoin + hit the like button, and I will make an analysis for you in response. Trading is not hard if you have a good coach! This is not a trade setup, as there is no stop-loss or profit target. I share my trades privately. Thank you, and I wish you successful trades!I am bearish on Bitcoin, while bullish on silver and gold. Expect a continuation of the bear market in 2026.Happy New Year 2026! I wish you successful trades (if you read this).
Xanrox
Bitcoin - Channel no one talks about! (new Year's crash!)

Bitcoin's price and development (code) are completely controlled by banks and government. They already have a roadmap on Bitcoin price, so they know what the price will be in 2030. Bitcoin technology is great for total control because all transactions are public. How to profit from that? First of all, you have to identify the big players on the chart and trade with them. They want to make as much money as possible on the way up, so that's why they cannot push the price to the upside in a straight line - they create a lot of traps and patterns on the chart. When too many people are bullish, it's not worth it to them to send the price up, rather they push the price down in the short term and take all stop losses (your money is a stop loss). You are forced to sell, and guess who buys your order? Most likely the banks, because they love Bitcoin. What we see on the chart is a blue descending parallel channel. This channel is the current pattern that we play on Bitcoin in this timeframe. Because the price is inside the channel and near the trendline resistance, we cannot be bullish at this point. What traders must understand is that we sell a resistance and buy a support, not the opposite. Currently the price is in a sell zone around 90k - 91k at the top of the channel. There is still an unfilled FVG at 91k - 92k that acts as a strong resistance. January is ticking on the door, and we know that statistically January is one of the most bearish months for Bitcoin. Currently I do not see any reason to be bullish, so I have to stay bearish at this point. Write a comment with your altcoin + hit the like button, and I will make an analysis for you in response. Trading is not hard if you have a good coach! This is not a trade setup, as there is no stop-loss or profit target. I share my trades privately. Thank you, and I wish you successful trades!Bitcoin dropped from 91k to 86k, taking some profits here. Now waiting for 75k
Xanrox
Bitcoin - Bear flag, 74k confirmed! (warning, must see)
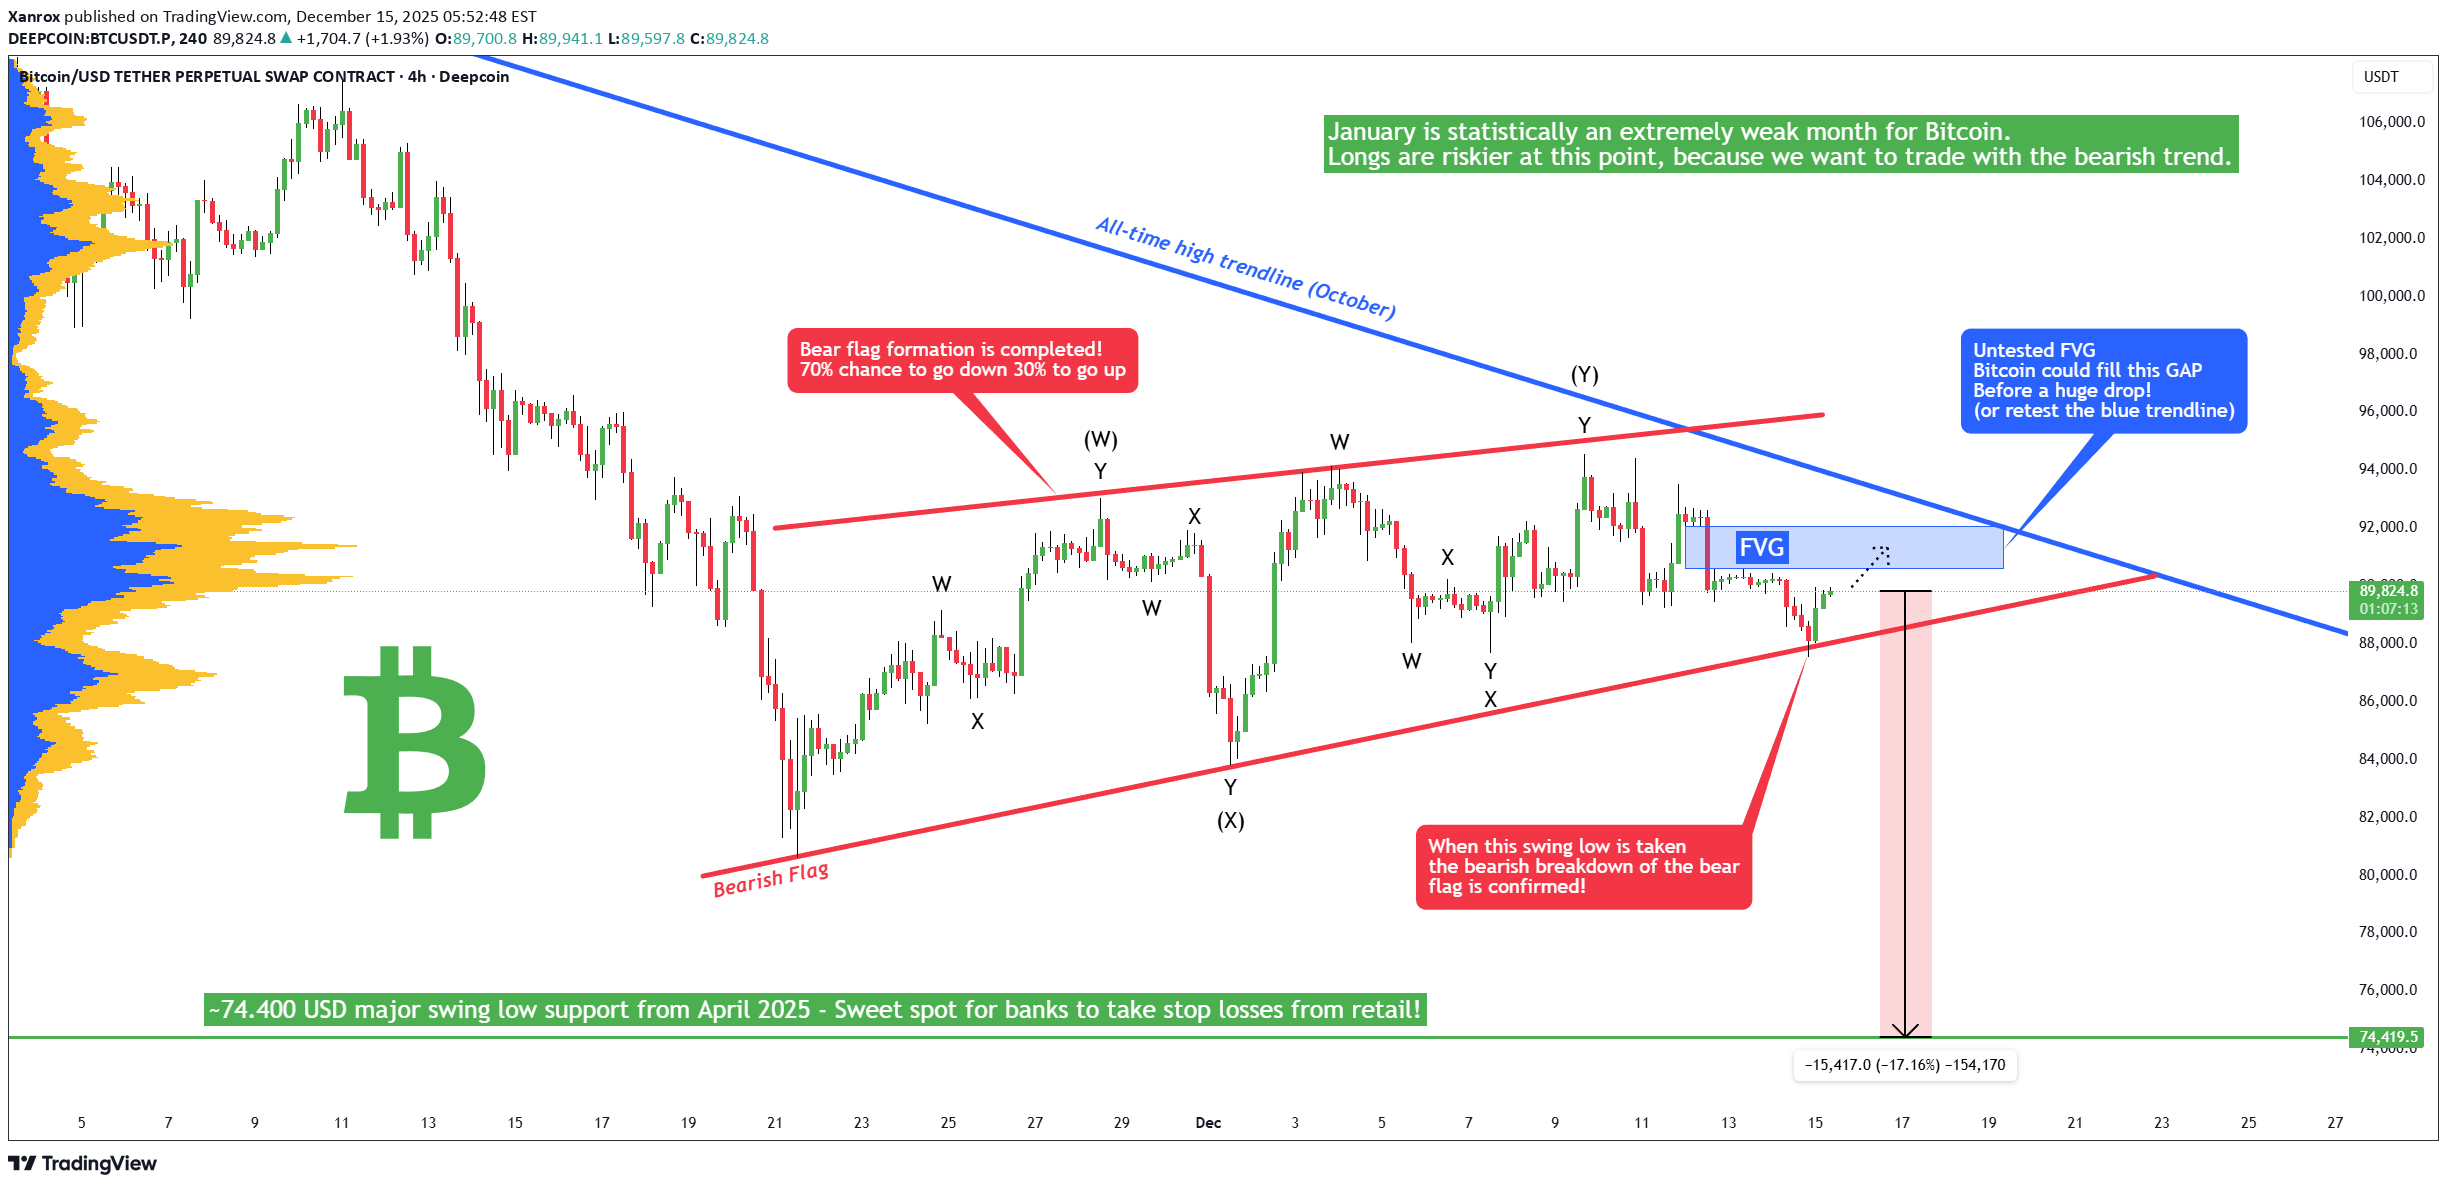
Bitcoin has just completed its bearish flag formation. What now? The probability of going down is now around 70%, while the probability of going up is only 30%. Many times we see a bullish breakout of a bear flag. How does it look? Something like that: We see that for a bullish breakout, the bulls need to completely go above the flag's resistance, which is much harder than simply going down, especially in a strong bear market, like in this Bitcoin's case. Bitcoin's price and development are completely controlled by the banks and huge institutions that control this planet. To make money, you have to identify their actions on the chart. On the chart we can also see a completely unfilled FVG (Fair Value GAP). Precisely between 90600 and 92060. There is a possibility for Bitcoin to partially or completely fill this GAP before starting the upcoming drop! Longs are riskier at this point, because we want to trade with the bearish trend. But if the price increases in the short term, we can have a much better entry point for our short position on futures. It's also a possibility to retest the long-term blue trendline from the all-time high. From the Elliott Wave point of view, this bear flag seems to be a complex corrective pattern. To be honest, I don't see any signs of strength, such as an impulse wave or a leading diagonal wedge pattern. I am currently bearish on Bitcoin, and I expect a pretty significant drop in the coming weeks! Especially January is statistically an extremely weak month for Bitcoin. Write a comment with your altcoin + hit the like button, and I will make an analysis for you in response. Trading is not hard if you have a good coach! This is not a trade setup, as there is no stop-loss or profit target. I share my trades privately. Thank you, and I wish you successful trades!The bearish flag is breaking down! What now? What we see on the chart is a retest of the bear flag, which is an opportunity to sell or enter a short position.Short is active, I believe we are going to go down sooner or later.The price action looks very bearish, the trade is in profit so far. You can take a part of your profit here, but the rest must wait for the main profit target.
Xanrox
Bitcoin - Sell this upcoming pump! New Bear Flag - Target 74k!
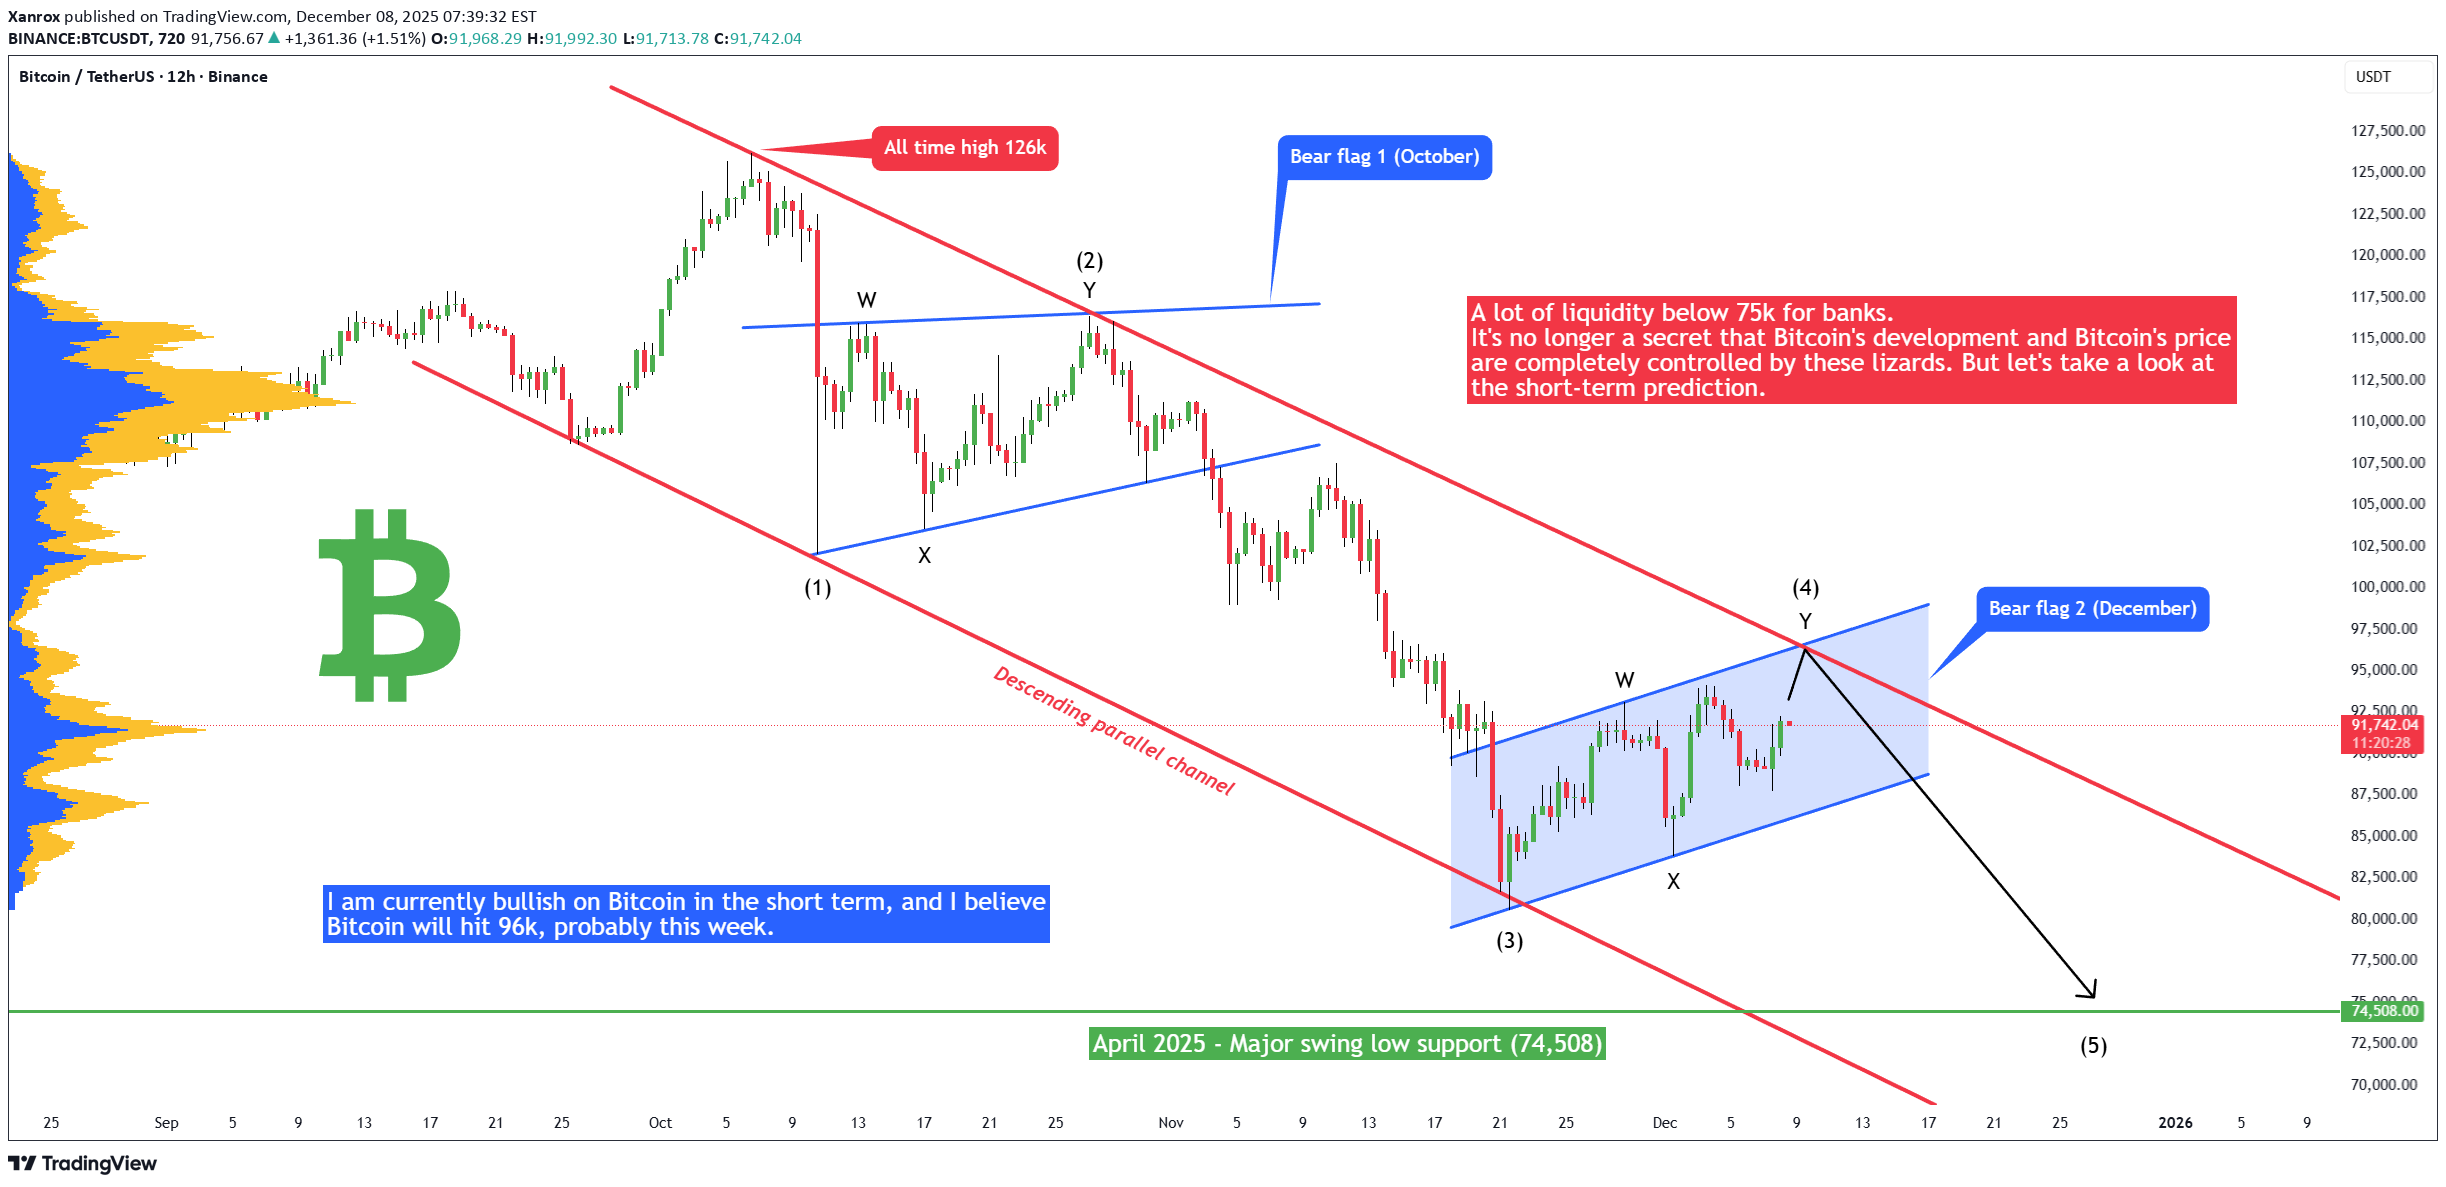
I am currently bullish on Bitcoin in the short term, and I believe Bitcoin will hit 96k, probably this week. The current price is around 91k, so this is definitely a good opportunity to sell or open a short position at 96k on futures because later this month/in January Bitcoin will most likely continue in a downtrend and hit 74k! 74k (74,508) is a significant swing low from April 2024. There is no doubt that a lot of retail traders have their stop losses placed exactly below this swing low. This acts like a strong magnet for huge institutions, hedge funds, and big banks (market makers). It's no longer a secret that Bitcoin's development and Bitcoin's price are completely controlled by these lizards. But let's take a look at the short-term prediction. What we can see on the daily chart or on the 12h chart is a bear flag formation. This bear flag is so nice and almost textbook perfect! Inside the bear flag we have a WXY corrective pattern (3x ABC or 3x WXY). I think that this is a strong indication that the downtrend we see from the all-time high (126k) will likely continue in the next weeks. Write a comment with your altcoin + hit the like button, and I will make an analysis for you in response. Trading is not hard if you have a good coach! This is not a trade setup, as there is no stop-loss or profit target. I share my trades privately. Thank you, and I wish you successful trades!The pump is in progress as I expected, we still didn't hit my target of 96k. Then at 96k, open a short position.Bitcoin is still bullish, it hit my first profit target, but then dropped back to yesterday's low.
Xanrox
ریزش بیت کوین فیک بود؟ بازگشت به ۹۶ هزار دلار در دسامبر قطعی است!
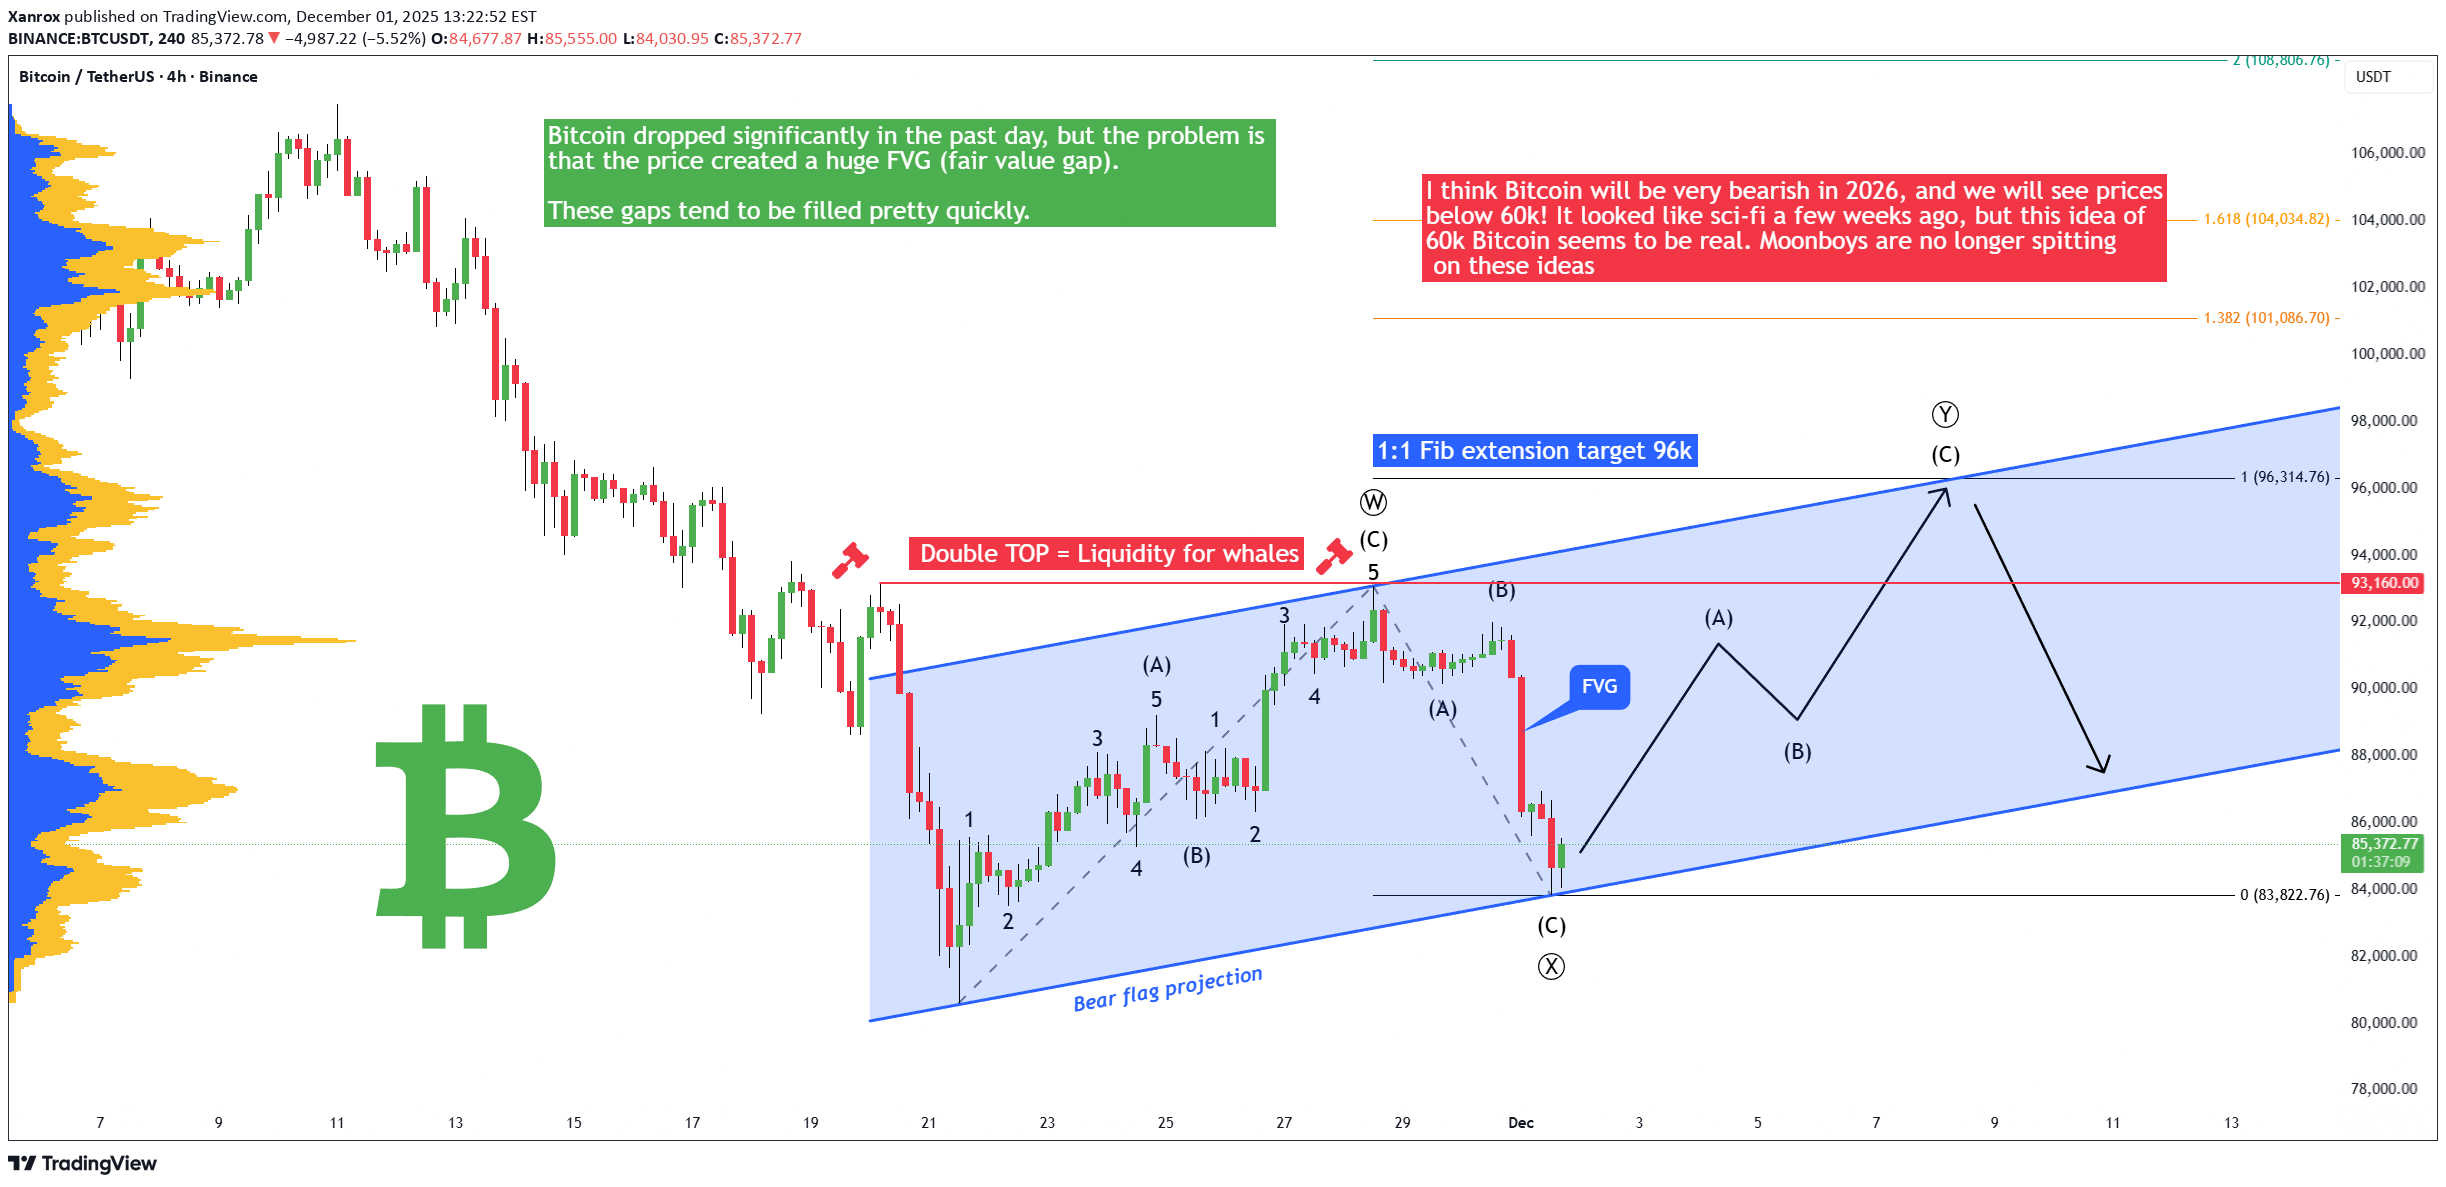
Bitcoin has dropped like crazy in the past day because we are in a strong bear market, but I think we should see a December rally! I have been warning you against these big crashes pretty much since Summer 2025. I knew it was going to happen - the question was not if but when. The price created a huge FVG, and this gap is very unfilled. Pretty much it looks like a huge manipulation from big players (they sent the price down significantly to liquidate high-leverage traders on futures). You know that the Bitcoin market is completely manipulated by the Fed, banks, and huge institutions. They even have a roadmap, and they know what the price of Bitcoin will be in 2030 and 2040. I know everyone hates the Fed and banks, but this is how it is. We trade it, so you have to be able to predict their movements and trade with their plan. I think Bitcoin will be very bearish in 2026, and we will see prices below 60k! It looked like sci-fi a few weeks ago, but this idea of 60k Bitcoin seems to be real. Moonboys are no longer spitting on these ideas, and some people are calling for 30k or 40k Bitcoin. Let me know in the comment section your prediction. I am curious! You have to understand that there is a lot of manipulation going on in this world. We live in a physical world that has been created recently. The original astral world is where the magic happens. And yes, the physical world is a scam and fraud. The sooner you understand that after you're dead, you wake up in the original astral world, the better for you. Currently, I am pretty bullish, I think we will see a bullish rally sooner rather than later! Write a comment with your altcoin + hit the like button, and I will make an analysis for you in response. Trading is not hard if you have a good coach! This is not a trade setup, as there is no stop-loss or profit target. I share my trades privately. Thank you, and I wish you successful trades!Bitcoin started a pump, this is another great prediction! But the low when everyone is scared... If you missed it, you can wait for a small pullback. I am pretty confident that Bitcoin will hit 96k pretty soon.Great trade again! The market went up and soon 96k!
Xanrox
بیت کوین تا 2026 به 66 هزار دلار میرسد؟ پیشبینی مهم کوتاهمدت برای پامپ ۹۷ هزار دلاری!
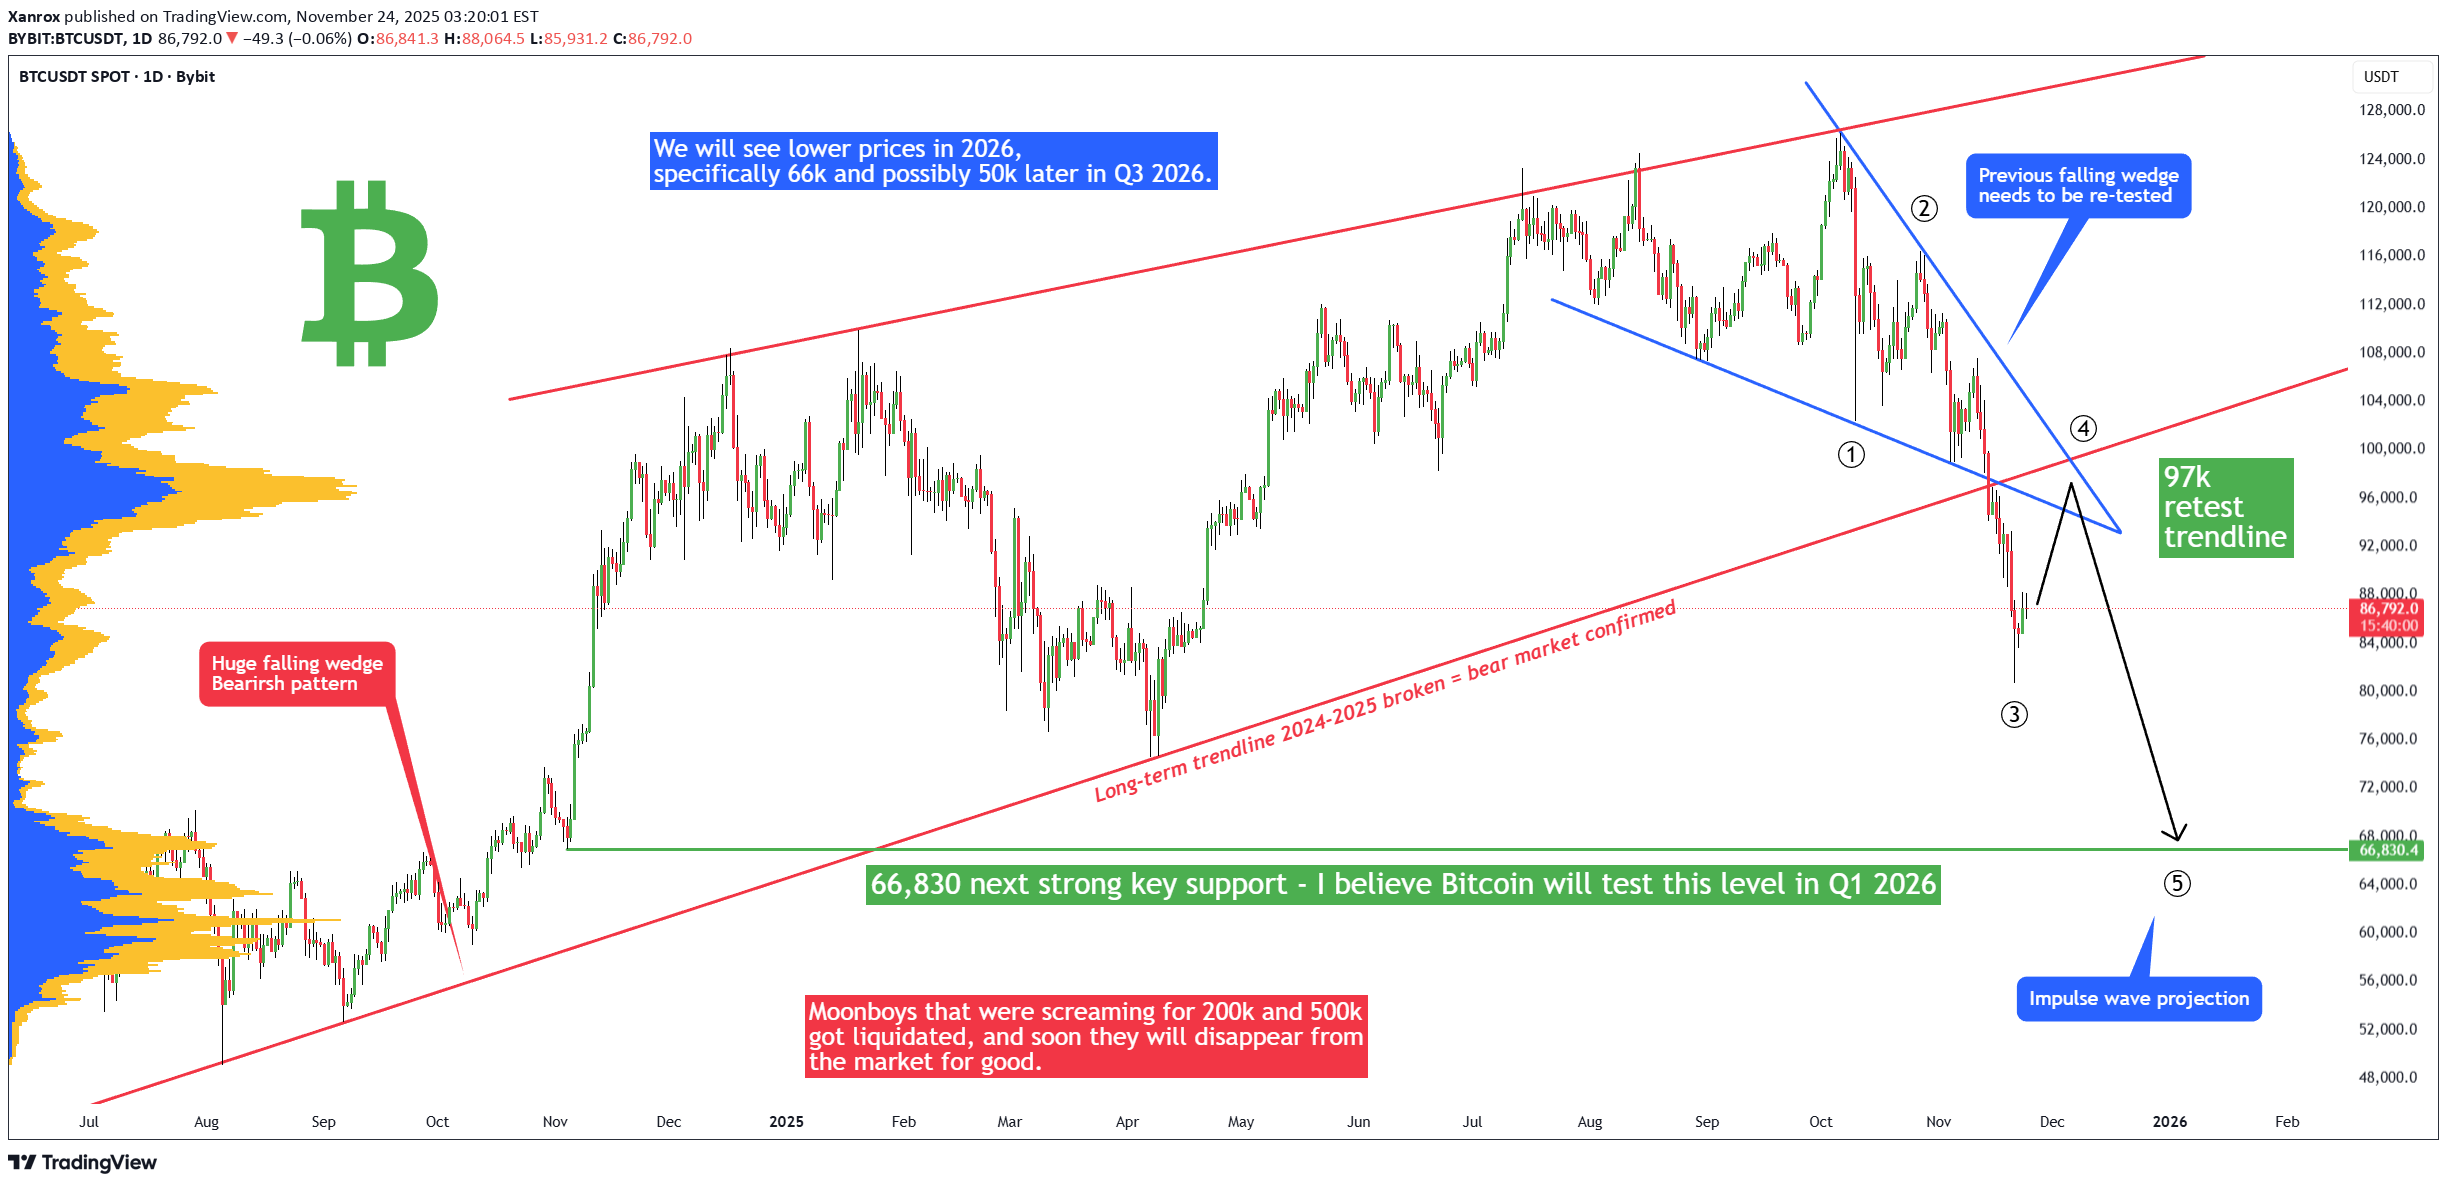
Bitcoin has been going down drastically, as I expected many, many weeks in advance. But this is not the end of the crash! We will see lower prices in 2026, specifically 66k and possibly 50k later in Q3 2026. This is my long-term vision, but in the short term I think Bitcoin should go up to retest the previous long-term trendline and the previous falling wedge pattern at 97k! Usually after a breakout/breakdown, we want to see a retest. These retests are very important because they give us a chance to sell Bitcoin at a better price and also to short Bitcoin on the futures market. Bitcoin did some pretty crazy movements in the past weeks, regardless of the seasonality patterns. Statistically Bitcoin is extremely strong in October and November—but this time it was the opposite. Even though seasonality patterns are helpful, you always need to look for more indicators and fundamentals. Moonboys that were screaming for 200k and 500k got liquidated, and soon they will disappear from the market for good. I have been trading for almost 10 years, and I have experienced many crypto crashes, and the moonboys are always here at the top. When I was bearish at 120k, everyone was screaming in the comment section and even spitting on my bearish predictions. So my plan for the next Bitcoin movements is as follows: First, Bitcoin should retest the 97k level (this will take some time). After that we should see another big leg to the downside to 66k. Write a comment with your altcoin + hit the like button, and I will make an analysis for you in response. Trading is not hard if you have a good coach! This is not a trade setup, as there is no stop-loss or profit target. I share my trades privately. Thank you, and I wish you successful trades!I think we are going to hit 97k sooner or later, but in the short term we can still go down a bit. But 97k will be tested!Great! The price has been going up as expected. And you know that the FED will print even more money to destroy our economy even more. It's no secret that 99% of poeple hate FED and central banks.
Xanrox
بیت کوین زیر 91 هزار دلار: منطقه حمایتی حیاتی و جهش بزرگ در راه!
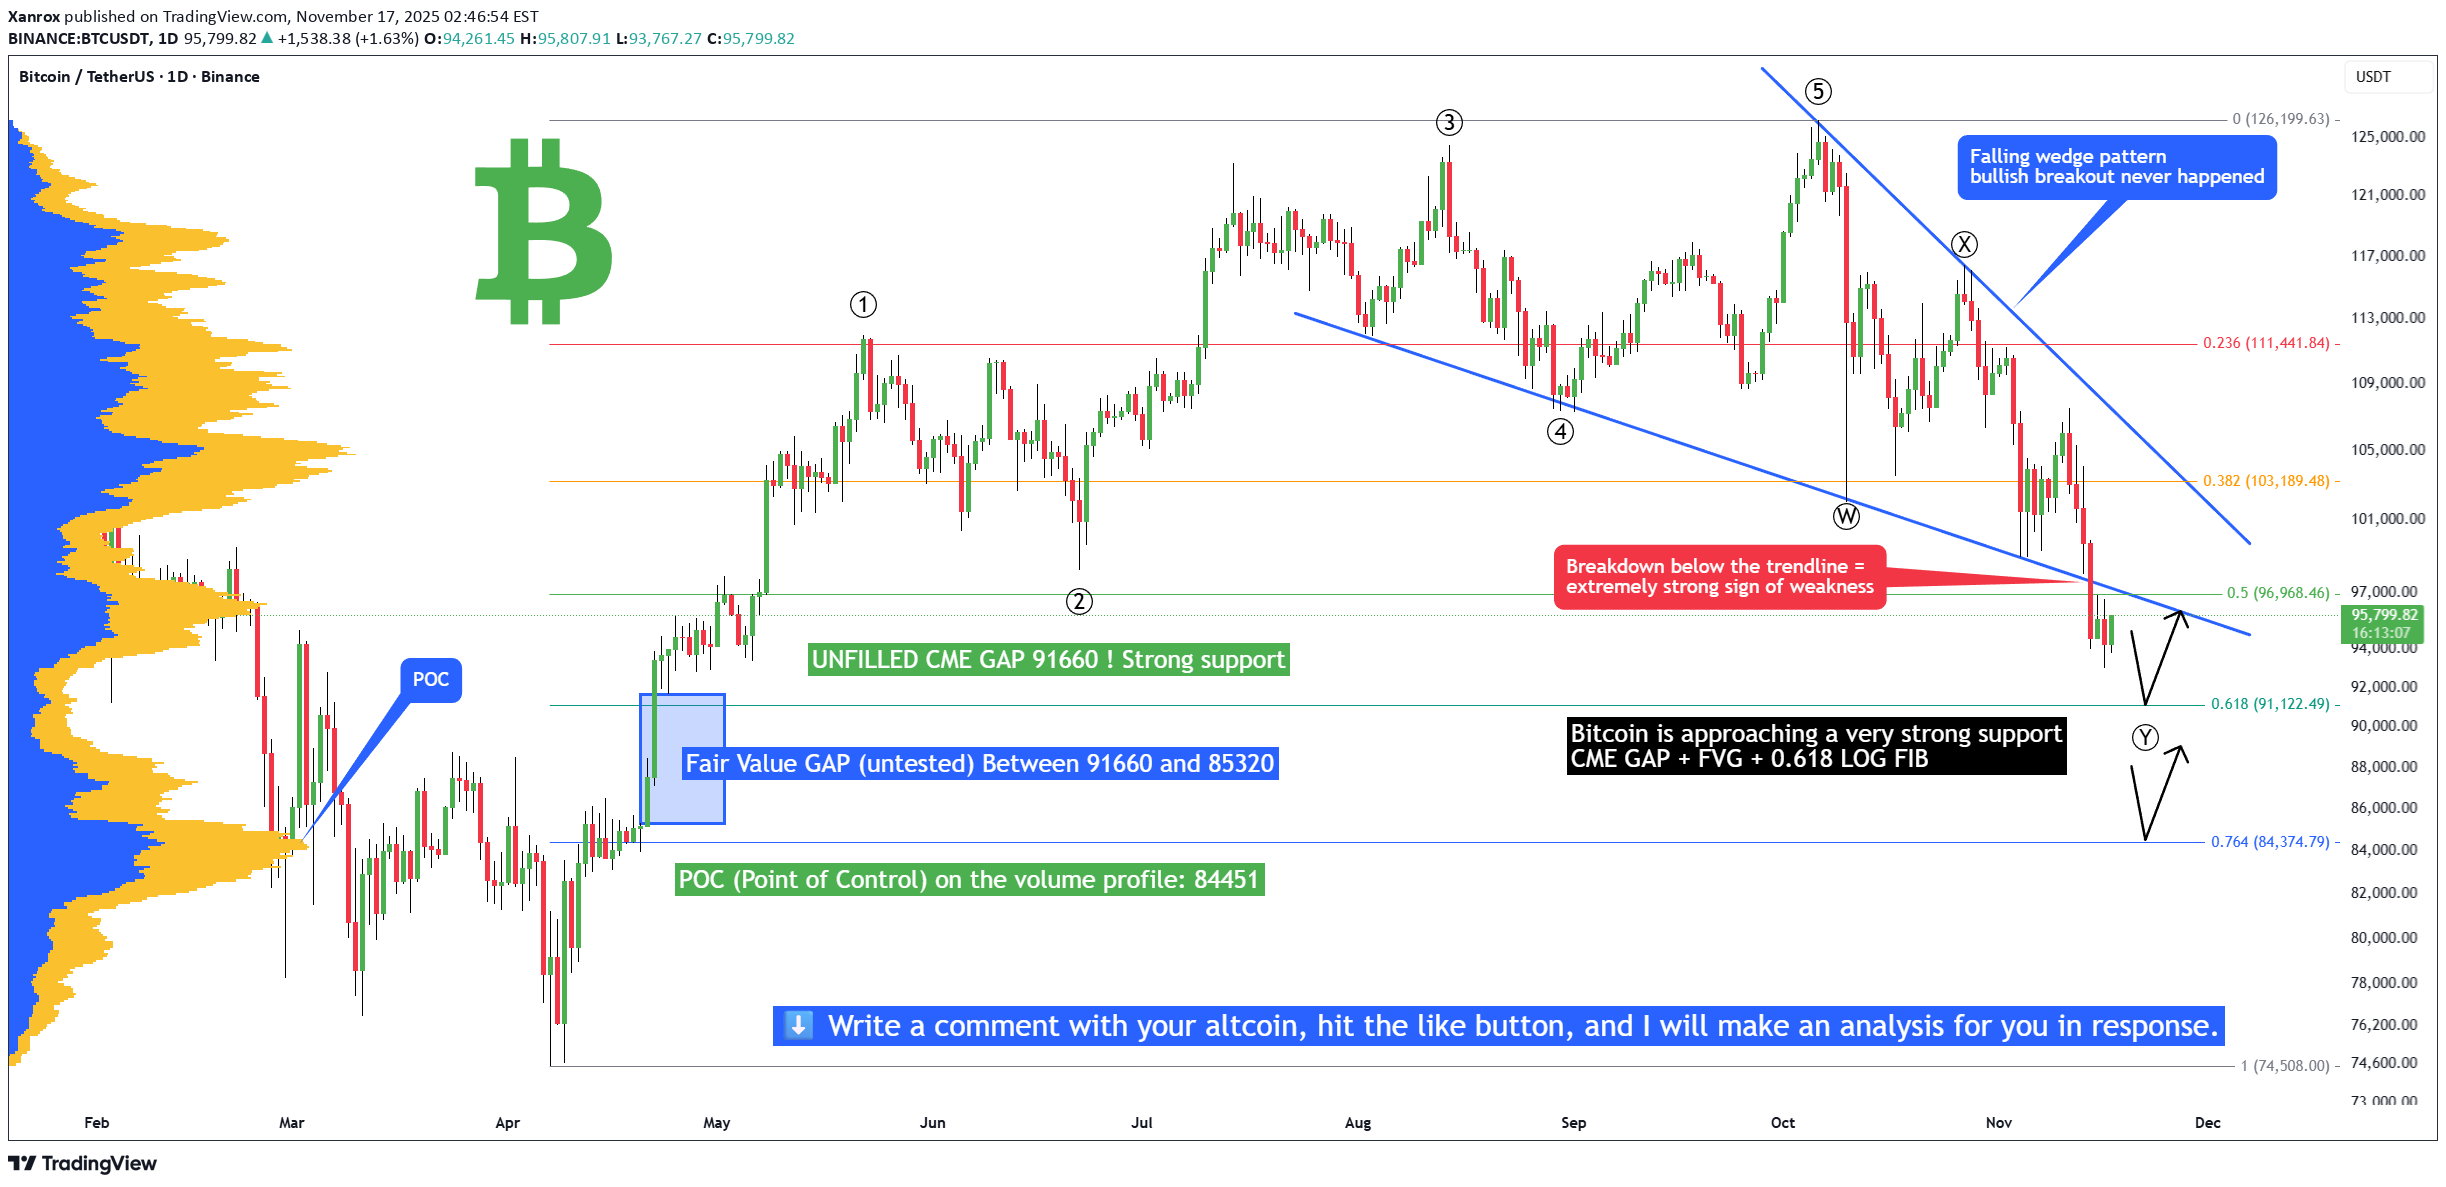
Bitcoin is in a critical situation because the price broke the falling wedge, and instead of a bullish breakout, we see a bearish breakdown! I expected this price action, please look at my previous posts. The falling wedge in general is a bullish pattern, but in bear markets they are bearish patterns. But soon Bitcoin will hit a key support level, and this is great hopium for the bulls! The key support level is 91k! Why? We have a very strong confluence to buy Bitcoin here, at least for a short-term bounce. First of all, there is an unfilled CME futures GAP on the daily chart. Second, there is an unfilled FVG (Fair Value Gap) between 91660 and 85320 on Binance. The next is the Fibonacci 0.618 FIB level on the LOG scale. This fibo is exactly at 91122. What is the plan? Now you know that there is very strong support at 91k, and that's a good upcoming trade! What you want to do is to put your limit order here and wait for the price to come to you and then take profit a little bit higher! Where to take profit? Don't forget to follow my TradingView account because I will inform you about a good level to sell/short BTC. What to do now? I would wait for Bitcoin to come to 91k, then I expect a bounce to higher levels! I think we will see a pretty nice pump in November/December, but be patient and wait for 91k. Write a comment with your altcoin + hit the like button, and I will make an analysis for you in response. Trading is not hard if you have a good coach! This is not a trade setup, as there is no stop-loss or profit target. I share my trades privately. Thank you, and I wish you successful trades!Bitcoin went down as expected and hit our entry point.Bitcoin and altcoins started pumping; we should see a big pump in the next hours and days, as expected. I also expect an alt season, because the BTC.D (BTCDOMUSDT.P) chart looks bearish, I see a bearish pattern.The profit target for my short position has been reached, so this was success. Now we are in a long position, expect a rise!
Disclaimer
Any content and materials included in Sahmeto's website and official communication channels are a compilation of personal opinions and analyses and are not binding. They do not constitute any recommendation for buying, selling, entering or exiting the stock market and cryptocurrency market. Also, all news and analyses included in the website and channels are merely republished information from official and unofficial domestic and foreign sources, and it is obvious that users of the said content are responsible for following up and ensuring the authenticity and accuracy of the materials. Therefore, while disclaiming responsibility, it is declared that the responsibility for any decision-making, action, and potential profit and loss in the capital market and cryptocurrency market lies with the trader.