
XBTFX
@t_XBTFX

What symbols does the trader recommend buying?
Purchase History
پیام های تریدر
Filter
Signal Type
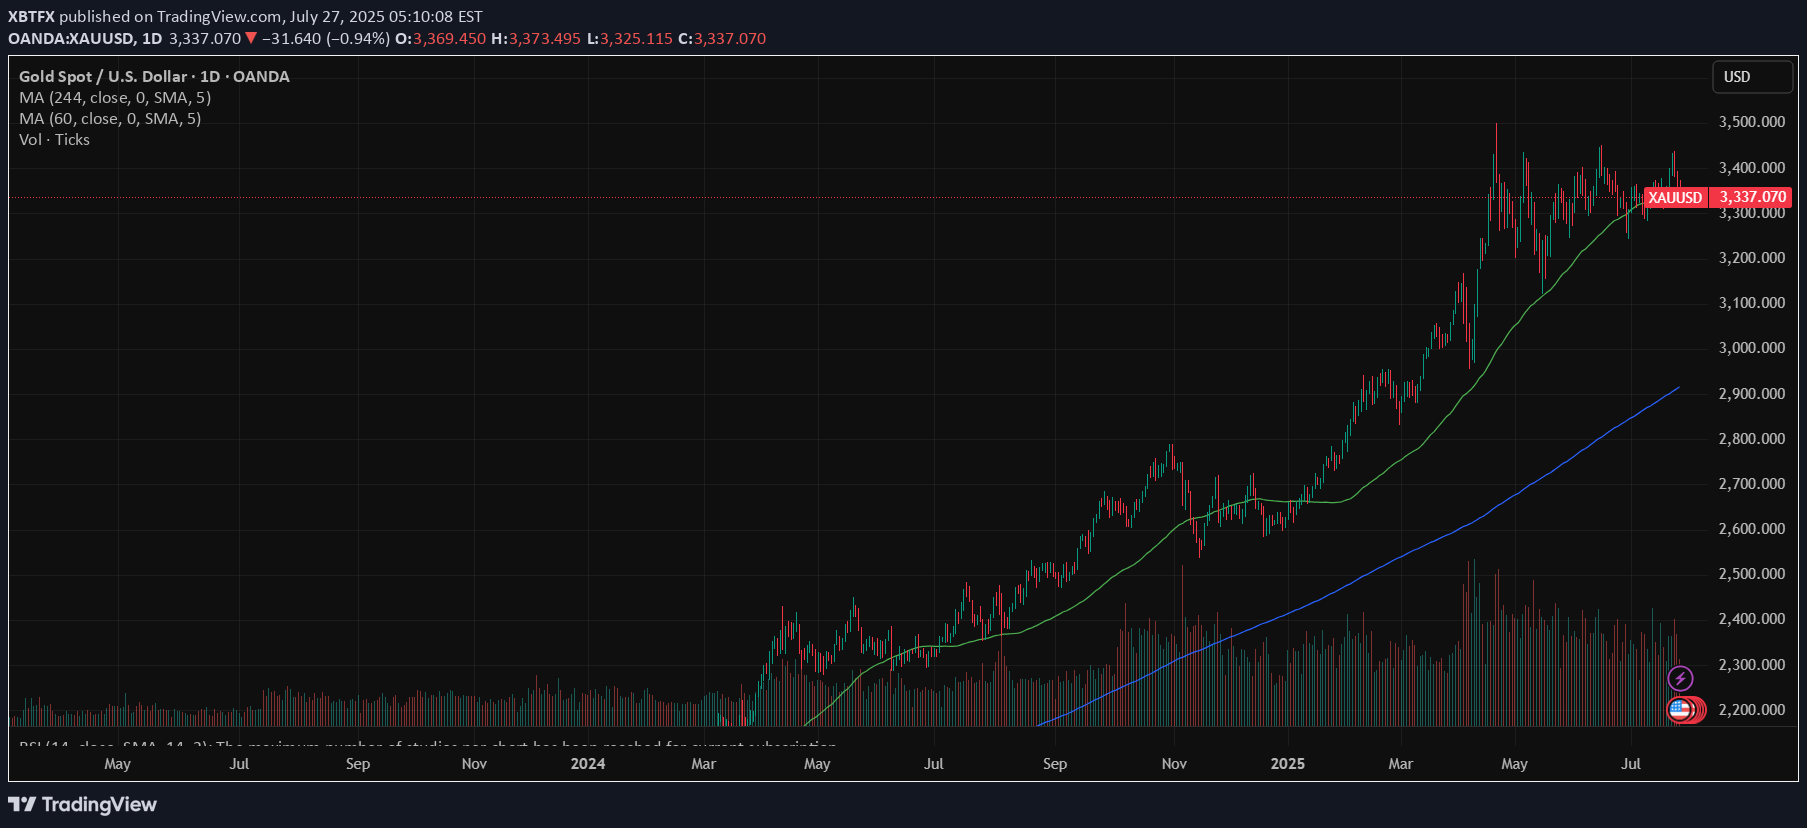
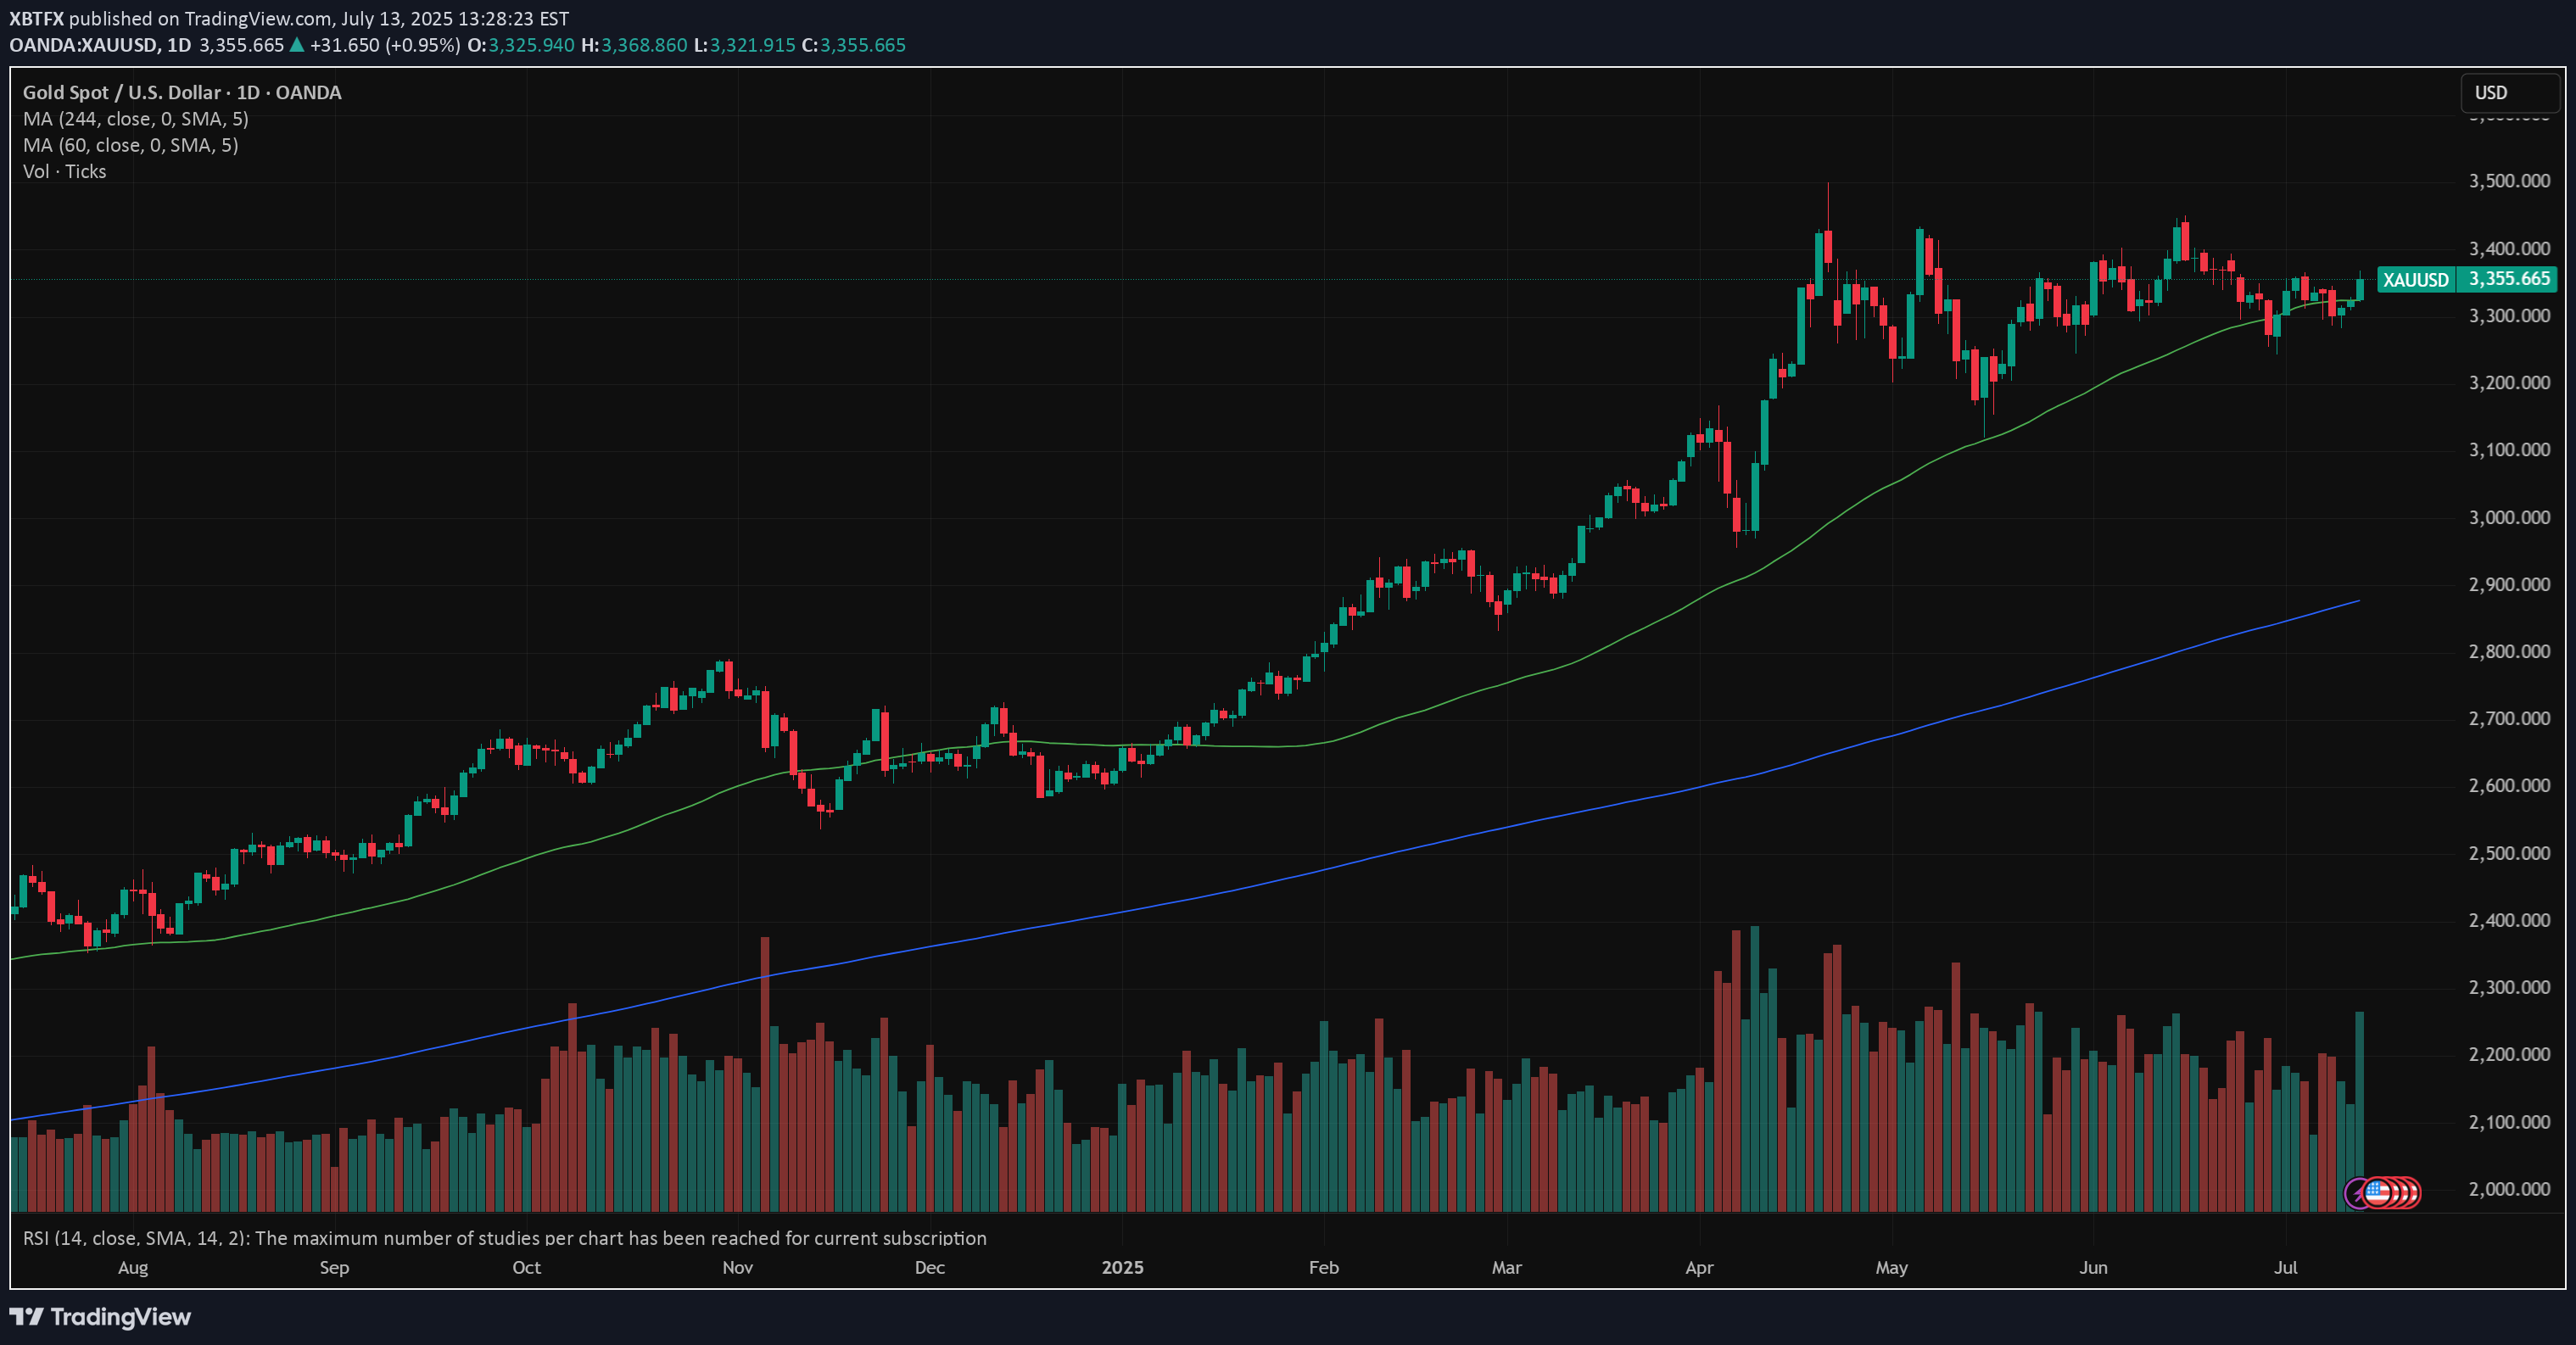
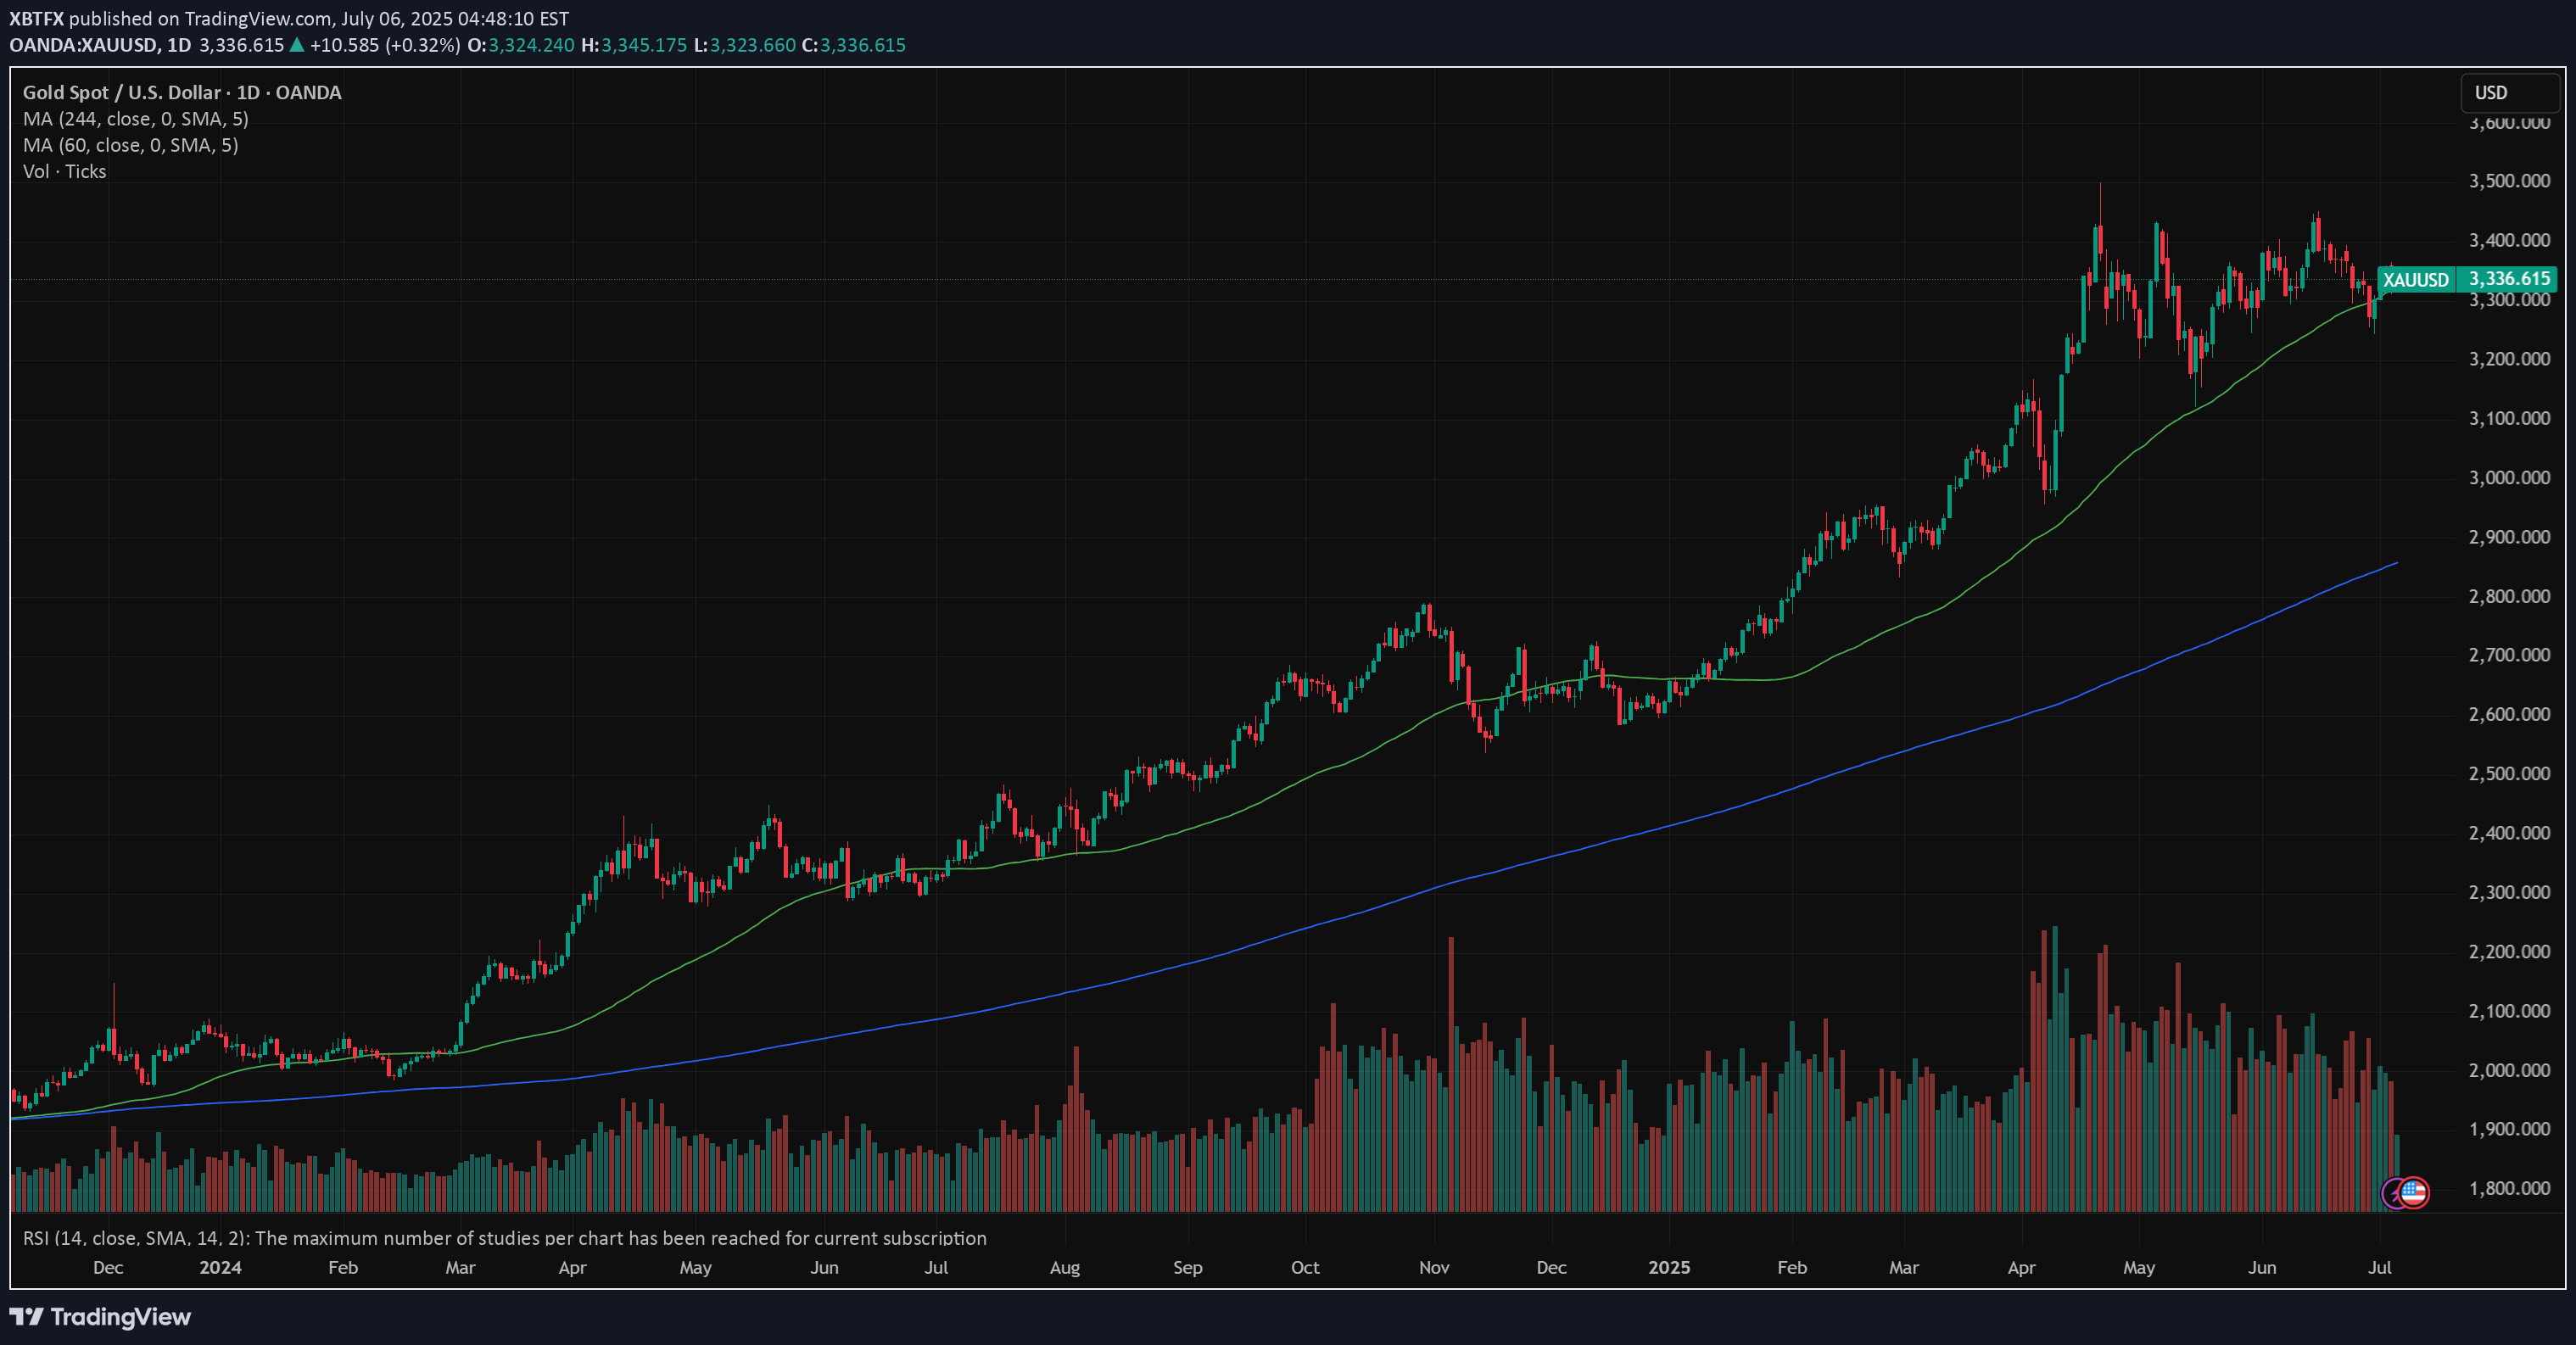
The safe-haven asset had its ups and downs during the previous week. The week started with an uptrend, where the price of gold reached its highest weekly level at $3.430, on trade tariff tensions. However, the deal made between the US and Japan, pushed the price toward lower grounds, ending the week at $3.340. In addition, Friday's drop was supported by announced tariffs negotiations between the US and EU in Scotland during the weekend. The RSI dropped below the level of 50 on Friday, ending the week at the level of 48. The MA50 slowed down its divergence from MA200, however, the potential cross is still far away. Still, weekly lows of the price of gold found support at MA50 levels. The week ahead brings several currently very important US macro data, including JOLTs, PCE, NFP and Unemployment data. In addition, the FOMC meeting will be held where the market will receive the latest Fed's view on economic developments in the country and future expectations. Also, further news on trade tariff agreements, especially regarding ongoing negotiations between the EU and the US in Scotland, might make an impact on investors sentiment for safe-haven assets. As per current charts, the price of gold might revert a bit to the upside, after a drop during the last three days of the previous week. In this sense, the resistance level at $3,4K might be tested. On the opposite side, the situation on charts is a little bit tricky. Namely, there is a line which perfectly connects all lows from February this year. Friday's closing was exactly at this line, which again adds to the probability of a short reversal. However, if, in any case, the price of gold breaks this longer term trend, then it will indicate that the longer path to the downside is in store for gold.
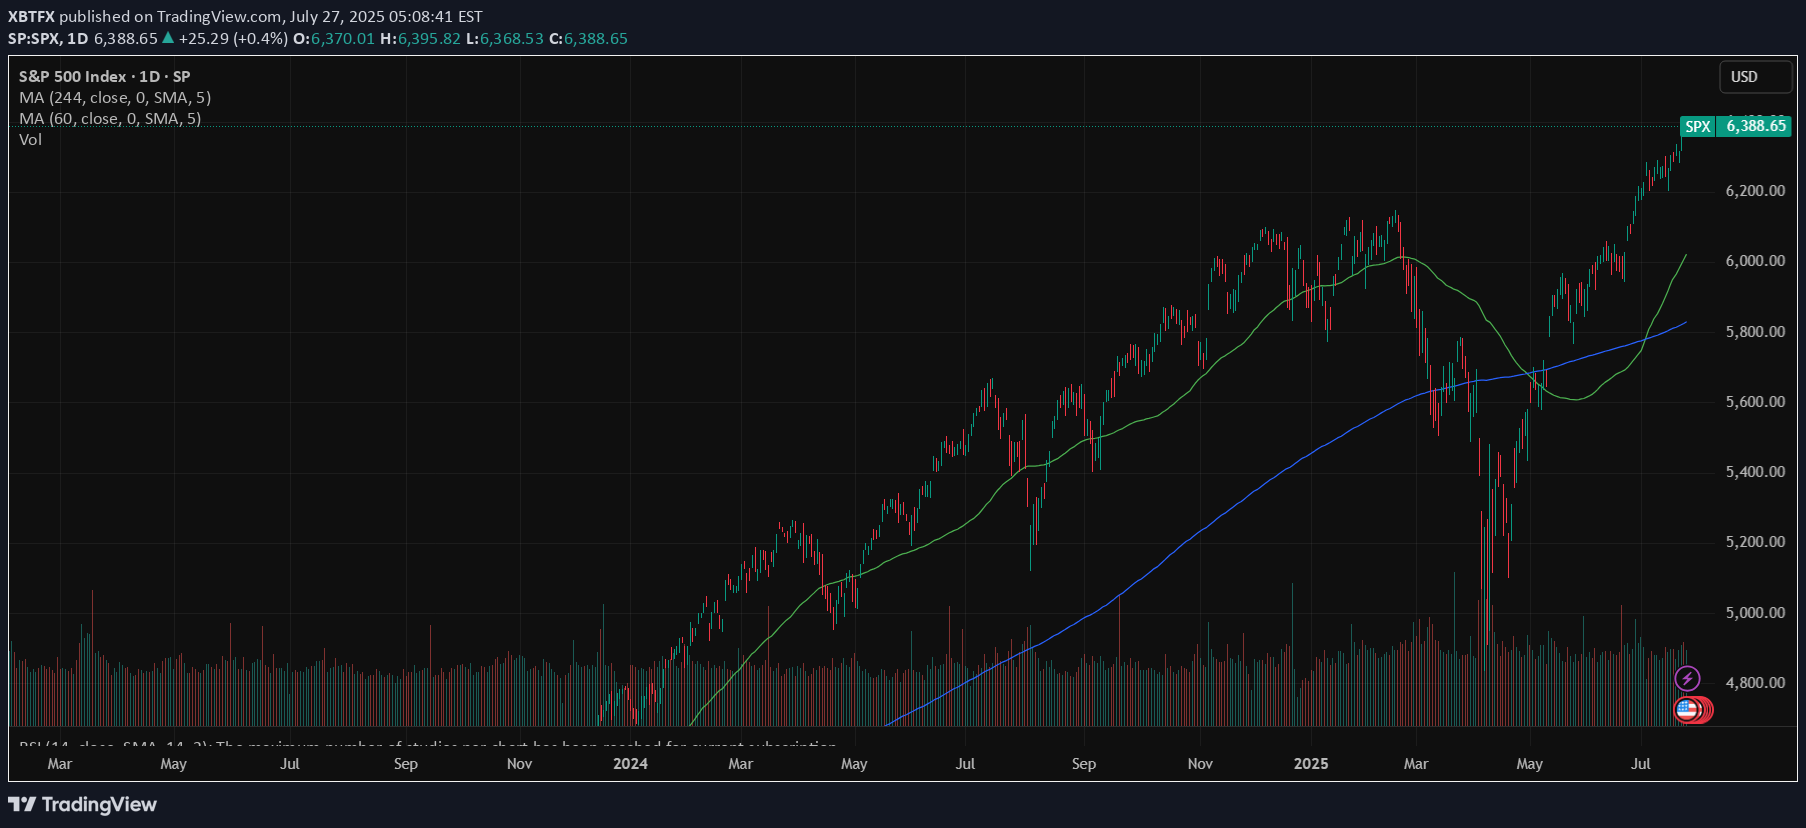
Investors' optimism continued to hold at the U.S. equity markets another week in a row. The S&P 500 posted another weekly winning streak, supported by solid earnings of companies included in the index. The index also reached another all time highest level, with Friday's level of 6.388, gaining around 1,5% for the week. Tech companies were once again main contributors to the surge of the index. Alphabet posted better than expected quarterly results, supporting the surge in share price of 4%. Tesla shares gained 3,5% for the week. The company reported strong vehicle delivery numbers and progress in AI-driven autonomous driving technology. Analysts are noting that 82% of all companies included in the S&P 500 index, that have already reported quarterly results, have beaten the market expectations. Alongside strong earnings reports, recent advancements in U.S. trade negotiations have contributed to market gains. Earlier this week, President Donald Trump announced a significant trade agreement with Japan, which includes a 15% reciprocal tariff arrangement—an important step toward redefining trade terms between the two nations. Additionally, the U.S. and Indonesia have reportedly reached a framework agreement for a trade deal, reflecting a broader U.S. effort to strengthen and stabilize trade partnerships in Asia. On Friday, President Trump expressed confidence that more trade agreements will be finalized ahead of the August 1 deadline for new tariffs. One of these possible deals involves the European Union. Investors have welcomed these developments, as they help reduce tariff-related uncertainties and ease concerns about escalating trade disputes that could disrupt global supply chains and impact corporate earnings. The week ahead brings a bunch of important macro data for the U.S. as well as the FOMC meeting, where Fed members will discuss a potential change in interest rates. Markets are currently not expecting that the Fed will make a move at this meeting. Certainly, with JOLTs, NFP, PCE data in combination with the FOMC meeting, the week ahead might bring back some higher volatility in the US equity markets, in case of any unexpected news.
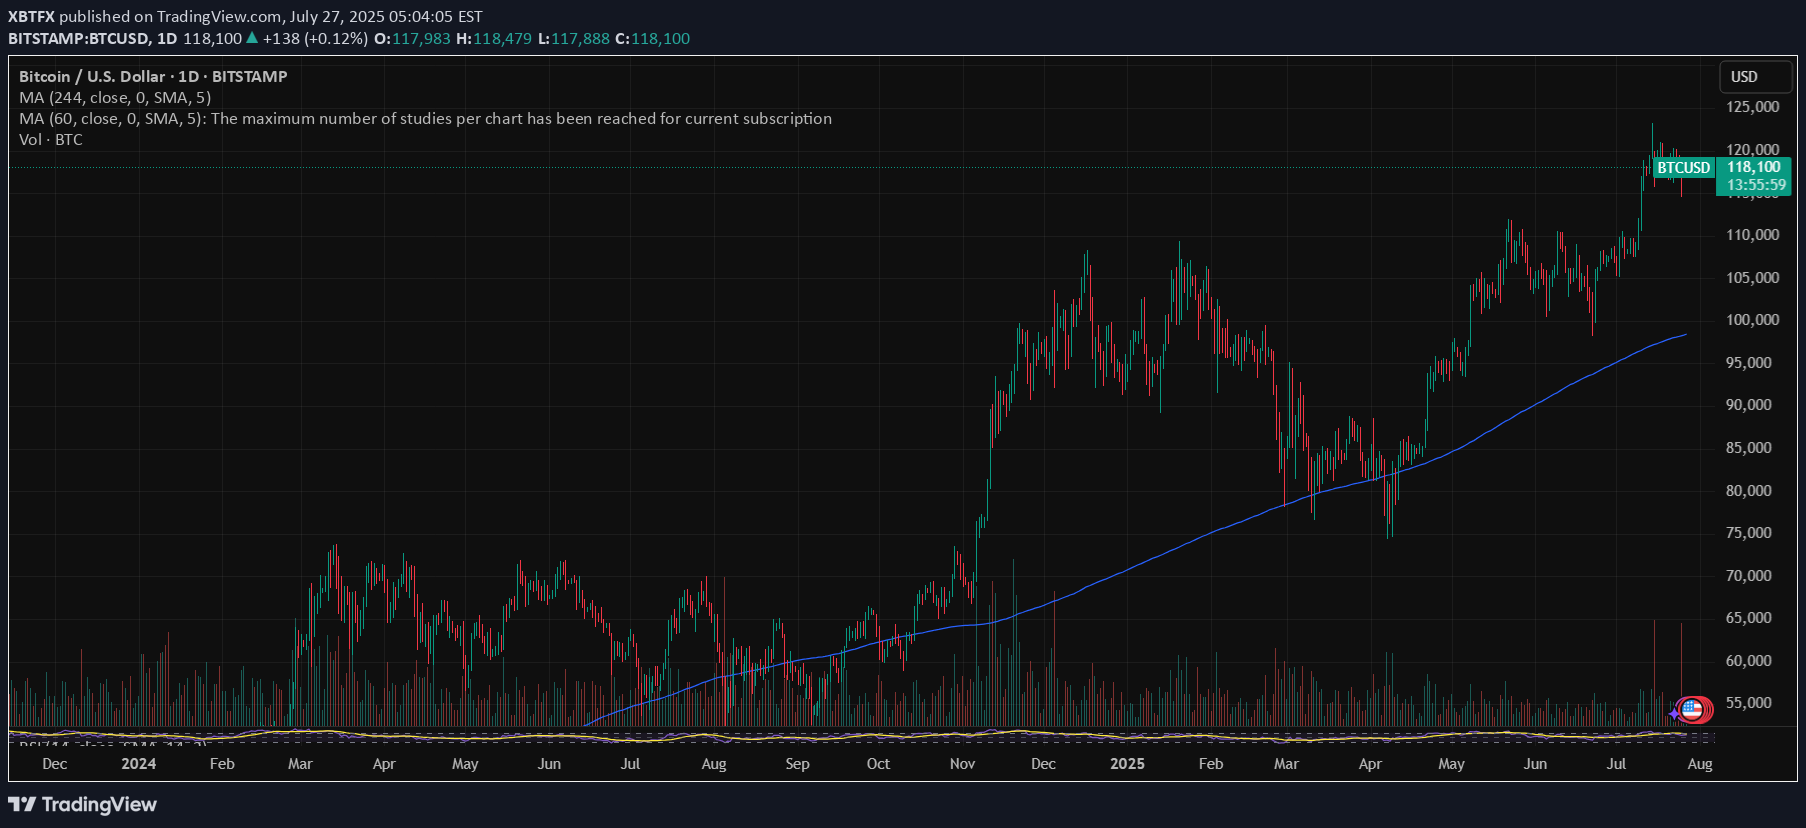
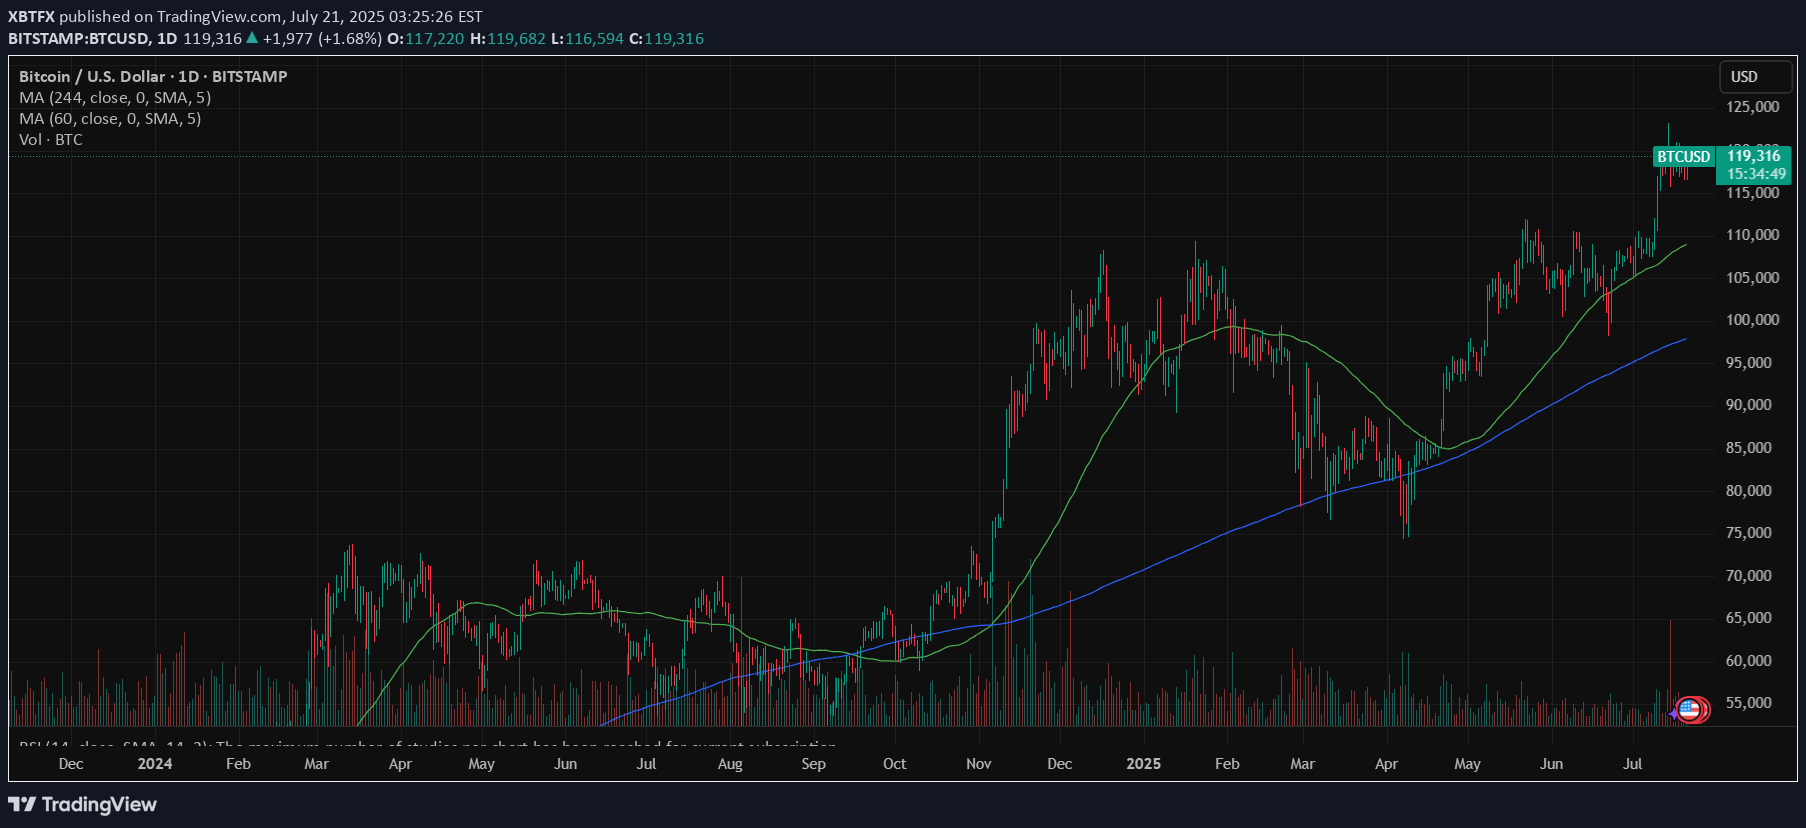
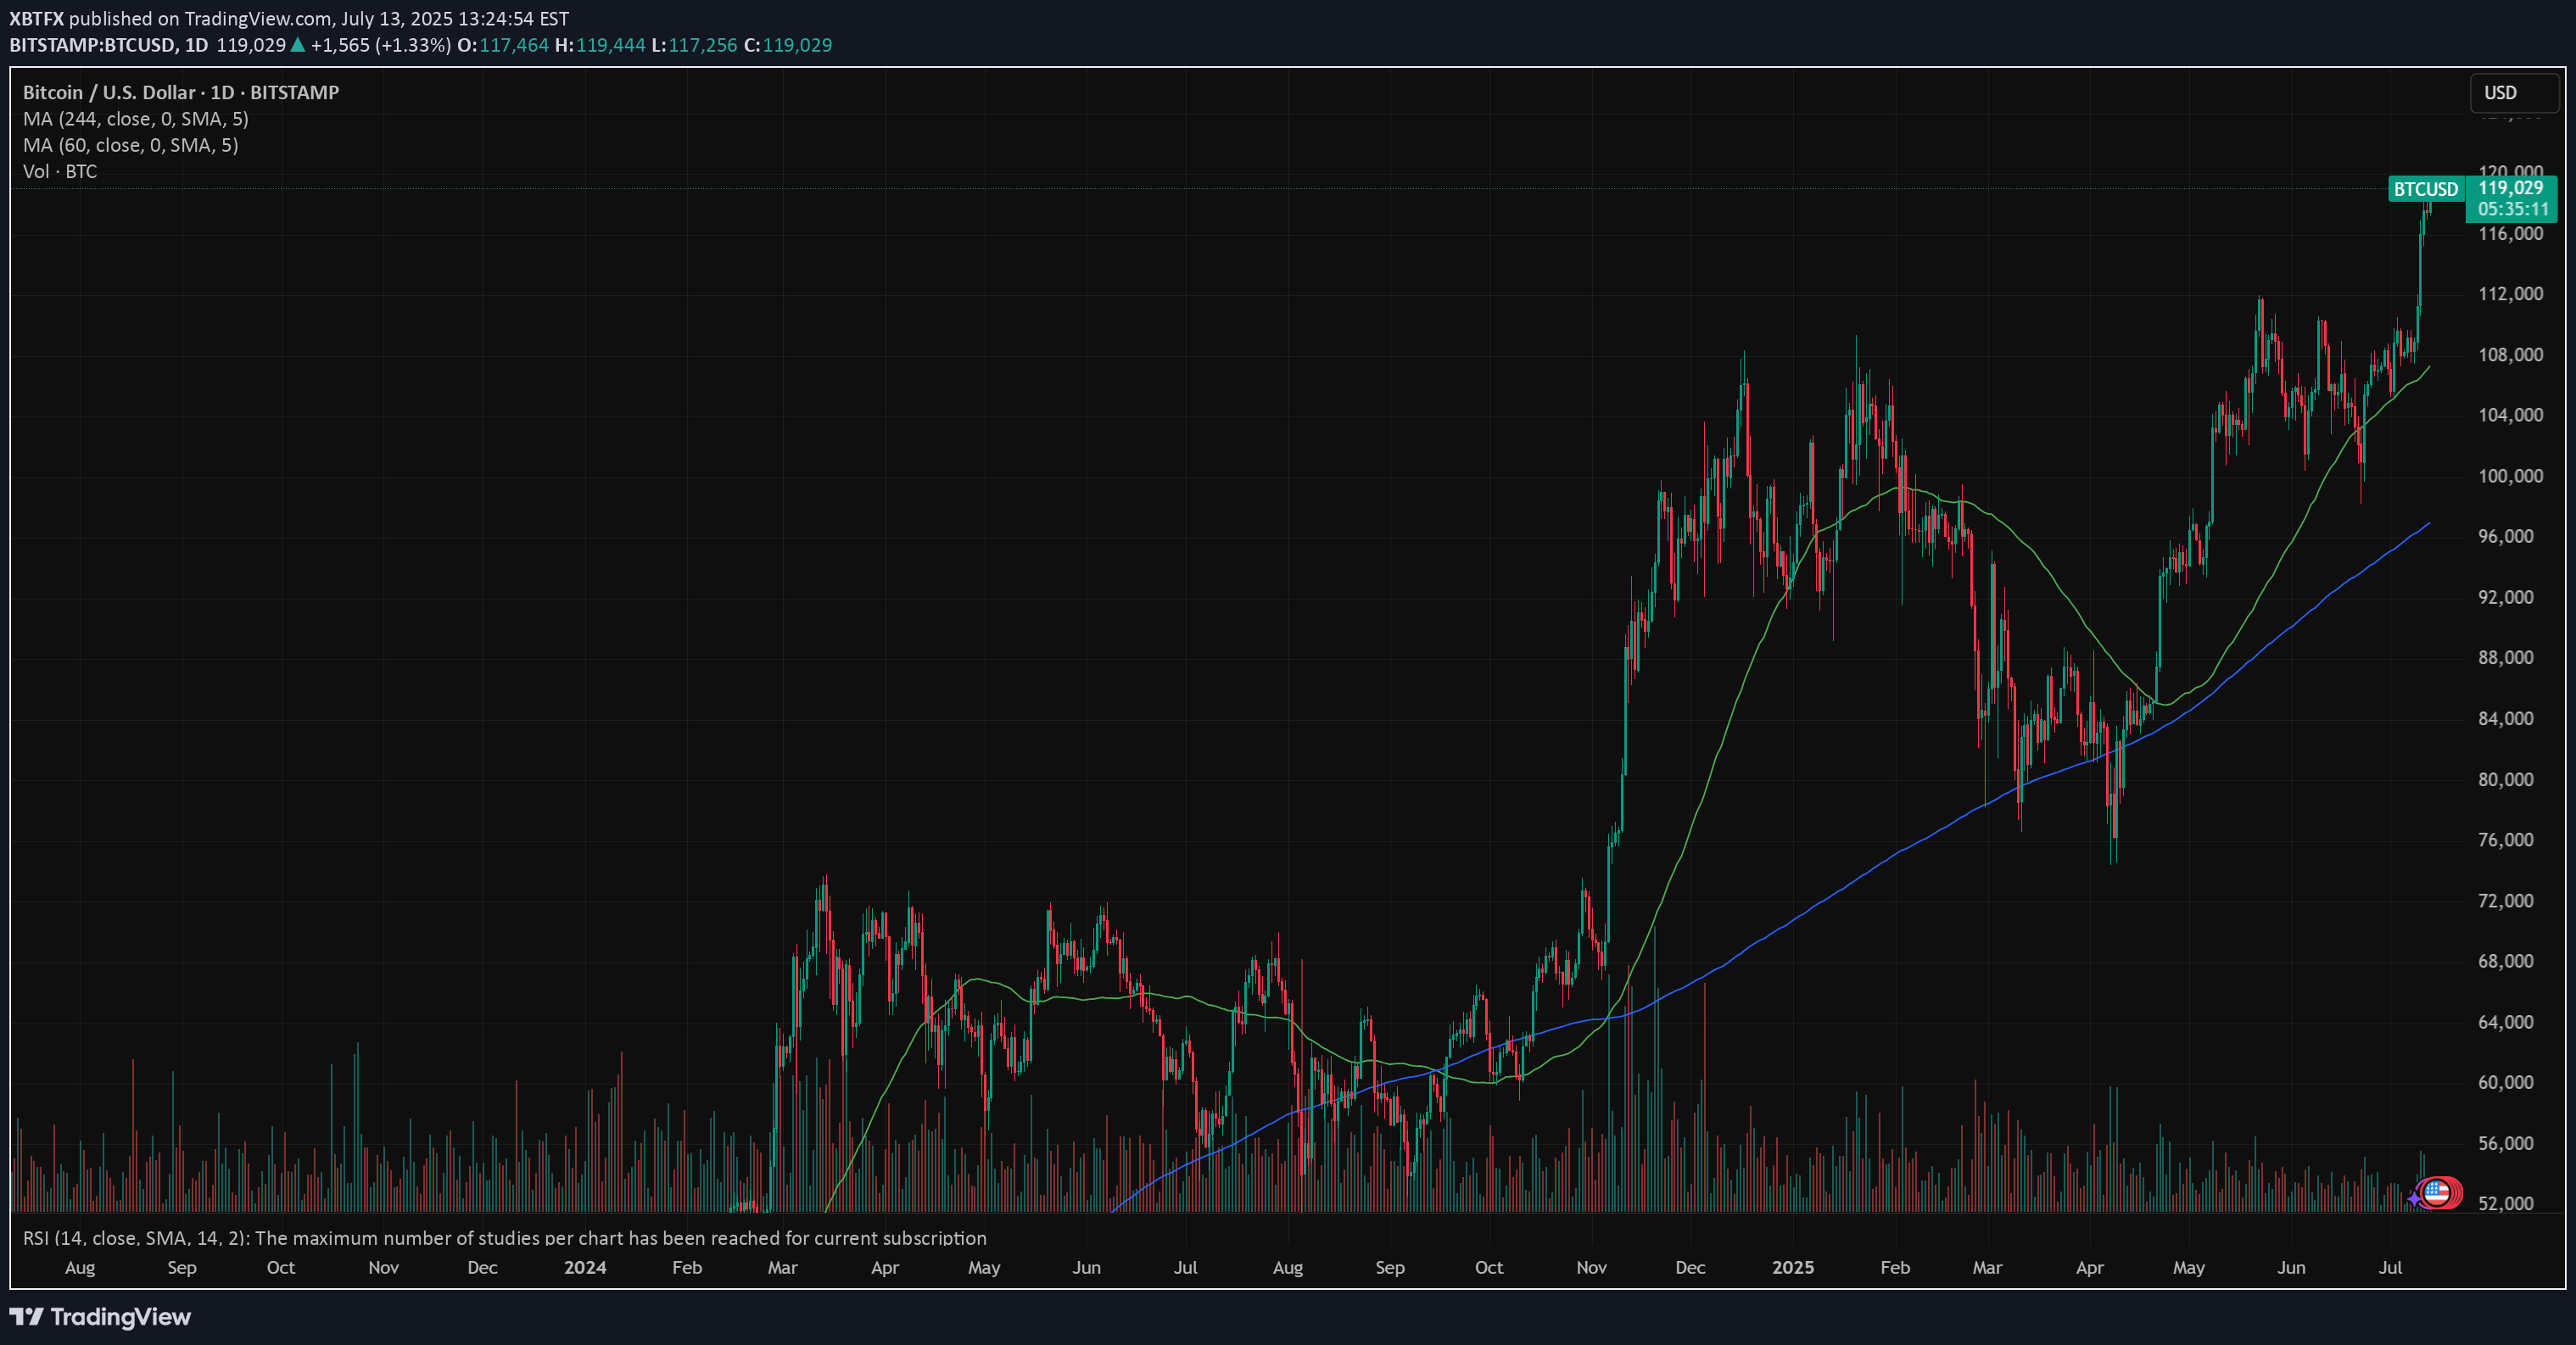
The optimism that held the market sentiment after the adoption of the Genius Act on July 17th, slowly faded during the previous week. As it was expected, traders were closing their positions in order to book profits, spiking the liquidations of positions. The price of BTC reached the lowest weekly level at $114,8K at Friday's trading session, however, it was only during the short period of time. The BTC swiftly recovered, turning back toward levels above the $118K. The highest weekly level reached was $120K. The RSI is still holding high, around the level of 60, but went out from the overbought market side. This increases potential for a further move toward the oversold market side, however, it might take more than a week in order for the market to actually turn their course toward the downside. The MA50 is still diverging from MA200, indicating that the potential cross is still not in the store. BTC continues to hold higher grounds, which indicates that investors are still eager to hold and buy this coin, especially on a dip, like it happened at Friday's trading session. Indications over potential short reversal of BTC are emerging on charts, however, the timing of it is unclear at this moment. In the week ahead there are several quite important US macro data scheduled for a release (NFP, PCE, Unemployment, JOLTs) as well as the FOMC meeting, which all might bring some higher volatility back on markets. BTC might also react, as a part of mainstream markets. At this moment on charts, there is indication that BTC might shortly test lower grounds, probably around the $116K level. If this level sustains the selling pressure, then BTC will revert back, most probably toward the $120K for one more time. Still, there are small odds that the $116K might be breached toward the lower grounds, in which sense, $112K will be level to watch. However, odds for this level are quite low at this moment.
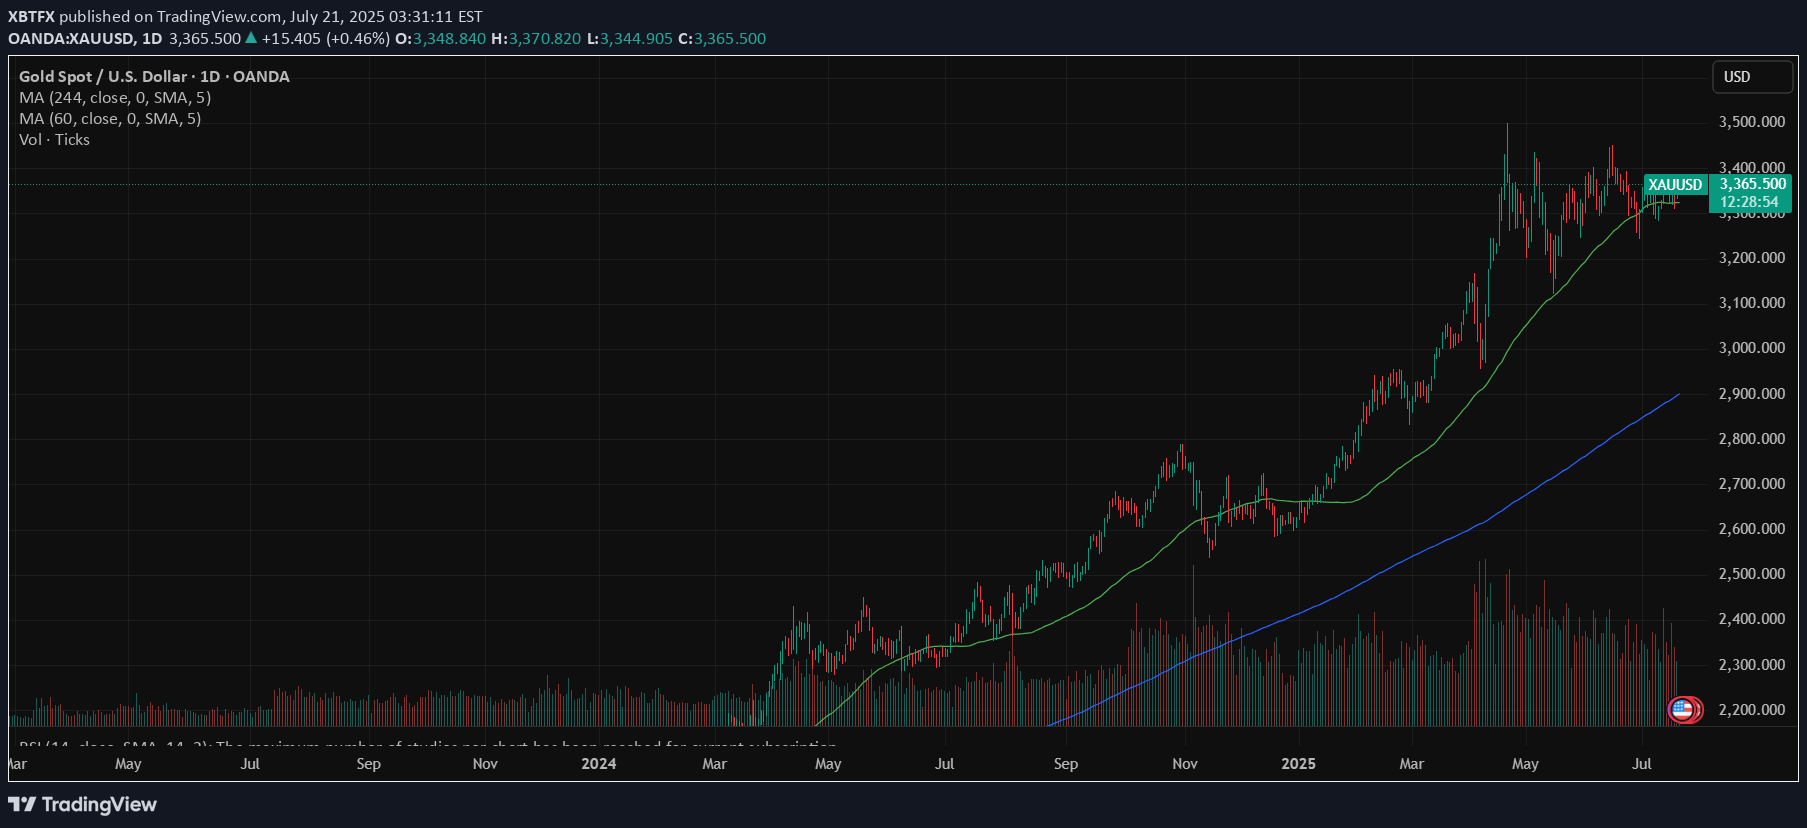
Gold was traded relatively flat during the previous week, moving within a range of $3.370 and $3.313. The safe-haven asset was holding relatively steady on eased geopolitical and economic tensions. The US Dollar gained a bit last week on better than expected inflation and jobs data posted during the week. Analysts are in agreement that current concerns related to the U.S. debt growth and further trade tariffs updates will certainly support the price of gold in the near future period. The RSI was holding relatively steady modestly above the level of 50. This indicates that investors are still not ready to take the move toward the oversold market side. The MA50 modestly slowed down its divergence from MA200, however, two lines are still holding a higher distance between them, in which sense, cross is certainly not in store for some time in the future. Charts are indicating that the price of gold continues to be well supported around current levels. There is some potential for a small move toward the down side, till the levels around $3.310. Also, the $3.3K support line might be tested. On the opposite side, any news related to geopolitical or economic tensions might swiftly push the safe-haven asset toward the upside, at least till the level of $3.370.
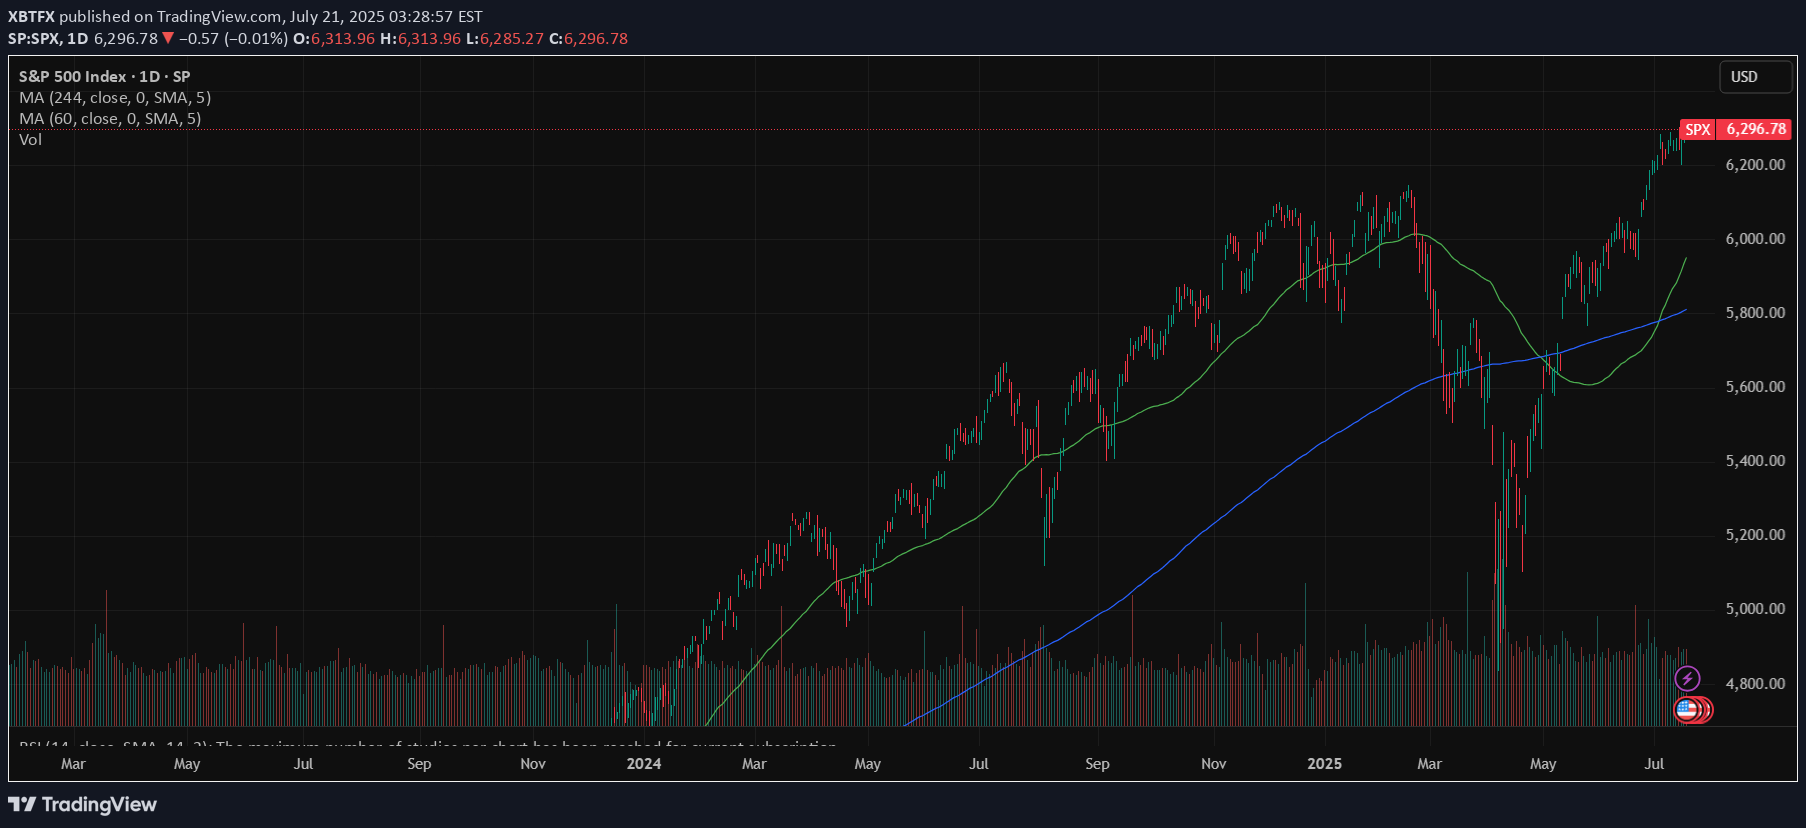
The US equity markets remained relatively resilient this week, despite ongoing concerns about trade policy developments. After last week’s slight retreat from its all-time high, the S&P 500 resumed its upward momentum early in the week, continuing to hover near record levels. The index reached a new highest level of 6,315 on Friday before pulling back slightly, closing the week at 6.296. Bank earrings were in focus of investors during the previous week. Overall, Q2 reports from major U.S. banks showed resilience — better-than-expected earnings, strong interest income, and robust capital actions. So far, the finance sector has seen Q2 earnings rise around 13% y/y and 3,4% revenue growth. In addition, a stress test posted by Fed underpin confidence as all major banks, including JPMorgan and Citi showing resilience also under potential stress conditions. However, both bankers and investors held a cautious tone on macro/public policy risk. Investors' confidence was additionally boosted by better than expected US macro data posted during the previous week. The inflation rate in June was 0,3% for the month and 2,7% on a yearly basis. At the same time, retail sales beat market expectations with an increase of 0,6% in June. As per analysts reports, currently 27 stocks included in the S&P 500 are trading at the all time highest levels. The ADM company, which is well known for producing Coca Cola, had a drop in the value of shares of 2% after the US President requested from the company to use real cane sugar in their popular drink. From July 23st a composition of companies included in the S&P 500 index will be changed. A crypto company Block will be included, while the company Hess will be excluded from the index. Shares of the Blok surged by 10% on Friday, after the release of the news.
The U.S. House passed the Genius Act on July 17, following Senate approval in June. The bill sets comprehensive federal standards for stablecoins, clearing the way for banks and fintechs to issue them under clear reserve and audit rules. This represents a new milestone for the crypto market, and its leading coin - BTC. During the week, BTC managed to hold steady above the $118K. On Tuesday, there has been one attempt to push the price toward the $116, however, the price swiftly returned to the previous grounds. The highest weekly level reached was at $122,8K, reached on Monday, however, this level was also unsustainable. The majority of trades during the week were around $118,5K. The RSI modestly moved from the overbought market side, ending the week at the level of 65. This could be an indication of a forthcoming price reversal, however, considering strong demand for BTC, such a move could be easily postponed. The MA50 started again to diverge from MA200, indicating that there will be no cross of two lines in the coming period. BTC managed to hold levels above the $118K, which is an indication that investors are still not ready to sell in higher volumes, in order to take profits. The RSI is indicating potential for a short reversal, however, in the current circumstances, it might be postponed. A move toward the higher grounds is also quite possible, especially taking into account BTCs recent push toward the $122K. At this moment charts are pointing to equal probabilities for a move toward both sides. On one hand, the $116K support was indicated through price during the previous week, as well as the $122K. The start of the week ahead will determine which side will prevail in the week ahead.
The market optimism holds, but comments related to tariffs are still bringing some unrest among investors. Although this unrest is currently not as strong as in April this year, still, some investors prefer to keep part of their funds in the safe-haven assets. News regarding trade tariffs during the previous week include 35% tariffs on imports from Canada, 50% tariffs on imports from Brazil, and 50% tariffs on copper imports. The latest news posted on Saturday includes 30% tariffs on goods from Europe and Mexico. Weekend information was still not reflected in the market price of the gold, implying that the Monday trading session might start with further move to the upside. The price of gold gained during the previous week, starting around the level of $3.285 with Friday's strong push, ending the week at $3.355. At this moment, the RSI modestly passed the 50 level, closing the week at 53. The MA50 continues to slow down divergence from MA200, but the potential cross is still not in store, considering the significant distance between two lines. When it comes to the price of gold in the week ahead, tariffs will again be the ones to shape investors sentiment. At this moment, technical analysis is pointing potential for moves toward both sides. If Monday's trading session starts with a move toward the upside, then it will most probably continue for the rest of the week. The next resistance line stands at $3,4K, which could be tested. However, there is also some probability for a short price correction, where the level of $3,3K might be tested for one more time, eventually $3,280.
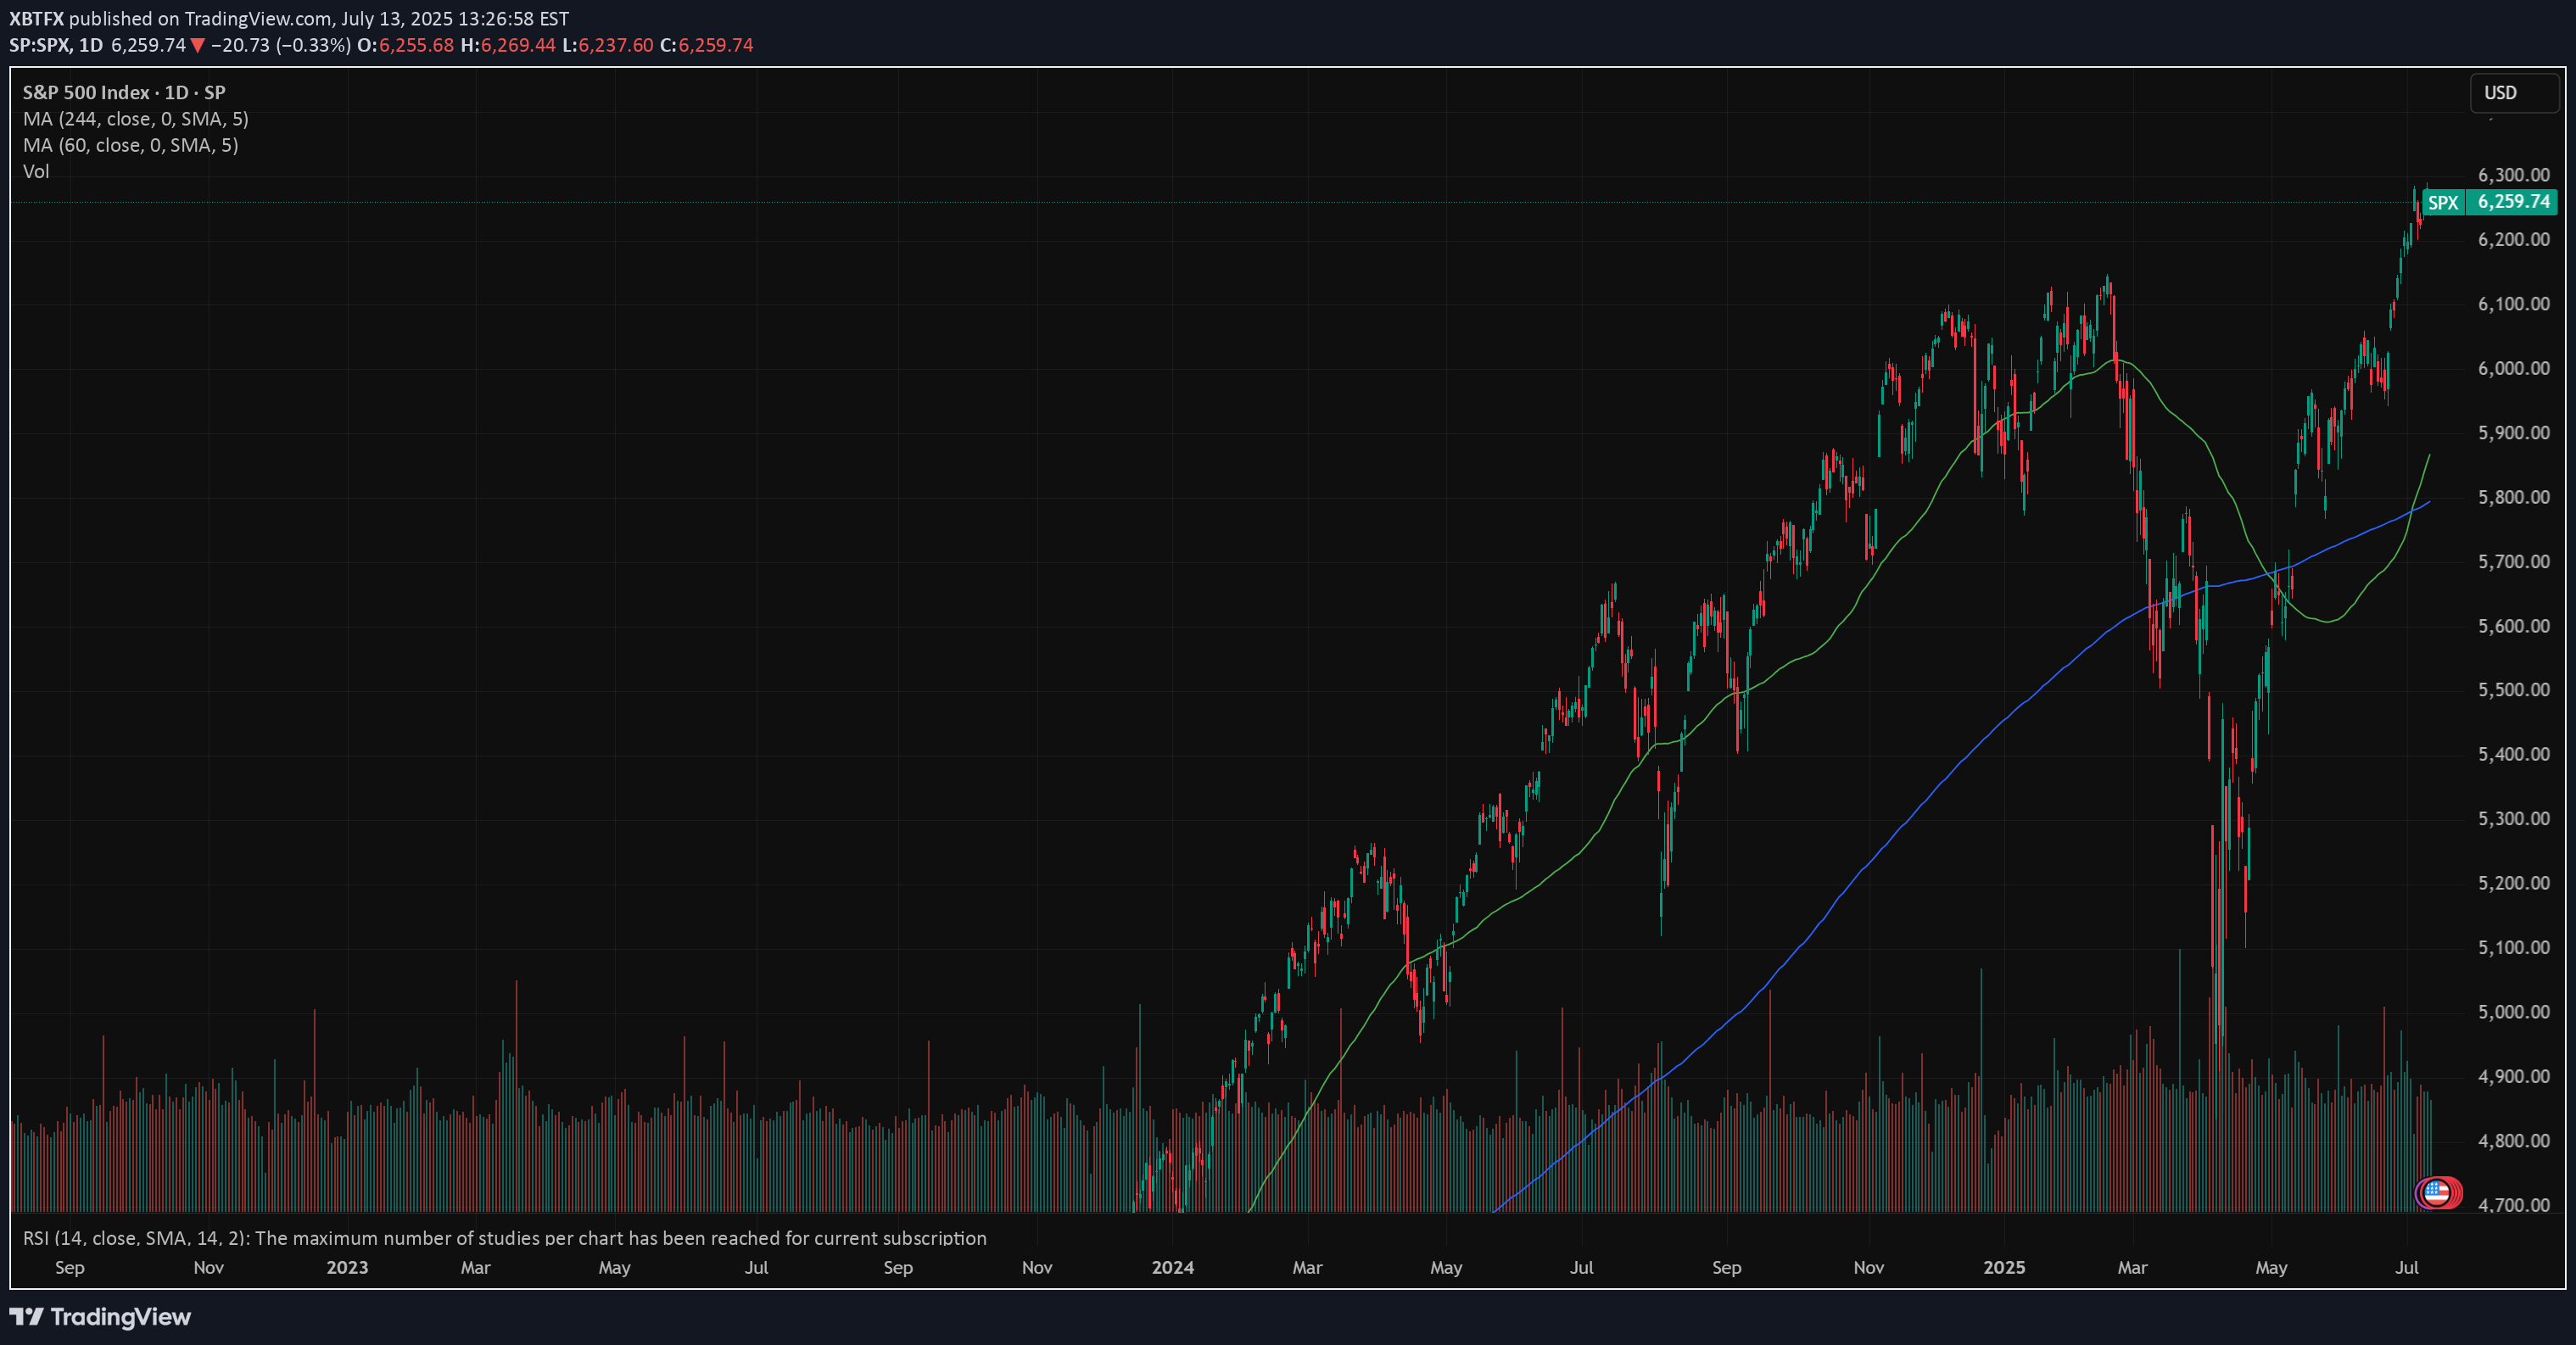
Previous week was another optimistic week on financial markets. Regarding the approaching deadline for a delay in the application of trade tariffs set by the US Administration, which came due on July 9th, the market did not show much of a concern. The green trend line of the S&P 500 continued during the week, where the index managed to reach another new all time highest level on Thursday, at 6.290. During the previous week there has not been any currently important US macro data posted, in which sense, the market sentiment remained optimistic. However, Friday's news regarding trade tariffs spoiled a bit of an up-trend, so the index ended the week, just a bit lower from its ATH level, at 6.259. Weekly tariffs news include a 35% imposed tariffs on imports from Canada, and 50% on goods imported from Brazil in the U.S. There are also some comments on a potential increased universal 10% tariff on the majority of other nations, noting 15% and 20%, as well as a 50% tariff on copper. Analysts are noting that the market is already adjusted to the comments regarding trade tariffs, in which sense, there are no more strong market reactions on any incoming news. The week ahead brings some important US macro data, as well as gearing up for the earnings season, starting with major banks like JPMorgan. The June inflation data as well as PPI will be posted in the week ahead, closing with University of Michigan Consumer Sentiment. This data might bring back some volatility to the S&P 500, however, the general investors sentiment remains positive at this moment.
Crypto enthusiasts are celebrating the latest achievement of BTC. The coin managed to reach another all time highest level during the previous week, at the level of $118,5K. Although BTC was struggling during the previous period to sustain the higher grounds, testing on several occasions the resistance level at $108K, the buying orders prevailed on Wednesday, bringing the skyrocket levels on Thursday and Friday. Crypto market significantly gained from the BTC move, as majority of other crypto coins gained in value, surging significantly total crypto market capitalization. With the latest strong moves, the RSI reached a clear overbought market side, touching the level of 73. The indicator is closing the week at the level of 70, still continuing to move within the overbought market side. The MA50 is turning again toward the upside, leaving the MA200 aside. There is no indication of a potential cross in the coming period. Charts are pointing to a potential for a short reversal of BTC price in the coming week. Such a move could be treated as “normal” in terms of how the market is functioning. A strong push toward the upside will make traders close their positions in order to take profits, which will shortly push the price toward downside. Where that level could be, at this moment, is hard to predict based on technical analysis, because BTC is currently moving in an uncharted territory.
The price of gold was traded at modestly higher grounds during the week, which was impacted by the further weakening of the US Dollar and also concerns raised by the approval of the so-called Trump's tax megabill, which passed the US Senate during the previous week. Investors perceive tax cuts negatively, which are estimated to add $3,4 trillion to already concerned US debt over the period of the next 10 years. As analysts are commenting, on a long run increased US debt will further weaken US Dollar, which will be positive for the price of gold. The price of gold started the week around the level of $3.250 and headed toward the highest weekly spot of $3.360. It is ending the week modestly lower, at $3.336. The RSI is still not showing any clear movement to either side, sliding around the level of 50.The MA50 has shortly continued to act as a supporting line for the price of gold, although it has been breached at one moment during the week. MA200 is moving without a change, with a holding uptrend. The potential cross is still not in store for these two lines. The week ahead is not bringing currently important macro data for the US economy, in which sense, higher volatility is not expected. Still, any news related to trade tariffs, might shortly move the market to one side. Current charts are showing that the price of gold is struggling to sustain the upside momentum, in which sense, some further retracements might be possible in the weeks to come. As per current charts, the support line at $3.280 might be tested in the coming period. On the upside, no significant movements are to be expected. There are some probabilities for the level of $3.360 in the week ahead, with lower probability that $3.400 resistance could be tested again.
Disclaimer
Any content and materials included in Sahmeto's website and official communication channels are a compilation of personal opinions and analyses and are not binding. They do not constitute any recommendation for buying, selling, entering or exiting the stock market and cryptocurrency market. Also, all news and analyses included in the website and channels are merely republished information from official and unofficial domestic and foreign sources, and it is obvious that users of the said content are responsible for following up and ensuring the authenticity and accuracy of the materials. Therefore, while disclaiming responsibility, it is declared that the responsibility for any decision-making, action, and potential profit and loss in the capital market and cryptocurrency market lies with the trader.