
WillTMoney
@t_WillTMoney

What symbols does the trader recommend buying?
Purchase History
پیام های تریدر
Filter
WillTMoney
BTC 50/100/200 EMA Macro Support Resting Perfectly

We're resting TIGHT above all major Daily and Weekly exponential moving averages.
WillTMoney
BTC resting on the 50/100/200 Daily & Weekly MAs

BTC resting on the 50/100/200 Daily & Weekly MAs We're resting TIGHT above all major Daily and Weekly moving averages.
WillTMoney
Similar structure - ALL Bitcoin halving cycles (2023)

I won't explain, but I will leave bullet points.. -We are very closely rhyming with the 2016 chart -Same upward structures -All breaking up after halving 1470 days from previous halving between 618/786 FIB -The only time the upward trendline was broken was the Plandemic Black Swan -Strange observation that the fibs show the most confluence placed above the bear market structures bottom dip -If we are rhyming with 2016 then we shouldn't see anything below 25k ever again -If we are rhyming with 2016 then we should be breaking up to the 42-50k range within 20-60 days. -This is speculation - Anything is possible so DYORAccording to the 1470 day theme - This would put our upward departure towards the next peak a on May 20th 2024Shout out to Kevin Svenson for reading my comment on YT
WillTMoney
Bitcoin by end of June - 48k?

Bitcoin looks like it would like to reach up and touch 48-50k..maybe even a little higher. People are calling dooms day for all markets..dooms day for everything every day, but what they forget is that Bitcoin is one of the only places to store your wealth in these uncertain times. With a world banking crisis, inflation, war, and economic trouble looming around the globe, people will run to Bitcoin as a safe haven that the globalist banking crime syndicate can't dilute or rig to steal from you. What do you think? Let me know..
WillTMoney
Bitcoin Road Map 2022-2024 Details Part 1
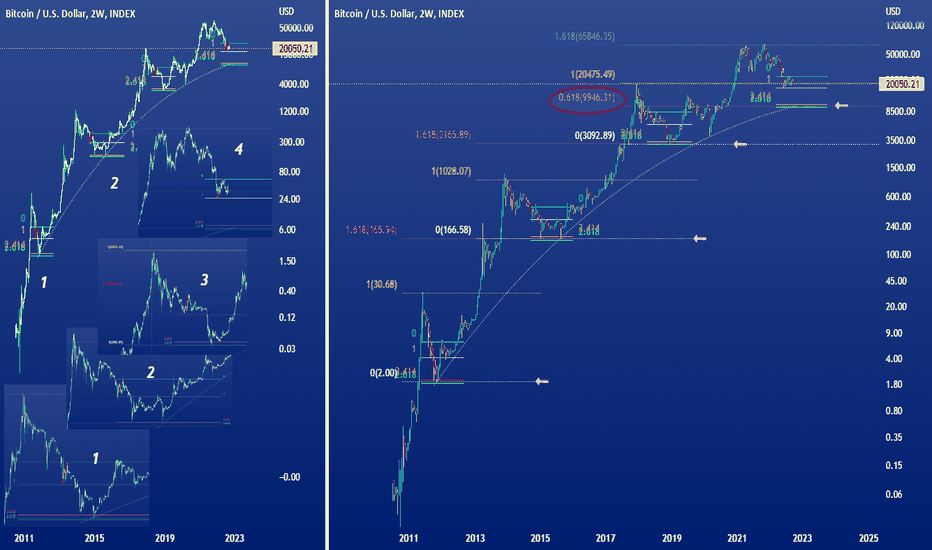
I don't want to make this too long - So simply put - There is a precise repeating pattern related to the 2.414 & 2.618 FIBS when the retracement is pulled from the bottom of the last upward test in price move to the top of the price move before the fall to the bear market low that immediately follows. The bear market bottom has pivoted at it's lowest point exactly between the 2.414 & the 2.618. Hitting at least the 2.414 and sometimes coming close to the 2.618. In addition to this predictive anomaly, there is also the exact confluence with the extension FIBs pulled from each previous bull market ATH down to the bear market bottom - when this is done accurately, the 1.618 FIB falls dead between the 2.414 & 2.618. This anomaly has repeated since the inception of Bitcoin. The only deviation is in the current cycle - It is found in the fact that the FIBS have strangely inverted because the recent ATH only reached the 1.618 on a Logarithmic chart opposed to the bear market low target resting ON TOP of this same 1.618 FIB in the past 3 cycles..the current cycle is poised to LAND on top of the 0.618. Regardless, it is still confluent with a 618 mark. The current bear market cycle target when using this same predictive application puts the upcoming bear market bottom price around $10,000. I should note that depending on how you set your FIB levels (at the open of a candle or the close of another etc etc) this can change the price target by a small degree, but basically it will be in the same ballpark. Please ask if you have any questions at all - I am very happy to answer.
WillTMoney
Bitcoin Historical Reference Map 2022-2024

::This chart is a sifting & filtering of data from the previous cycles. ::This is a reference guide made from time and percentages and general price movement spanning from the inception of Bitcoin until present day. ::This was made to be a useful reference and by no means should this chart be interpreted to be an accurate prediction of price and time (although I do believe it may be pretty damn close). ::If you would like to ask any questions about how the chart was constructed, or what information and details were studied to produce this chart please ask me in the comments and I will be more than happy to explain my thought process/how the percentages and times were calculated ETC. Much of this was compiled using information from the LOG chart, but has been presented here using a LINEAR chart because both charts share particular angles of perspective needed for the bigger picture. Enjoy.The grey dotted "hump" is an alternative projection for the bounce after the bear market lows - in the 2017 cycle this bounce reached higher than in past cycles, and it created a precedent for the possibility of this higher percentage bounce continuing on in future Bitcoin cycles due to the evolving market structure. Although it is good to acknowledge also that the black swan crash in spring 2020 was unforeseen and seamed to be worse as a result of the added over correction due to the nearly 350% rise in price that had taken place just previous (the higher target) This is why the previous cycle chart is so ugly - it was a sine wave correction that was wildly bouncing to stay on pace for the bull run trajectory (which was also an ugly mess that over corrected with the help of over leveraging creating a camels hump and a double top lol..)Keep in mind there are also some interesting Indicators hidden at the bottom of the screen that you can explore - Just pull them up..Comment: Also something to add - Not only are the average percentages & times being represented, but also the relative Fib levels that can be found and duplicated on all previous cycles. They are the SAME in all previous cycles - indicating significant levels similar to mile markers and elevation indicators on a mountain climb. The pattern repeats like a fractal, and I don't expect it will be much different this time around. It just appears different to the eye on a log chart as we grow higher in price.The little grey tear drops on the chart can be hovered over for more info..The horizontal Black line extending past the major downward trendline shows the path that could be possible if price attempts to stay afloat longer than expected. Although in that case I'd expect we'd eventually see a steep drop by the beginning of November, but my primary expectation is that price will stay behind the trendline and hit our target towards the beginning of the red box (Beginning of October.)This chart will give insight into just some of the FIB levels that I have found to be predictive & repeating within every cycle of Bitcoins history..From past cycles it looks to me the furthest out we might go is 3rd week in December..I believe we are somewhat behind for a final capitulation if it's coming. My targets remain the same..
WillTMoney
Possible Direction of movement going forward..
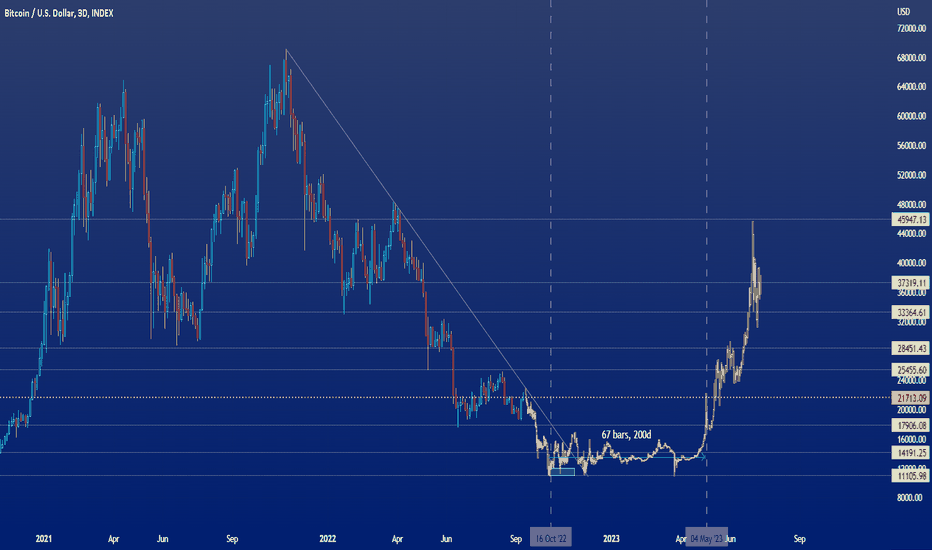
From my study, we're looking at a bottom between Oct 15th - November 15th sometime. Likely sooner than later - my current target is around 11k October 15th, but that could change depending on how the price wants to float around within that window. Definitely bottom by end of November in any case. On a linear chart you can see we are about to fall into the bottom of a final triangle before breaking out. According to past cycles and time/percentage averages we won't likely see a big rush upward until May/June 2023 likely.. And we definitely 100% will not be breaking the 50k mark before March 2024.. IMHO
WillTMoney
Bitcoin Roadmap 2022 - What to expect for the bottom reversal

This is an untouched line model of each Bull Run complied together and matched up at the peak before falling towards the Bear bottom. I did not fit it together to look nice, and I did not change the angles. It's genuine and undeniable. This is the form that I extracted the 3 line structure used on top of each bull run. The strange confluence that was found is the following: For the latest bull run - When you take the 3 line structure and duplicate it, then lay it over itself at the second bar down, it fits PERFECTLY TO the current price movement/percentages/time. This shows to me that we have an evolving dynamic as we grow into higher prices on a logarithmic chart. What may look strange to the eye is actually exactly the same structure from the past 2 bull runs. One odd detail to note that I am still not completely understanding of is the fact that there seams to be a what I call a "ghost peak" that would have existed around $109,000 that was never met (but expected by many) that fits in perfectly to this structure as well! Although the actual calculations are done from the November price top and fits perfectly to the rest of the structure mathematically. There is much more to be understood and discovered about this chart so please contact me if you'd like to add some ideas or collaborate. I expect us to hit the bottom blue line at around $12,780 at least as a candle closing target on this 10D chart, as well as the possibility of going down to touch the $10,000 mark. Please note there are many more aspects of FIB levels and average time/percentage calculations and moving averages that have been hidden in the background that show amazing confluence. Note: If you scroll below the chart there are some distance lines regarding the halving cycles etc.. This chart is missing many aspects of it's original creation for ease of viewing..This is my final chart - this is the BTC chart I believe in until the future proves otherwise ;)
WillTMoney
Alternative perspective - Bitcoin Between $11,000 - $12,000?

There are many rabbit holes, fractals & patterns to play around with, but one thing is certain - there are beautiful architectures woven throughout the Bitcoin chart if one has a mind to pick away at it.. It's whispering things to us. It's actually the collective consciousness of all the human brains painting on a canvas..spliced in sections according to the halving cycle and world economics. Sorry, I can't explain the chart much more than to say that non-log fibs applied over log chart in a very creative way has shown me some strange synchronicities that seam to point to a fractally/vertically shrinking and squeezing pattern as larger price thresholds lower the ceiling.. paired with SMAs at 100,200,300,400,500 + VWAP from previous cycle bottom low close and wick low..and Phoenix ascending + some bottom signal dots set based on a 21 day look back..also a the Kaufman moving average seams to cup the balls of the price right as the next halving occurs which is something that could help locate the median resting price of BTC..Playing with charts is as fun as making music to me.. Maybe it's completely wrong..but it's about narrowing down the possible outcomes based on some derived evidence. DYORMy current target is much deeper, please refer to my most recent chart..
WillTMoney
Bitcoin Historic Halving Cycle Projection - $16,000?

Unedited, unpolished - my chart how I look at it. Decipher it, ask questions - whatever you want. This is yet another view of the Bitcoins past halving's to the present cycle. The percentage lines have been hidden in the layers, but everything is based off of averages and percentages from the past, as well as similarities in the movement with the moving averages and chart pattern of BTC creating a falling wedge (where we are present day in this cycle).The Gann Box is only used as a gauge of price and time - not for the fib ratios.With 20 & 100 MTF EMAMy current target is much deeper, please refer to my most recent chart..
Disclaimer
Any content and materials included in Sahmeto's website and official communication channels are a compilation of personal opinions and analyses and are not binding. They do not constitute any recommendation for buying, selling, entering or exiting the stock market and cryptocurrency market. Also, all news and analyses included in the website and channels are merely republished information from official and unofficial domestic and foreign sources, and it is obvious that users of the said content are responsible for following up and ensuring the authenticity and accuracy of the materials. Therefore, while disclaiming responsibility, it is declared that the responsibility for any decision-making, action, and potential profit and loss in the capital market and cryptocurrency market lies with the trader.