
VisionaryInsights
@t_VisionaryInsights

What symbols does the trader recommend buying?
Purchase History
پیام های تریدر
Filter
VisionaryInsights
آماده پرواز بیت کوین! سیگنال صعودی قدرتمند BTC/USD در تایم فریم 4 ساعته (اهداف تا 100K)
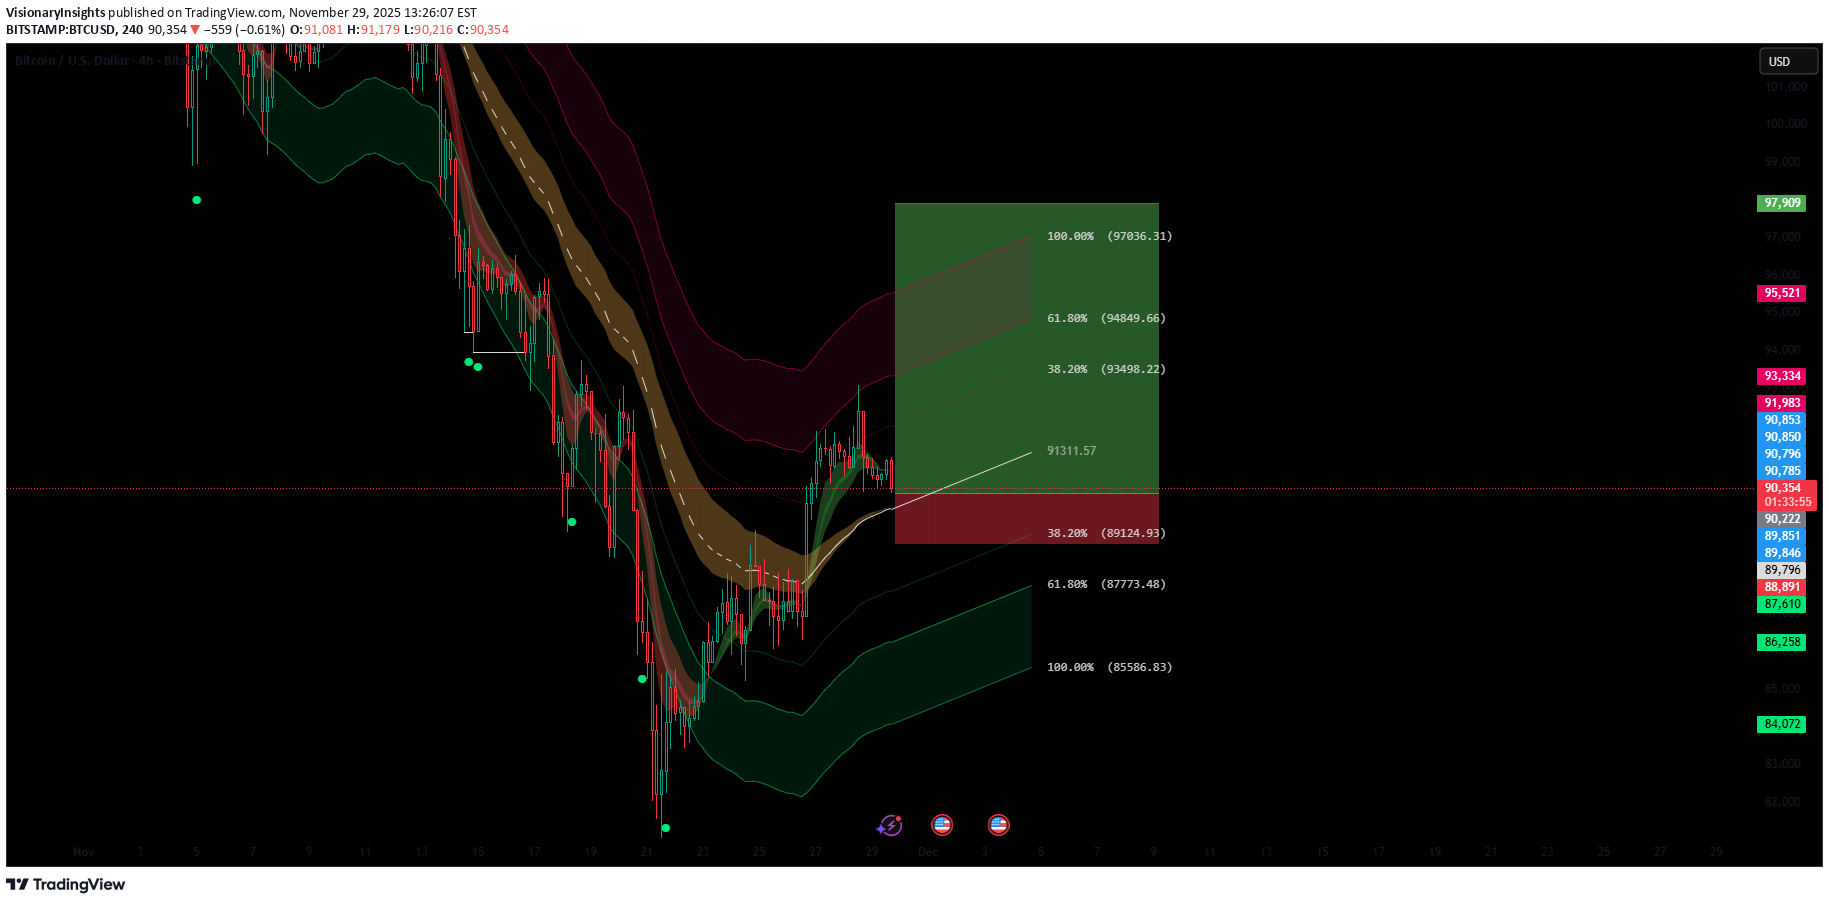
Bitcoin is showing a strong bullish structure on the 4H chart. Price is currently holding above the EMA ribbon and rejecting the lower band with clear buying pressure — a typical sign of continuation after a corrective pullback. 🔶 Bullish Confluences Price holding above dynamic support (EMA cloud turning green). Higher-low formation after the recent sell-off, signaling buyers stepping in. Fibonacci channel support respected, with price bouncing from the midline. Strong candle reaction from the 0.382 retracement zone, often a bullish continuation level. Upside liquidity sitting above 93.3k and 95.5k, attractive magnet for price. 🎯 Fibonacci Extension Targets TP1 – 38.20%: ~93,525 TP2 – 61.80%: ~94,876 TP3 – 100%: ~97,063 If momentum increases, price could push toward the 100k zone again, with extended targets beyond.
VisionaryInsights
سیگنال صعودی انفجاری PEPEUSDT: آماده جهش به اهداف فیبوناچی!
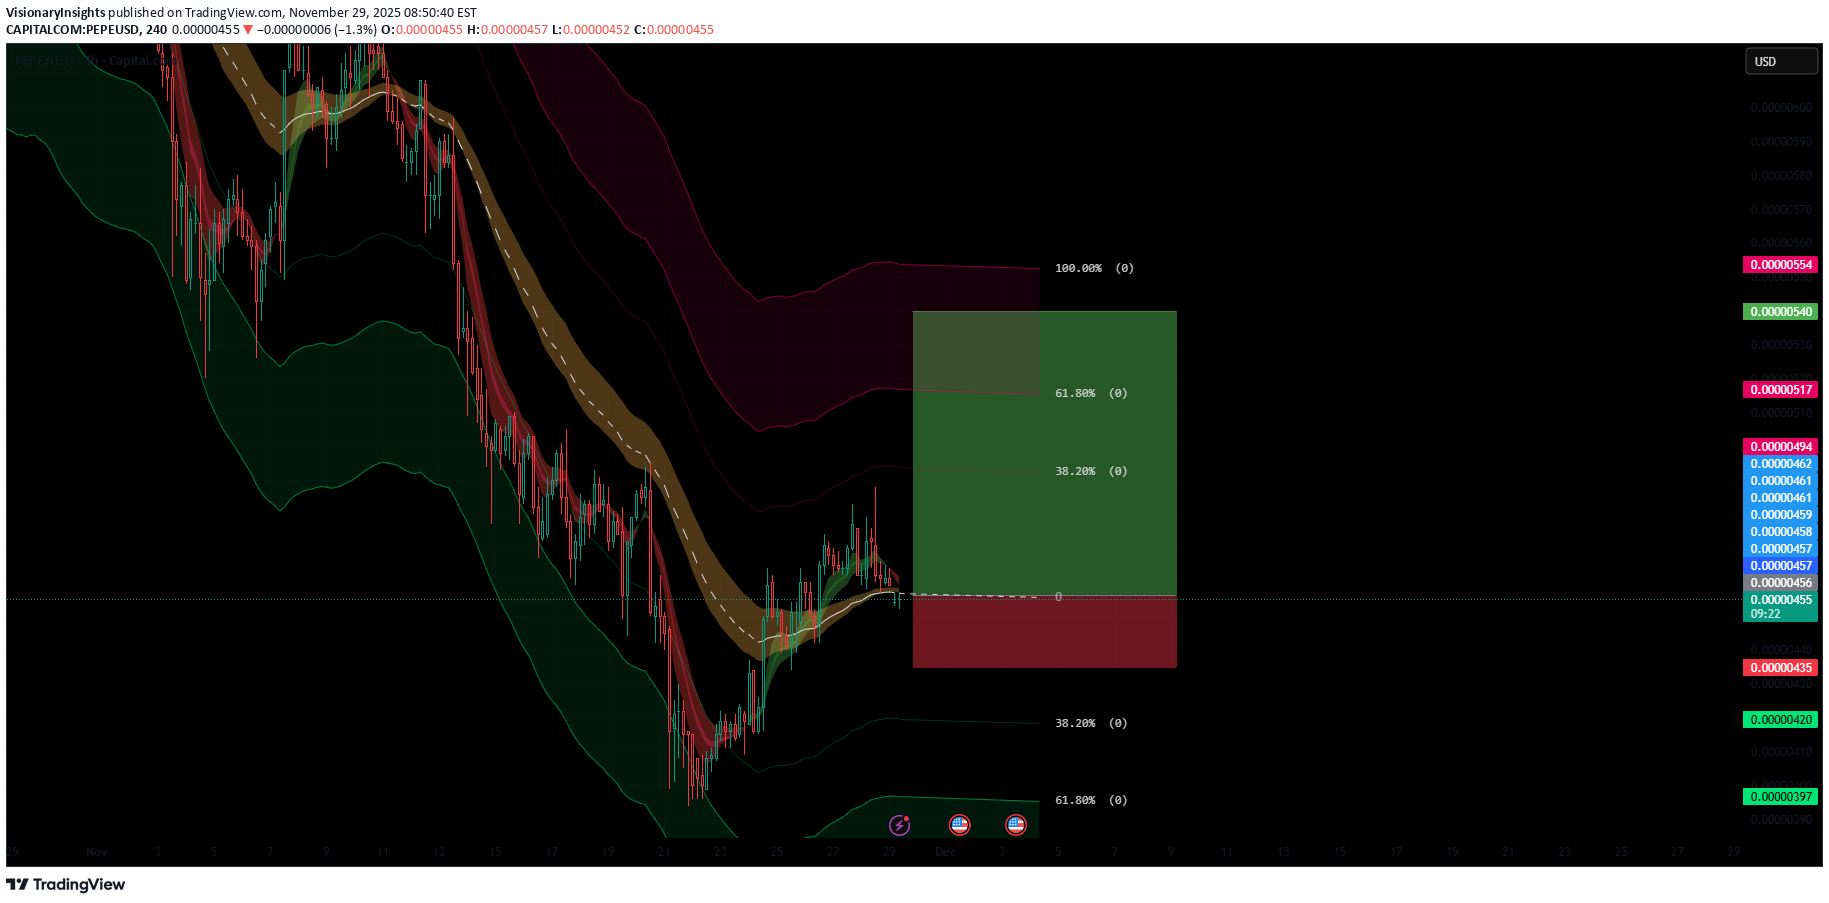
PEPEUSDT is showing early signs of a trend reversal on the 4H timeframe. Price has reclaimed the mid-band of the volatility channel and is holding above the short-term EMA ribbon – a key bullish confluence suggesting buyers are slowly regaining control. Momentum is shifting upward with higher lows building and volatility compression hinting at an upcoming expansion. I’ve aligned my targets with the Fibonacci extension levels: 🔹 TP1 – 38.2% Fib: ~0.000004948 🔹 TP2 – 61.8% Fib: ~0.000005176 🔹 TP3 – 100% Fib: ~0.000005400–0.000005540 zone As long as price stays above the lower channel support and maintains its ascending structure, the upside remains favored. A break and close above the mid-range resistance could accelerate the move toward the 100% Fib target at 54.
VisionaryInsights
بیت کوین در آستانه ریزش اصلاحی؛ سطوح کلیدی حمایت و اهداف نزولی (تحلیل 1 ساعته)
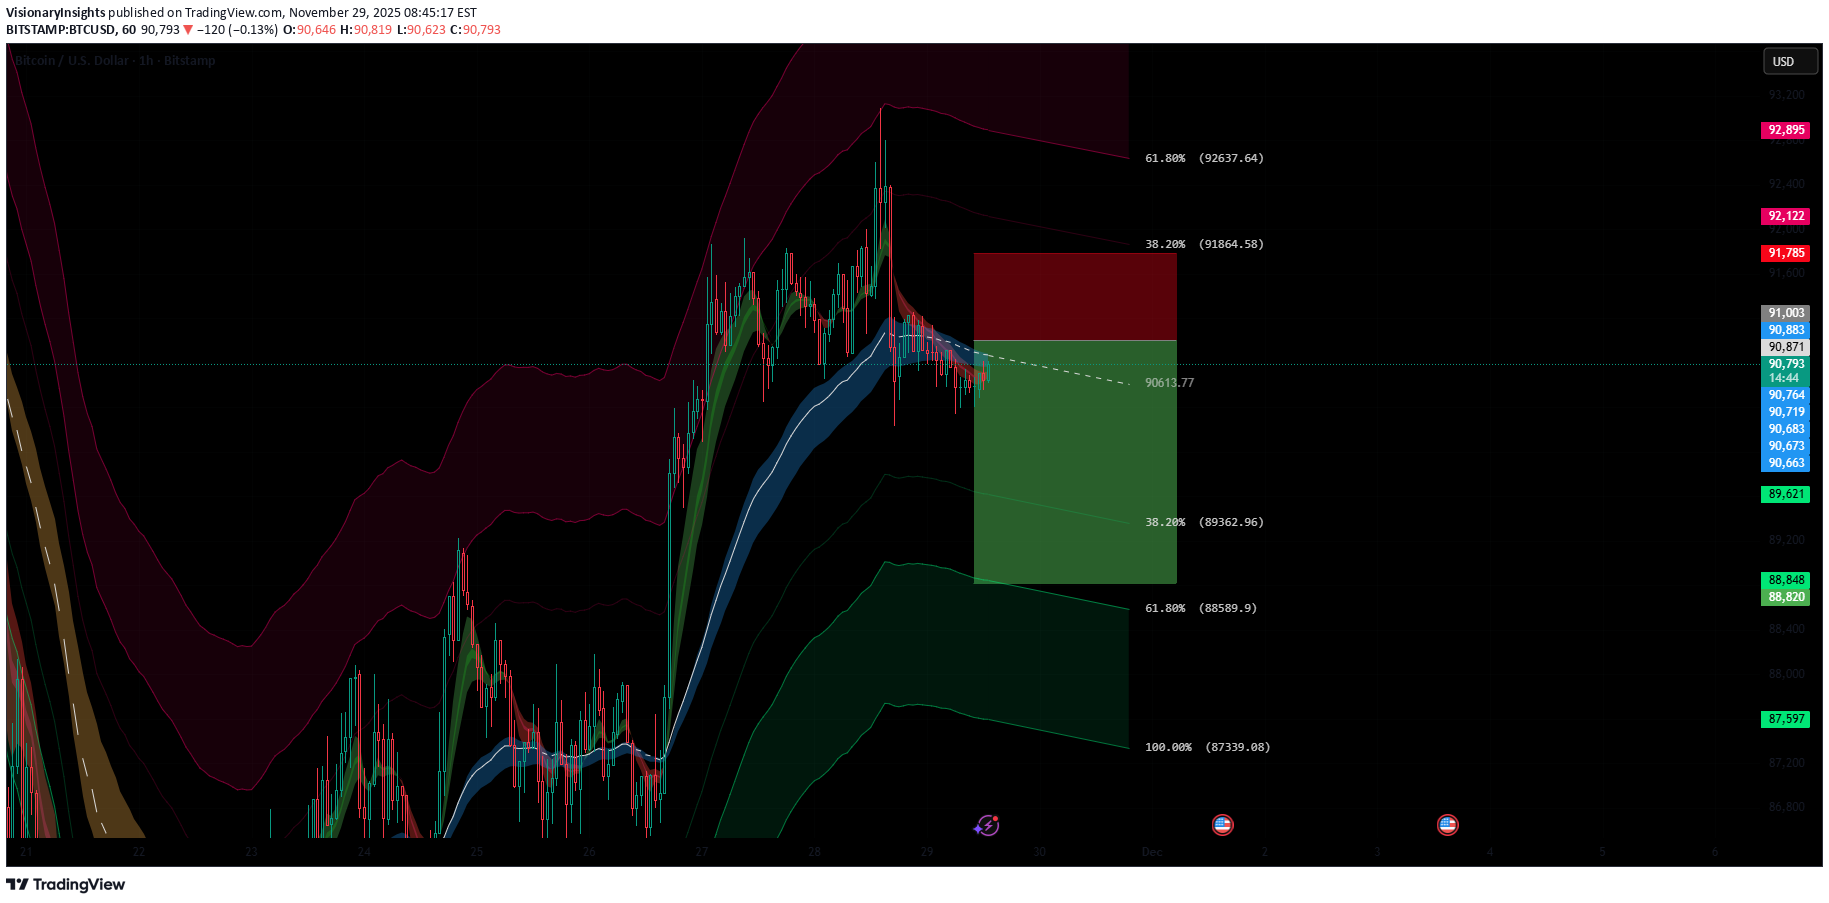
BTC is currently pulling back after rejecting the upper volatility band, forming a clear lower high on the 1H timeframe. Price is trading back under the EMA ribbon, signaling a short-term bearish retracement within the broader bullish structure. This cooldown is healthy and expected after the recent impulsive move up. Downside targets are aligned with the Fibonacci retracement levels: 🔻 TP1 – 38.2% Fib: ~$89,766 🔻 TP2 – 61.8% Fib: ~$88,923 🔻 TP3 – 100% Fib: ~$87,658 As long as BTC holds above the deeper Fib zones and maintains higher-timeframe structure, this move is likely just a corrective dip before buyers step back in. Once the retracement completes, a continuation to the upside remains the more probable scenario.As mentioned, this was only a corrective dip before going up again. It didnt go down that much
VisionaryInsights
بیت کوین در آستانه سقوط؟ اصلاح نزولی کوتاهمدت پیش از جهش بزرگ بعدی!
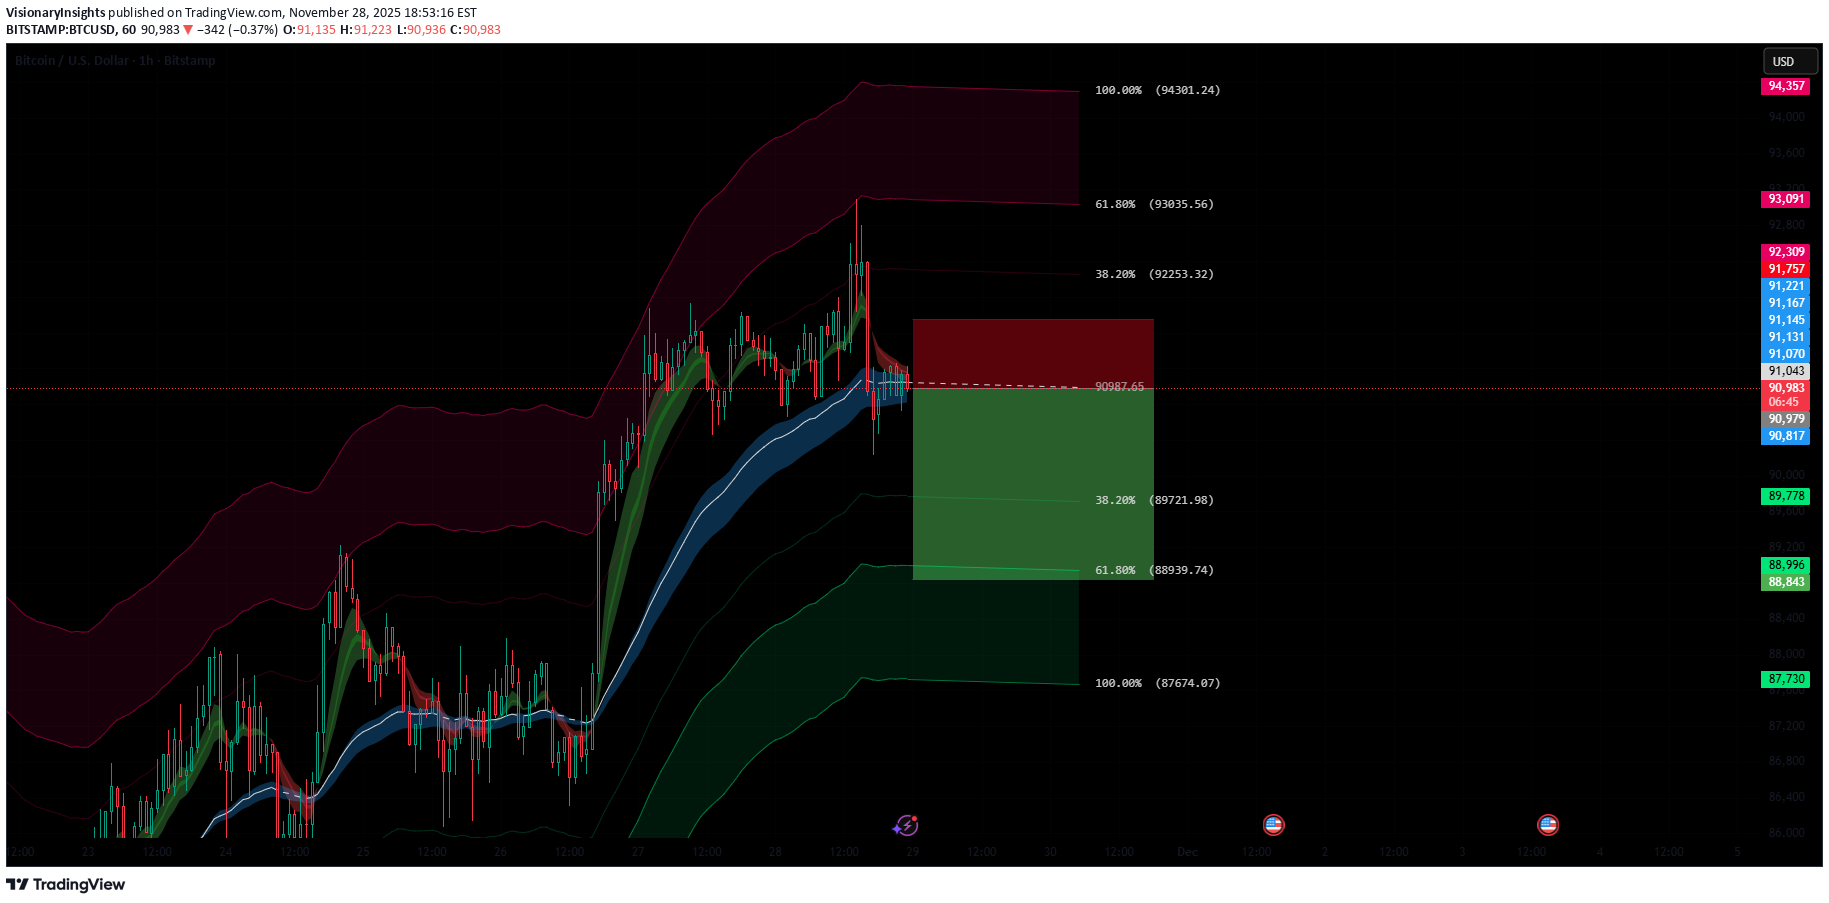
BTC is currently pulling back after rejecting the upper volatility band, forming a clear lower high on the 1H timeframe. Price is trading back under the EMA ribbon, signaling a short-term bearish retracement within the broader bullish structure. This cooldown is healthy and expected after the recent impulsive move up. Downside targets are aligned with the Fibonacci retracement levels: 🔻 TP1 – 38.2% Fib: ~$89,766 🔻 TP2 – 61.8% Fib: ~$88,923 🔻 TP3 – 100% Fib: ~$87,658 As long as BTC holds above the deeper Fib zones and maintains higher-timeframe structure, this move is likely just a corrective dip before buyers step back in. Once the retracement completes, a continuation to the upside remains the more probable scenario. If you value my work and find this analysis useful, you can support my content here: buymeacoffee.com/visionary_insights
VisionaryInsights
سیگنال صعودی قدرتمند پپه (PEPE) در تایم فریم 4 ساعته: اهداف فیبوناچی تا کجا؟
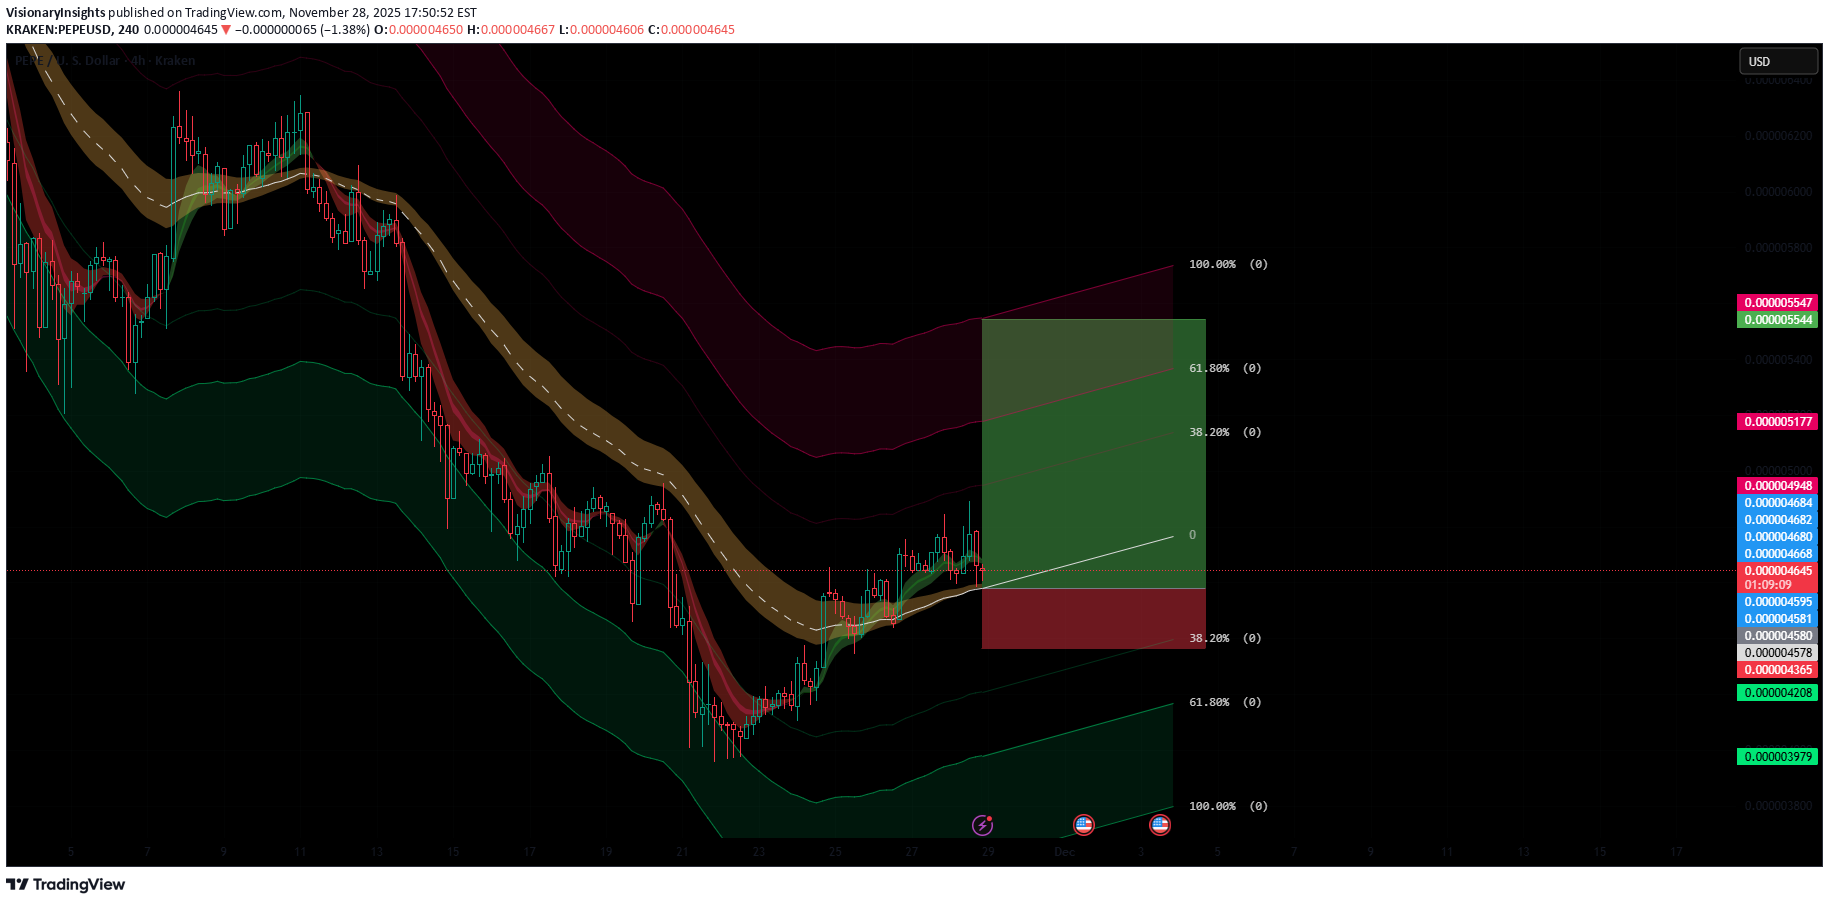
PEPEUSDT is showing early signs of a trend reversal on the 4H timeframe. Price has reclaimed the mid-band of the volatility channel and is holding above the short-term EMA ribbon – a key bullish confluence suggesting buyers are slowly regaining control. Momentum is shifting upward with higher lows building and volatility compression hinting at an upcoming expansion. I’ve aligned my targets with the Fibonacci extension levels: 🔹 TP1 – 38.2% Fib: ~0.000004948 🔹 TP2 – 61.8% Fib: ~0.000005176 🔹 TP3 – 100% Fib: ~0.000005400–0.000005540 zone As long as price stays above the lower channel support and maintains its ascending structure, the upside remains favored. A break and close above the mid-range resistance could accelerate the move toward the 100% Fib target at 54. If you value my work and find this analysis useful, you can support my content here: https://buymeacoffee.com/visionary_insights
VisionaryInsights
بیت کوین در آستانه انفجار صعودی؟ تحلیل ۴ ساعته و اهداف جدید قیمت!
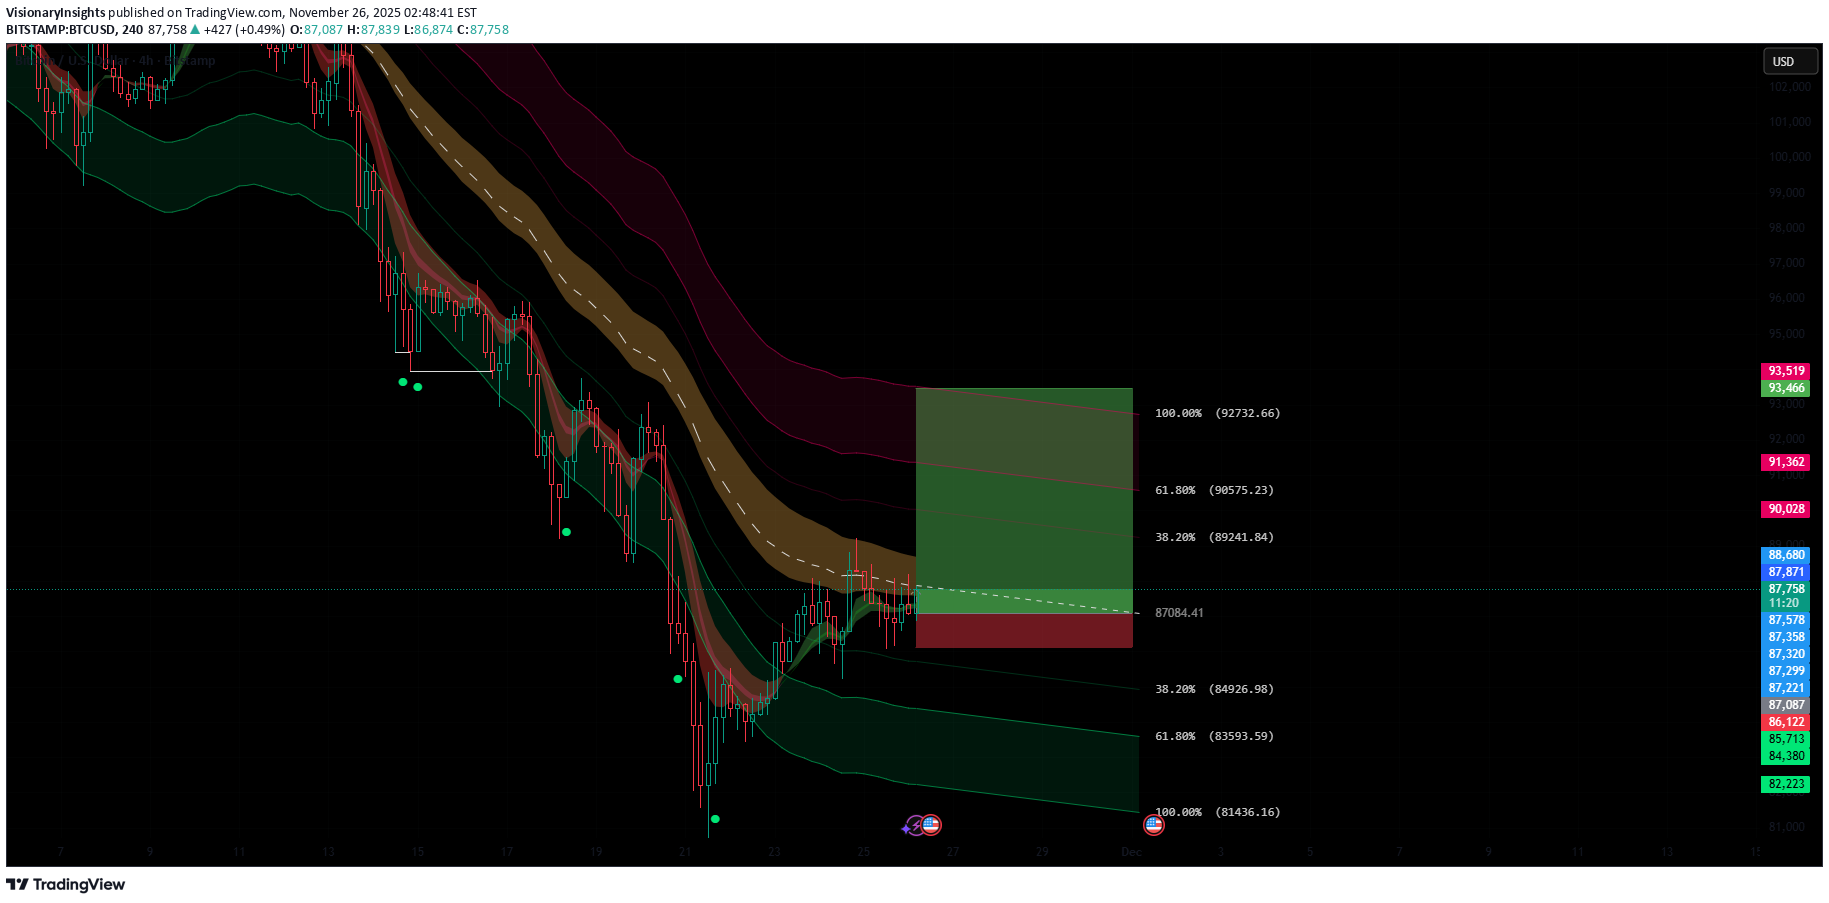
BTCUSD is showing early signs of a potential bullish reversal after reclaiming the mid-range of the channel and holding above key EMAs. Price is consolidating just under the dynamic resistance band, and repeated higher lows suggest buyers are gradually regaining control. 🔍 Bullish Confluences: Reclaim of mid-trend band with candles closing above the lower volatility ribbon. Higher-low structure forming after the recent sweep of liquidity. Momentum shift indicated by bullish reaction off the 0.382–0.5 retracement zone. Support confluence at ~86.8k where previous demand and fib structure overlap. 🎯 Fibonacci Targets: TP1 – 38.2%: 89,242 TP2 – 61.8%: 90,576 TP3 – 100%: 93,500 If price breaks and holds above the current compression zone, continuation toward the fib cluster at 90–91k becomes likely, with the final upside extension pointing toward 93.5k.Change SL to 85200TP 1 HIT
VisionaryInsights
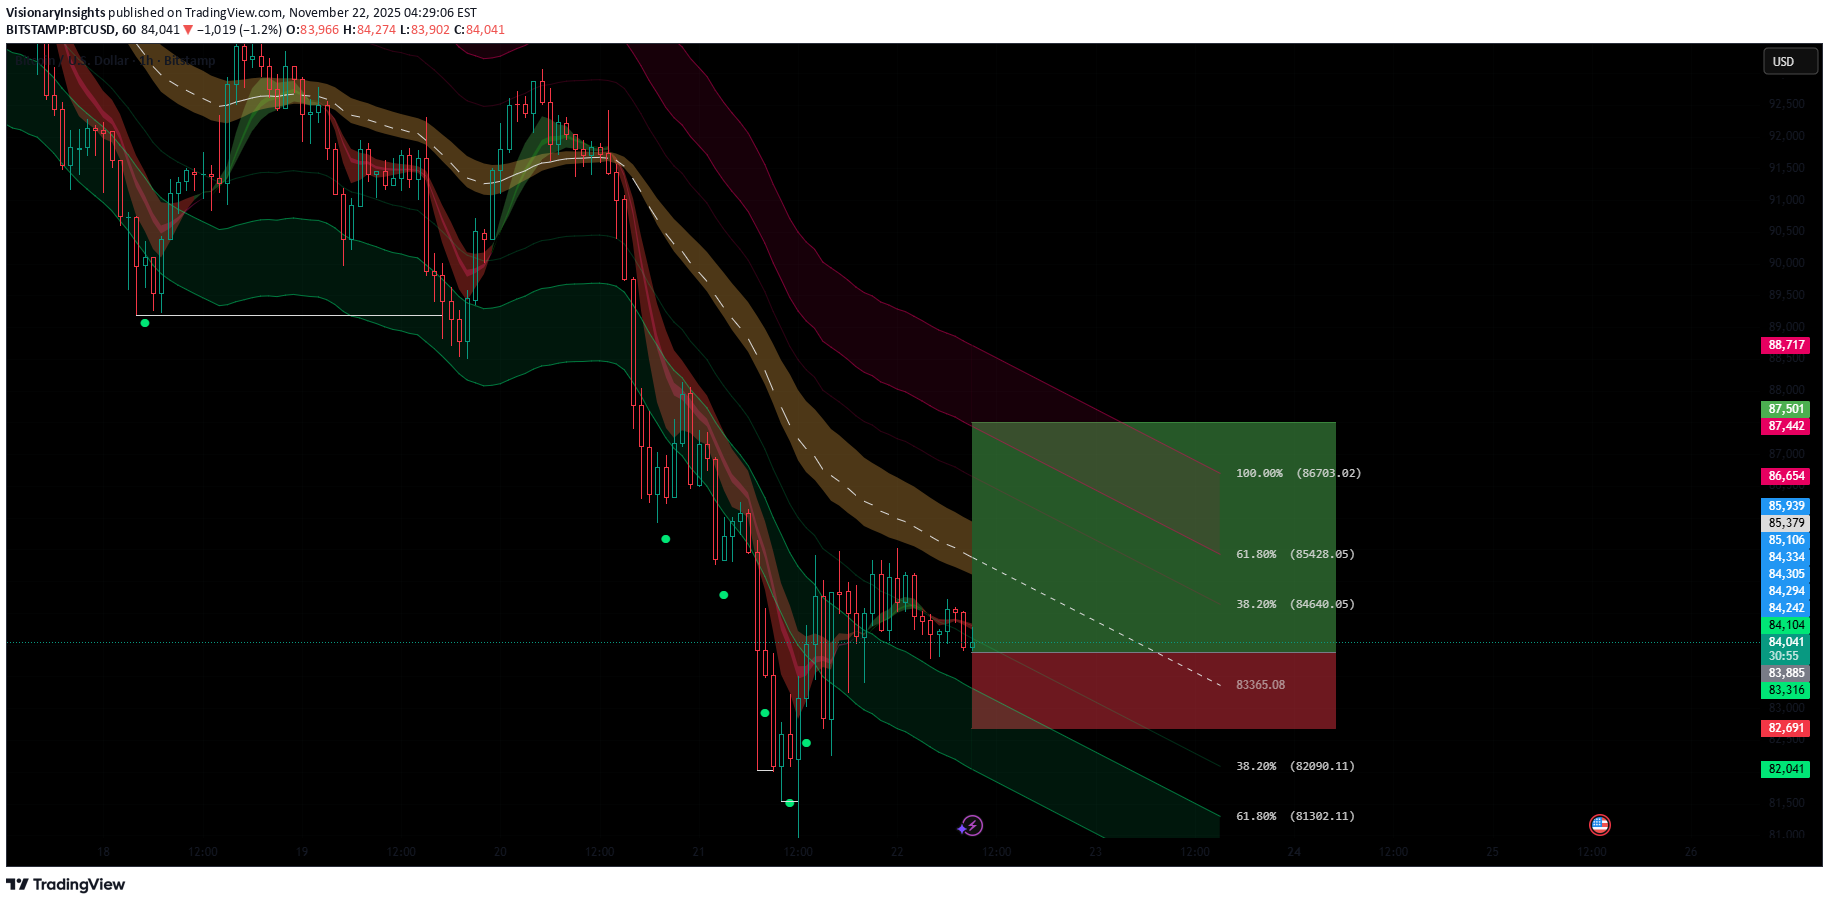
بیت کوین روی مرز انفجار صعودی: 4 سیگنال قدرتمند برای رسیدن به 91 هزار دلار!
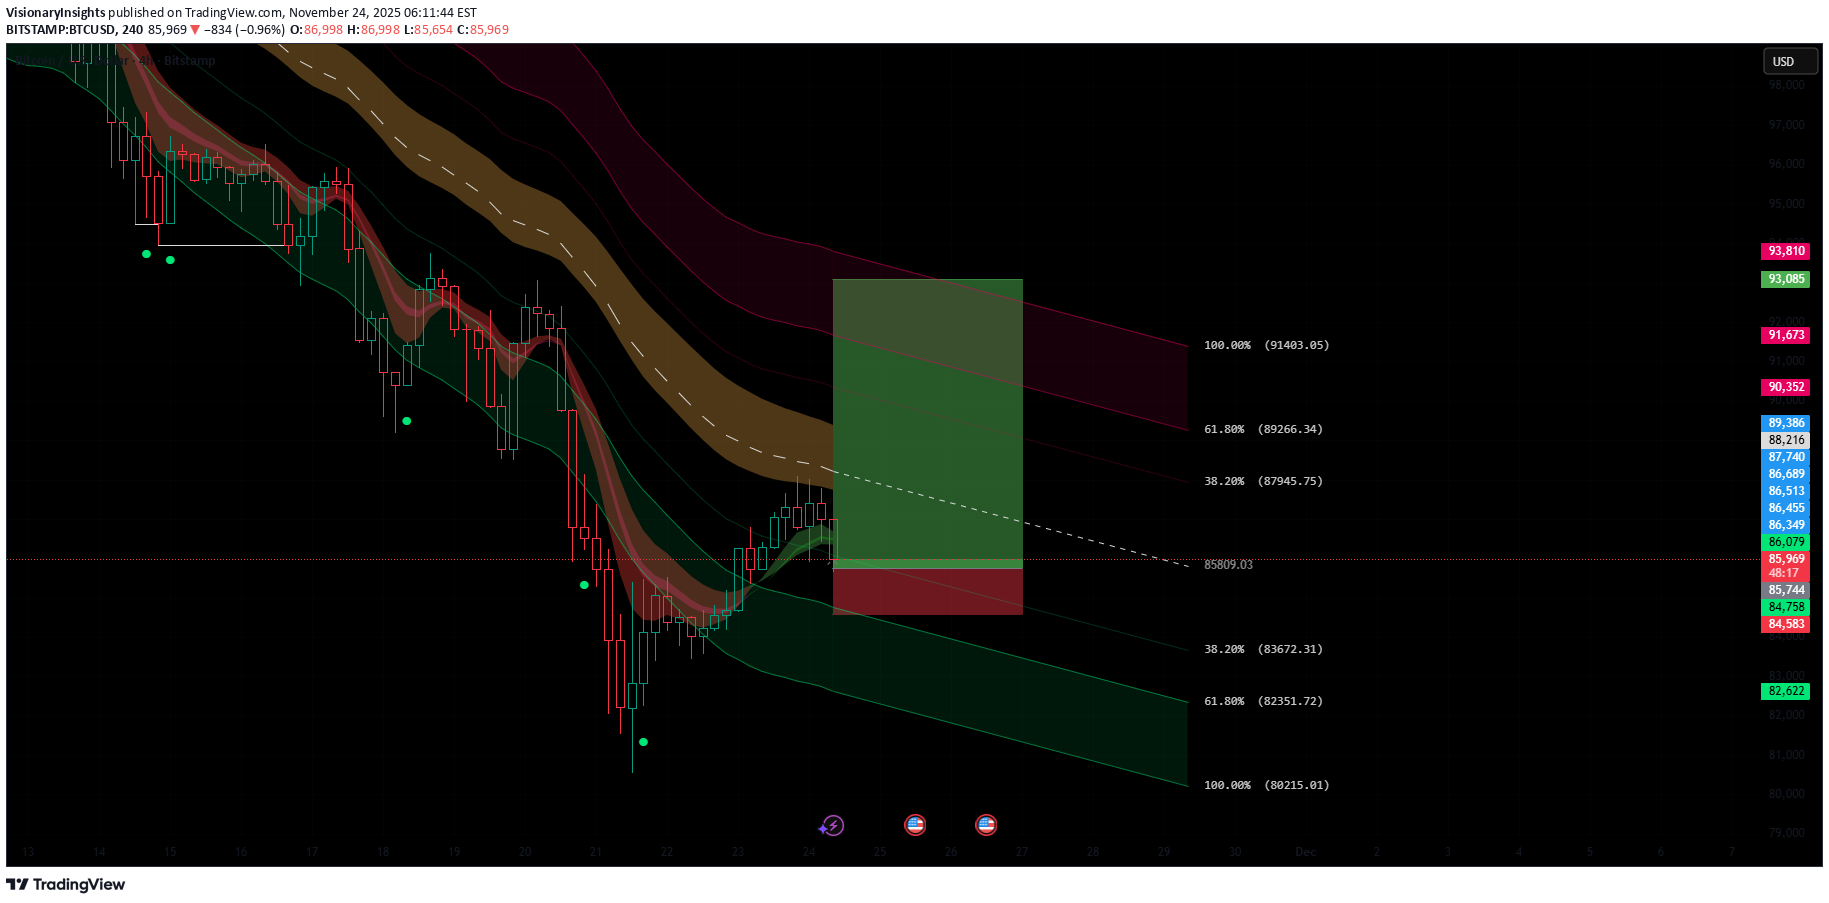
Price is pulling back into a key demand zone while holding above the lower boundary of the descending channel. Buyers are slowly stepping back in, and several bullish confluences are building: 🔹 Bullish Confluences Price rejected the lower channel and is attempting to reclaim short-term EMAs. Momentum shows weakening bearish pressure after a series of higher lows. Price is retesting the mid-channel zone, which often acts as springboard in corrective structures. The Fibonacci retracement from the recent swing displays clear upside targets lined up with channel resistance. 🎯 Fibonacci Targets 38.2% – $87,859 61.8% – $89,179 100% – $91,316 A break above the immediate EMA cluster could confirm bullish continuation toward these Fib levels. Invalidated if price closes below the recent local low.Closed manually at 87.2k. It will probably go to 84/83K first before going up again
VisionaryInsights
سیگنال خرید قوی بیت کوین: سطوح کلیدی برای صعود به ۹۰ هزار دلار!
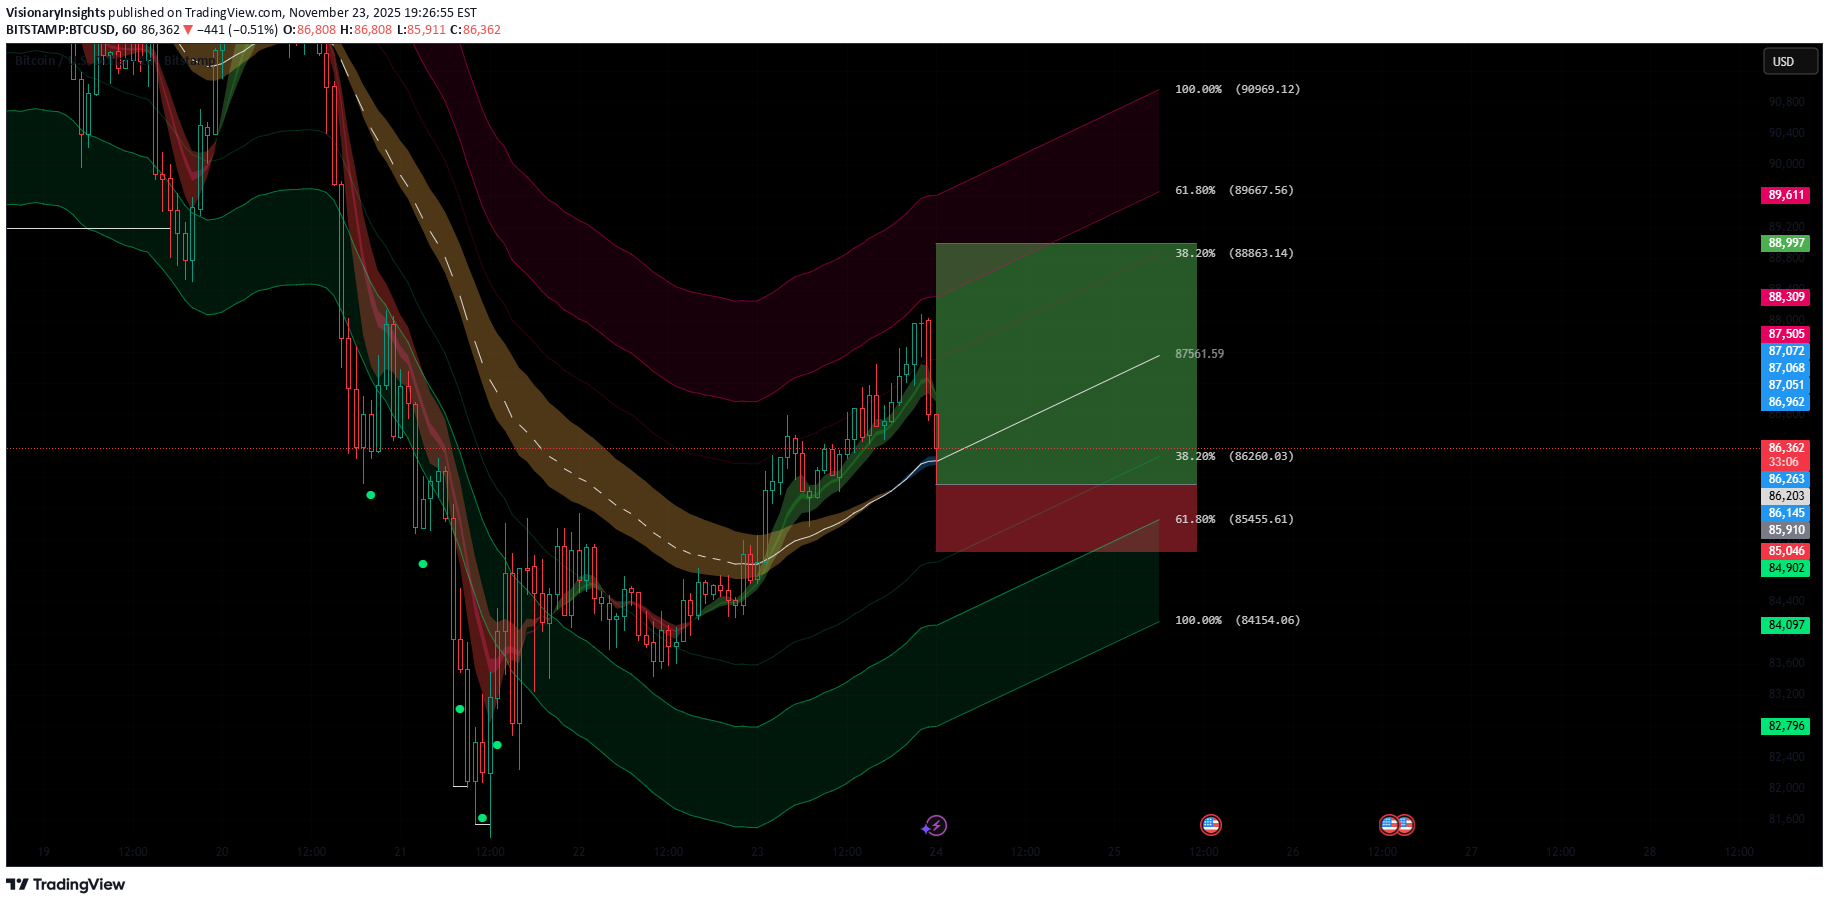
Price tapped the 38.2% retracement and reacted with strong buying interest right at the EMA cluster + mid-band support. The bullish structure remains intact as long as price holds above the 1H demand zone and the green volatility band. Bullish confluences: Bounce from 38.2% Fib retracement Price holding above dynamic EMA ribbon support Rejection from lower band signaling buyers stepping in Higher-low structure forming after the pullback Clear liquidity sweep below local lows Upside Fibonacci targets: TP1 – 38.2%: ~87,485 TP2 – 61.8%: ~89,590 TP3 – 100%: ~90,891 As long as the 1H support zone holds, continuation to the upper Fib targets remains in play.TP 1 HIT
VisionaryInsights
سیگنال فروش بیت کوین (BTCUSD) در 87.8k: آماده ریزش تا 84 هزار؟
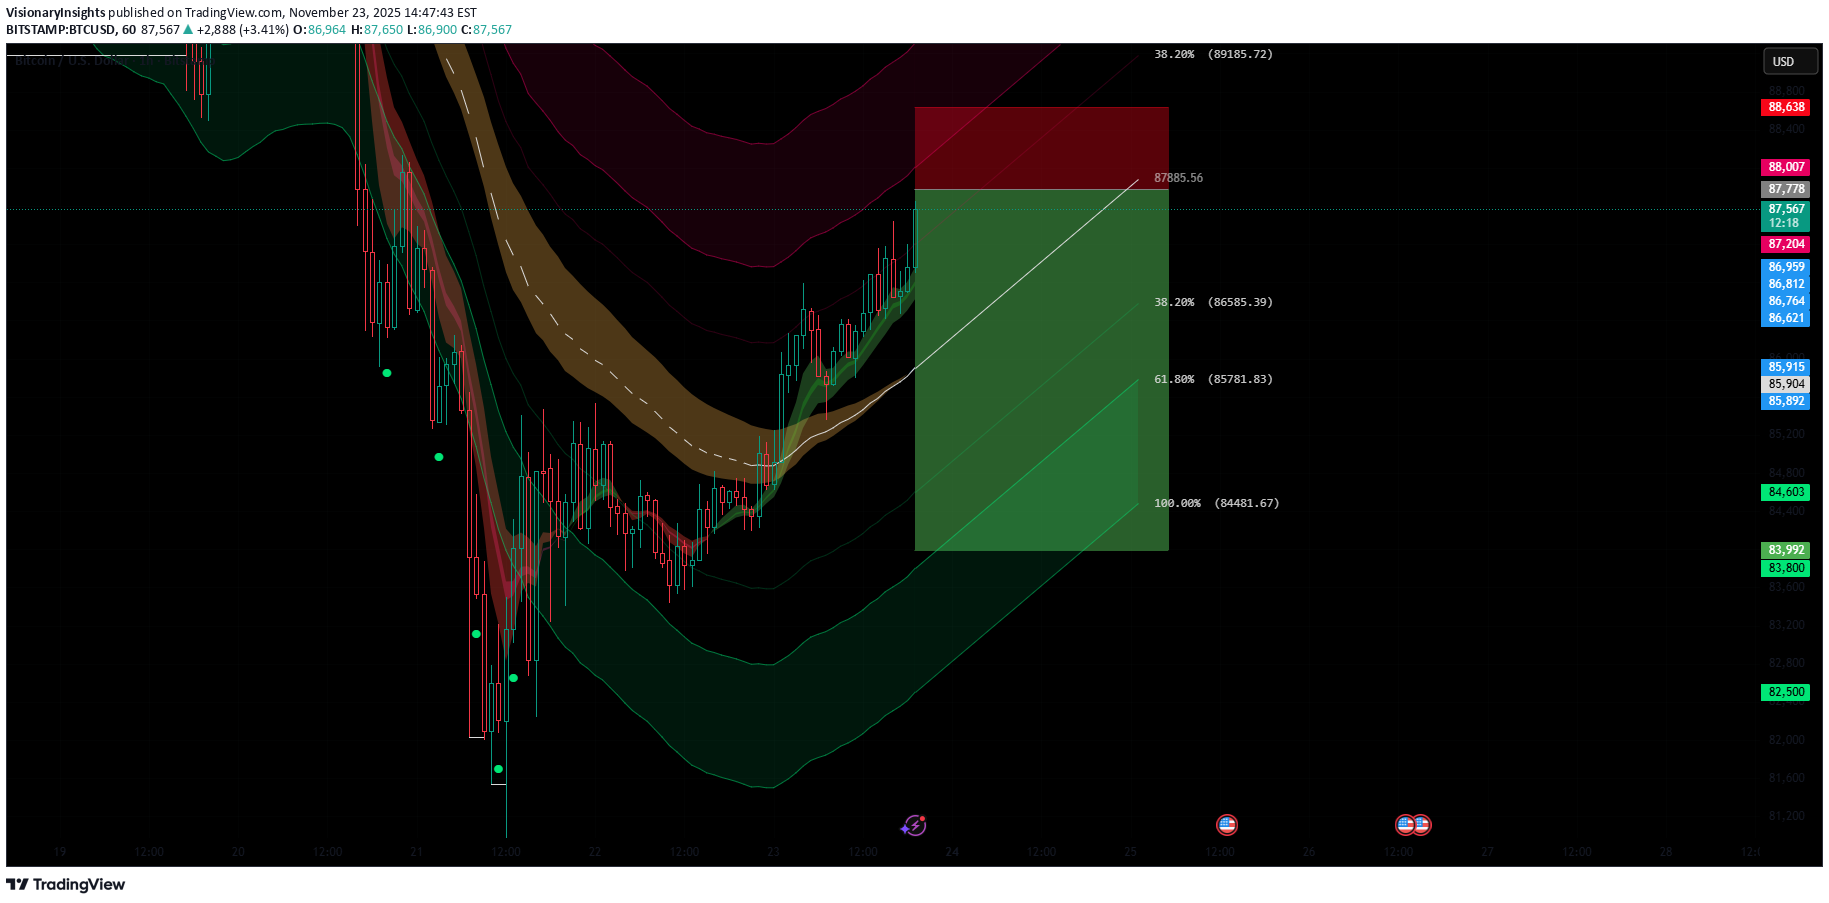
BTCUSD has pushed into a local resistance zone near 87.8k, aligning with the upper volatility band and showing early signs of exhaustion. Price is also interacting with the 38.2% retracement level, which often acts as a reversal pivot in corrective structures. Bearish Confluences Overextended into upper band resistance, historically a fade zone on this timeframe. Lower-timeframe momentum slowing, with smaller-bodied candles and wicks rejecting the highs. Fibonacci alignment at 38.2%, matching the start of prior impulsive sell-offs. Trend ribbon overhead still angled downward, suggesting broader trend pressure remains bearish. A rejection from the current zone may initiate a pullback toward deeper fib targets as BTC resets from its overextended push. 🎯 Fibonacci Targets TP1 — 38.2%: ~86,587 TP2 — 61.8%: ~85,784 TP3 — 100% extension: ~84,483 SL above 87,887TP 1 HIT
VisionaryInsights
بیت کوین در آستانه جهش: سطوح کلیدی برای صعود هیجانی به ۸۸ هزار دلار!
Price is showing early signs of a potential bullish reversal after sweeping liquidity at the recent lows and forming a short-term base. ✔ Bullish Confluences Price holding above lower volatility bands, showing reduced sell pressure and potential accumulation. Higher-low structure forming after the liquidity sweep, indicating a shift in short-term momentum. Attempt to reclaim mid-channel EMA zones, suggesting buyers are stepping in. Green momentum signals aligning with stabilized candle structure. 🎯 Fibonacci Extension Targets If price confirms a breakout and holds above the local EMAs, here are the next upside targets: 38.2% – 85,900 61.8% – 86,950 100% – 88,000 A confirmed break above the 38.2% level opens the path toward 87k+ and the full 100% extension. A clean break and retest above the 38.2% level would strengthen the bullish case toward the higher targets.TP 1 HIT
Disclaimer
Any content and materials included in Sahmeto's website and official communication channels are a compilation of personal opinions and analyses and are not binding. They do not constitute any recommendation for buying, selling, entering or exiting the stock market and cryptocurrency market. Also, all news and analyses included in the website and channels are merely republished information from official and unofficial domestic and foreign sources, and it is obvious that users of the said content are responsible for following up and ensuring the authenticity and accuracy of the materials. Therefore, while disclaiming responsibility, it is declared that the responsibility for any decision-making, action, and potential profit and loss in the capital market and cryptocurrency market lies with the trader.