
VictorCobra
@t_VictorCobra

What symbols does the trader recommend buying?
Purchase History
پیام های تریدر
Filter
VictorCobra
سقوط بیت کوین: آیا کف قیمتی ۵۶ هزار دلاری در راه است؟

Can't believe how long it's been since I last posted an update. Maybe this means the bottom is near. I'm going to make this concise - don't want to waste too much time here. Bitcoin has largely failed to sustain a SIGNIFICANT new all time high since the previous bull market. Volume is dominated by retail selling rather than buying. Bitcoin active addresses continue to stagnate at 2018/2019 levels. All the long term trendlines I had been looking at have now broken down. studio.glassnode.com/charts/addresses.ActiveCount?a=BTC&resolution=1w You can read up on all the reasons as to why I expected an outcome like this on my page. I don't feel like I have much to reiterate. I was incorrect in guessing Bitcoin would not sustain significantly above its last all time high, but when you factor in inflation and how much better a multitude of assets have performed since 2021...well, you can't say it's been much of a "success" for Bitcoin. MSTR has also now tanked below its last low, confirming a double-top. If Bitcoin follows suit, we can expect it to venture down towards the 200 Week Moving Average (light blue), which coincides nicely right now with the top trendline from the big broadening pattern that sent Bitcoin into its last bull run. This would place a "bottom" around $56-58K. For the swing traders out there, where's the next bounce? Well, right now would be a good technical spot for one. Anywhere between here and $83K - and price can venture back up to retest the 50 week MA (red) as resistance, which is currently above $100K. That is to say, it can bounce up to 25-30% and continue in a broader bearish trend. The current level also happens to coincide with the previous bull market top for the TOTAL crypto market cap: Though, looking at this chart, it seems like it could easily head down to $2.5T from here. And it's not a good look in general. I'm going to make a parallel post about the stagnating growth for crypto, where I'll get a little more into my real thoughts/feelings about this market. That's it from me! Thanks for reading as always. -Victor CobraRealizing I contradicted myself a little (annoying that you have such a short window to edit posts on here) by saying that I was wrong in guessing Bitcoin couldn't sustain significantly above its last all time high. What I mean is that I had guessed Bitcoin wouldn't be able to get much above $69K and stay there, but it did. Earlier, when I said it had failed to sustain a SIGNIFICANT new all time high, I meant that $120-130K is not that significant when factoring in inflation and other asset appreciation in the same timeframe.
VictorCobra
Litecoin, Shitecoin: An Opportunity

As much as I blast Litecoin, I think there's a trading opportunity here. Some other OG cryptocurrencies have gone up 5x recently - XLM and XRP, for instance. I don't mind this, because I actually think those coins are at least a little more viable as currencies than Bitcoin. I'm keeping this short. Just taking advantage of volatility. A 40%+ pullback with the potential of a 200% move? I'll take it. Here to have fun, not here to question things right now. Litecoin active addresses are stable around 300k, though having steadily moved up over the last couple of years from 200K. bitinfocharts.com/comparison/litecoin-activeaddresses.htmlBitcoin active addresses have climbed a bit recently up to 750K, after actually declining the last couple years. bitinfocharts.com/comparison/bitcoin-activeaddresses.htmlAs crappy as price behavior has been for LTC over the years, I like its growth pattern to an extent. It's important to keep in mind that while on a very slow long term uptrend, Litecoin has broken down out of its major long term uptrend (orange) This was why I had assumed more downside was to come. Given that LTC tends to pump last in the cycle, I'm taking a gamble on this thing flying back into the long term uptrend. There's A LOT of resistance overhead, especially at the broken uptrend, near $150-160 currently. Here's the shorter term structure, with some bullish arrows drawn. Taking out the recent low near $85 would be a bearish sign and could send price quickly back to $66 support. Let's see what happens. If the market has already topped, oh well. Risking a neglegable amount here. R/R seems decent to me.This meant for speculation and entertainment only.-Victor CobraLong 1x from $95.50Closed around $101 for profit. Don't really like the current structural weakness, especially for Bitcoin and ETH
VictorCobra
Bitcoin - Broader Structure and The $32K Breakdown Target

Last time, I posted an idea about Bitcoin's shorter term structure. I was scaling into a short position, and ultimately decided to close when I noticed strong support continuing to hold. This ended up being a good move, since price pushed higher towards 108k. There's a lot of resistance here in the low 100K range. While a notable milestone, it's a hefty price. More and more, Bitcoin is being seen as a tool for exploitation and wealth concentration for the wealthy, rather than something for the masses. Although good for price, this is not in keeping with the original intention behind the technology, or so we are led to believe. I tend to generally post short ideas now because I do not support buying Bitcoin, which serves only to enrichen a select few, and no longer benefits the little guy. Sure, it could benefit ME in the future, but that feeds further into greed and selfishness, which are the human flaws at the root of many market inequities, fallacies, and injustices. For more on why I changed my perspective on crypto, there are tons of ideas I've posted over the years to pull from. It essentially boils down to this: When I was young and naive, I believed crypto could be an escape from the established financial system. In many ways it is, if you like gambling on memes and adrenaline coursing through your veins. But on a broader level, it's been co-opted by the same forces that control our traditional markets, institutions, and to an extent, our wellbeing. More and more, crypto seems to fit into a neo-feudalist dystopia, rather than a free-flowing renaissance utopia. Earlier this year, I closed my original short positions when it seemed likely for Bitcoin to surpass its previous all time high. Now that price has hit a major milestone, altcoins have gone up 500-1000%, and gloating is abounds, it's time for me to re-enter my short. Now, I'm not looking to profit massively from this. It's a small position. But, I am of the belief that there is a non-negligible probability that Bitcoin will enter a longer term bearish trend. Whether it's now or at 160k, who knows? If this trendline can break decisively (it's held very well so far, even when price drops below), the next stop seems to be around 89k. From there, a bounce would be bullish. My green arrow shows the possibility of rally resumption if that level holds as strong support. On the bearish side, the previous all-time high is the next major level, followed by 32k if the entire support structure falls apart. Markets are starting to wake up and understand that inflation isn't going away quickly, and monetary policy won't be as easy as it was. A lot of fluff needs to get weeded out. Unfortunately, crypto doesn't have much SUBSTANCE to it (meaning goods, resources, and services) attached to it.As always this is meant for speculation and entertainment only! Thanks for reading. -Victor CobraShort from 103k
VictorCobra
A Litecoin Swing Trade

Markets have been understandably battered over the last weeks. Current conditions are why I've generally been cautious about trading, and not getting married to long positions. As I explained in my last Litecoin analysis, things are precarious. The good thing is, I got out of my trades with a little bit of profit and no losses. The bad thing is, entering long right now is a bit scary. We cannot predict economic conditions. Instead, we can use sentiment. Sentiment for altcoins is totally in the gutter right now. Based on this alone, a bounce makes sense. On the weekly chart, Litecoin is (so far) holding the 50 and 100 moving averages, while it broke below the 200. To look bullish on bigger timeframes, price needs to at least stabilize here and begin slowly moving up to allow the MA structure to bullishly support price (a weekly golden cross would be a start).This play is simple - buying at support here between $86-94 and selling at resistance, near $106-107 (conservatively). If price makes it back up there, I will observe conditions to determine whether an additional leg up seems likely. If price is rejected heavily up there, it could point to another leg down. I'm also watching whether Bitcoin can break back above its 50 and 100 day moving averages. Litecoin is unlikely to have any explosive ATH moves if Bitcoin cannot at least get back above $90K and stay there for a while, I think. On the downside, taking out the $80 level would set up price to fall back towards $50-66, and it may take a long while to recover. I may stop myself out if that happens and aim to rebuy near $66. Litecoin has experienced steady (though not explosive) growth. This seems somewhat attractive to me when it comes to crypto. While I wouldn't be surprised to see this entire market fade in the future and be forgotten as an investment, this one at least sees some steady user growth. This post is to show that even though I remain largely bearish on crypto, I am open to trading opportunities that present themselves, even if they are narrow in scope and focus on one cryptocurrency. This is not meant as financial advice, but for speculation and entertainment only! Thanks for reading :) -Victor CobraBought at $87.50 and $93.50Stopping myself out here, minimal loss since I had an entry also at $87.50. Judging entirely on Bitcoin here: Downtrend not breached, strong rejection, possible lower test coming up. Stocks also have failed to really get above pre-election levels.
VictorCobra
MSTR is Back To Dotcom Boom Levels...Finally. But At What Cost?
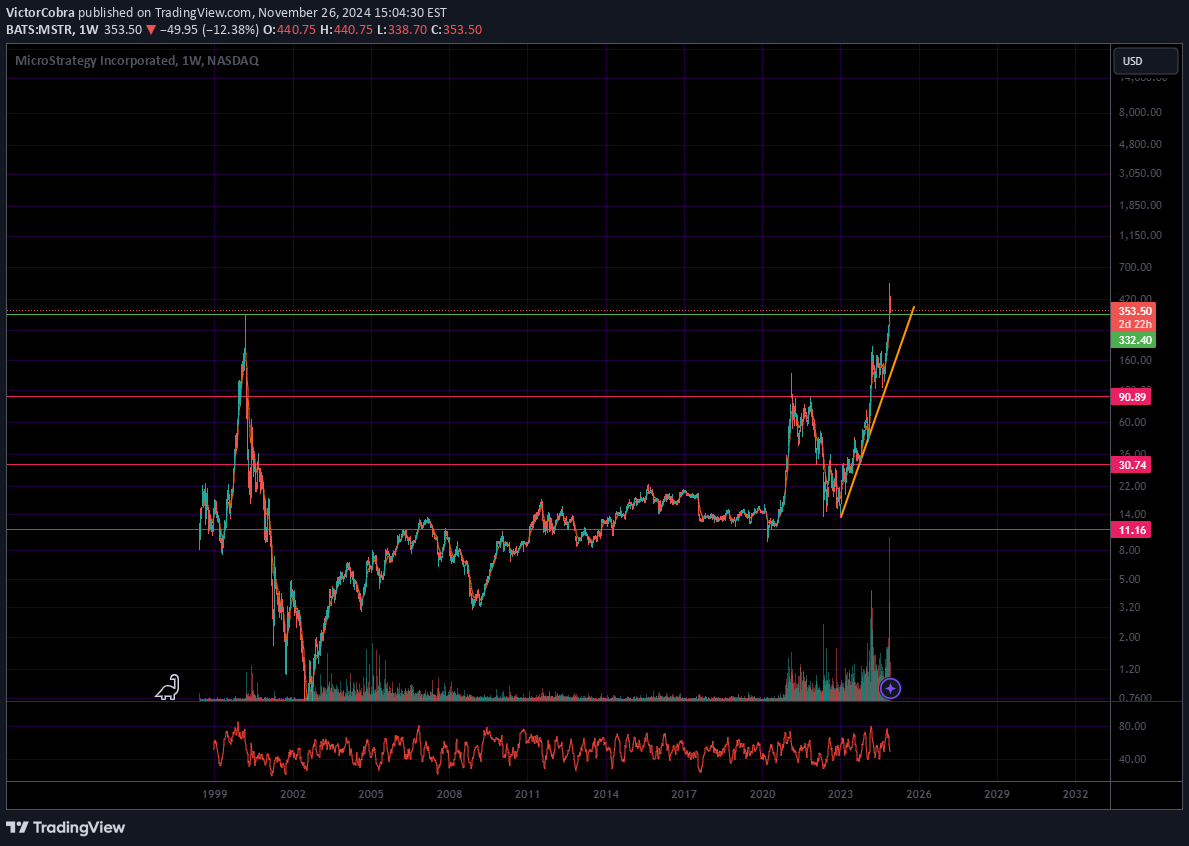
Self-explanatory chart. I called a major top for Bitcoin and Microstrategy back in 2022, detailing the possibility of much lower prices for both. This ended up being correct, but only in the short term. Since then, both BTC and Microstrategy have surprised me to the upside. It's incredible that only now has MSTR reached a valuation it has not seen since the year 2000. Look at that volume! Mania levels. Microstrategy now owns 386,700 Bitcoin, almost 2% of the entire 21 Million maximum supply. This is triple the supply ownership from 2022, when it was just over 100,000. That's triple the risk. What could go wrong? It's impossible to know when this could all go up in flames, but I'm certainly ready to watch when it happens. These kinds of price moves and buying behavior are not sustainable. It is also starting to rub more and more Bitcoiners the wrong way - "this is not how it was meant to be!" Meanwhile, Saylor continues to enrichen himself and shareholders. Not to mention, there is now at least one leveraged MSTR ETF. Again, what could go wrong? Some people have made a killing on this though. Congrats to them. Now it's time to take at least some profit. On the above chart, a breakdown from that orange trendline should indicate a top. Let's see how it all unfolds. If price manages to hold up here, perhaps there will be at least one more leg up. As always, this is meant for speculative purposes only. As shown throughout my work on this site, it's really easy to be wrong. I just find the guesswork part of the fun. Thanks for reading! -Victor Cobra
VictorCobra
Well, Well Well, Can Bitcoin Sustain Its New All-Time High?

It's been a while, TradingView. I've really stepped away from markets for the most part to focus on other things. It's been quite refreshing. This won't be long. I'm popping in to share a couple of quick observations. For one, Bitcoin has managed to break out to a new significant ATH, so far a little under 30% above the previous high around 73k. My speculation has long been that Bitcoin is unlikely to SUSTAIN a significant new all-time high above the previous bull-market high near 70k. This is close to being invalidated. Full invalidation would require Bitcoin to just keep going, and 100k is the next clear hurdle. Right now, it's encountering some resistance, just 5% from that major target. Keep in mind, Bitcoin, is not really outperforming major stock indexes (yet). It's simply caught up after a period of underperformance. The recent upswing in price seems to have been catalyzed by Trump's second election to office in the U.S. Interesting, considering he used to look down on cryptocurrencies and suddenly flip-flopped during his recent run for office. This seems to be a bit of an emotional and speculative reaction from investors. Buyers expect further price appreciation with increased adoption and decreased available supply. "Adoption" simply means buying and holding these days, not using it as a currency. This is clear when looking at this graph: studio.glassnode.com/metrics?a=BTC&m=addresses.ActiveCountBitcoin active addresses continue to stagnate. People are just buying and holding, and it is often the same entities doing so. The ETFs skew this data as well, since these coins are held in concentrated addresses, even though many more people may be holding "Bitcoin" through an ETF. That brings me to something else: Options. Now traders can exercise options on Bitcoin ETF's. This is dangerous, and I think should be treated with some caution. This can increase the amount of price manipulation, as if it wasn't already manipulated. As for me, I closed my shorts at a loss around 63.8k. I saw that Bitcoin was unlikely to drop further, and instead break out of its flag formation to the upside. This ended up being the safer move. Now, I've slowly begun scaling back into a short. I've added at 89K, 93k, and now 94.8k. The chart is demonstrating some divergences. The Ultimate Oscillator is actually declining as price goes up. Today's "breakout" is so far on meager volume, but my guess is that this increases should price continue towards 100k this week. In the above chart, confirmation of a local top might be the breakdown of my orange trendline. If price stalls here, it can fall all the way down to the breakout point (the long broadening wedge) It can also simply fall as shallow as $82-83k and then resume its climb. Long term, I'm not a fan of this asset as it represents something dystopian and sinister to me these days. I acknowledge it doesn't represent this to everyone. Regardless of your position on Bitcoin, I wish you luck!This is not meant as financial advice and for speculation only! -Victor CobraBitcoin went up a little higher before correcting. Added a little to my short at 98.6k or so. Overall, I'm now in profit, but it may be short lived. There is a confluence of supports from here down to 89k. Here is the current structure:You can see that Bitcoin broke down from the most recent rising support, slowing momentum a little for the time being. The light blue trendline is actually the reclaimed broadening wedge support from the yearly structure. If Bitcoin corrects more deeply, that's an area to watch for demand.You can actually see that this rising wedge pattern has been forming for roughly TWO YEARS. Zoomed way out, you can see that failure to sustain this rally could result in a pretty quick throwback. On the other hand, bullish traders can aim for the top of the wedge, giving a price target potentially above 200k. 200k would still only be slightly less than 3x the previous all-time high.Added to short at 95.3k. Showing signs of exuberance, especially in altcoins. It would honestly be hilarious if Bitcoin just never breaks 100k convincingly. But, there is a substantial chance it does. Just maybe not yet. Here are bearish and bullish projections, based on the broadening structure.So, Bitcoin is finally above 100K. This had been prophecied by many a trader the previous two cycles. Now we're finally here. So let's dive in. Just above 100k, there are likely a lot of longer term orders waiting to get filled. But, once those orders clear, there could be blue skies ahead, at least for another 30-50% upswing. However, there are some bearish considerations (and as someone who doesn't want to bet on this asset's upside, I'm generally taking short positions). I am not adding to my short here, but would add if we do see that 30-50% upswing. There's a possibility of a top here, if price cannot push above that broken uptrend (orange). There is also a bearish divergence brewing on the daily chart.Welp.A break below this uptrend and we could get another selling cascade. The next major support would be in the $89-90k region.That blue trendline is also important to watch.This trendline has been really hard to break. Let's see.Can't believe trendlines still seem to work, even with all this AI-based strategy entering the markets.We'll see if this breakdown gets bought, like the last one.Wow, no single 15 min candle has been able to close below. Still strong buying behavior.Closed out the short position. Support continues to hold. May want to test higher levels - perhaps up to that top trendline, currently near 111k
VictorCobra
ETH - Reclaim $3K Or Else

I've spoken for a while about Ethereum's relative weakness. It continues to break down from long term uptrends. If price doesn't reverse this week's candle back to the upside soon, I think ETH is in danger of entering a longer term bear market, leading to sub-$1000 prices once again. More specifically, from a moving average and structure standpoint, I think ETH must reclaim the 3k level with confidence, or risk total free fall. I don't need to spell out all the reasons I think crypto is NOT going to change the world for the better or be "disruptive" in a meaningful way, but I've exhausted all of my writing steam on the matter. Some new environmental factors have emerged, however, which are much in line with what I've been concerned about over the last several years. We can clearly see from a Macro standpoint that growth is stalling. Local governments and isolationism are starting to gain preference over globalization, in a large see-saw effect. In addition, Trump has further tarnished whatever neutral reputation crypto had gained on the global stage. I think institutions are even less likely to take this market seriously now. There's pretty much air beneath here. The crypto TOTAL market cap is now testing the highs from the previous bull market. It really should hold up here to avoid catastrophic damage: TOTAL2 (altcoins and stables) is well below its previous all-time high, showing the potential for a truly failed bull market if things don't bounce around these levels. ETH/BTC is already in free-fall mode. My guess is new lows for the ratio (below the 2019 levels) Anyway, that's all from me. I won't be as long-winded as I used to be. Thanks for reading! As always, this is meant for speculation and entertainment only, and not as financial advice. -Victor Cobra
VictorCobra
ETH Extreme Weakness - A Warning Sign

Since my last update on this chart, Ethereum has broken its long term uptrend and dropped almost 40% in value. This was back in May of this year: Zoomed out, you can see the failed long term trendline. Obviously, a break back above it would be a bullish sign, but there's a long way to go, as it's currently around $4,000. Right now, it rests on its 200 and 100 weekly moving averages (teal and yellow on my chart). There really isn't much support below here at all until previous bear market lows, near $1,000. In contrast, Bitcoin has a long way to fall before arriving in the same position. This is not unlike the previous cycle, where ETH bled significantly on its ratio against Bitcoin. For crypto bulls, this may be a good sign. However, there is still plenty to fall on the ETH/BTC ratio after making a macro lower high: There is no support on the ETH/BTC chart until lows not seen since 2020. It doesn't bode well for the #2 cryptocurrency, as it was unable to make a new high against Bitcoin. This means it is unlikely to outperform again on longer timeframes. This isn't a great look either, given the new ETH ETF's. I have no intention of buying ETH again, after making significant profit from 2018-2021 (buying around $100 and selling near $3,000). Can't complain about those gains at all, especially as its price hasn't managed to really hold above that price point this time around. On the bullish side (in the short term) if price continues to hold here, there could be a corrective wave up towards the 50 week MA near $2,800 (red). As for Bitcoin itself, the 200 week MA is a little below 40k at present. Let's see if price can break down from the current support at the 50 week MA (red). If support continues to be held here, it is likely to hold for ETH as well. Now, what about this rate cut tomorrow from the U.S. Federal Reserve? Given retail sales and the apparent strength of the economy, it seems fairly likely that 25 bps will be the decision. Now, investors and other market participants are quire wary of other economic data, which could easily signify a recession. Markets have been volatile in recent weeks. The Fed must tread carefully. If they cut by 50, it could signal to investors that they tightened too far, and are taking greater steps to curtail a recession. This might spook the market. My guess is that even with the 25 expected bps, the market will have the same lackluster reaction, particularly as it's not a meaningful rate reduction. Either way, I don't think the market will be pleasantly surprised enough to cause a significant bump up, essentially making tomorrow a "sell the news" event. We'll see though! Perhaps it really is that simple: rate cuts=more liquidity for a pump. This is meant for speculation only! Thanks for reading. -Victor Cobra
VictorCobra
Even if This Isn't Distribution, Consolidation Could Take Months

Just popping in for a quick Bitcoin update. Though cycle proponents will be quick to point out that Bitcoin is way ahead of where it "should" be, price wise compared with previous cycles, it's still struggling to maintain a new all-time high despite supposed institutional interest. People who have been in the market for years are starting to want out, expressing the sentiment that this is going to be their "last cycle." Meanwhile, stocks are significantly up since their last all-time high and some high-performers like Nvidia have well outperformed Bitcoin over the last few years. Bitcoin's price currently looks like consolidation after an explosive move up from the bear market lows near 15.5k. It's taking so long that price is beginning to drift below all the major daily moving averages. Ethereum is really looking quite weak, having retraced all of this year's gains and broken below a major long term trendline. On my Bitcoin chart, price is hanging out below the large broadening support, dating back to fall 2022, now almost two years ago. It's below all the major daily moving averages, representing current weakness. Seller volume remains generally high in this range. I drew a secondary trendline and another broadening pattern, this one pointing down. Historically, this can be a bullish pattern. Even if it is, there appears to be plenty of room structurally for more sideways movement into the fall. The pattern comes to completion by the end of the year. This is an example of what I'm thinking, for bullish and bearish options: Bulls hope that consolidation this long produces a major move up, perhaps all the way to 300K + and to the top of the broadening pattern. This sounds crazy, but it's roughly the same magnitude of price increase as the last bull marker. Though, due to diminishing returns, this does really seem unlikely. Of course, this is a lot of foo-foo guesswork, but understanding charts visually has always been how I like to roll. Fundamentals are then also important. On the bearish side, a breakdown from these patterns could easily send prices back below 40k. Let's see how things play out! I'm still betting on crypto largely becoming a forgotten "industry" due to lack of authentic utility and therefore little fundamental value. Even though ETFs exist, ETFs exist for many things. I don't think investors are necessarily prepared for the slow fade, where Bitcoin and other cryptocurrencies remain niche and their value starts to decline over time. I'll easily be proven wrong if prices sustain new all-time highs. Thanks for reading! I'll provide updates when I can. This is clearly speculative and not meant as financial advice. -Victor Cobra
VictorCobra
An Interesting Trendline Rejection (BTC)

I pulled up my old Bitstamp chart, which I used during the previous bull market and the 2018 bear market to make some speculations and estimations. One of the most concerning technical developments in the 2021-2022 bear market was that Bitcoin lost its long term trendline (lower orange line). Bitstamp is useful because it stretches all the way back to 2012. To get back above that trendline and resume a more aggressive rate of increase, it would need to explode above 200k within the next few weeks. That seems pretty unrealistic. What caught my eye was that Bitcoin's recent top perfectly touched a trendline I drew in 2022. It's not that this necessarily means anything, but I found it interesting and wanted to make a short post about it. If nothing else, this retest and rejection illustrates Bitcoin's slowing of momentum over time. I suppose it also serves as an important hurdle - I think if Bitcoin can break above it and retest it, that would be a huge sign of strength for bulls. Volume continues to decline overall, and active addresses have also started to disappear. A decline of this magnitude in active addresses is often seen at cycle peaks. But this time it's different - it almost appears to be plateauing, meaning there is a significant chance everything Bitcoin has peaked. To put it bluntly, Bitcoin has not seen a significant increase in "adoption" since 2017. This has generally been my stance since 2022. I drew a new line (blue) supporting price since the 2022 bottom, to show where price can reasonably fall from here and remain in an uptrend. The trendline support is currently around 45k. If that trendline breaks down, I think a retest of 2022 lows are in order, at least, if not the elusive 13.8k level (2019 high). That's it for now! Thanks for reading. Of course, this is meant for speculative purposes only and should not be taken as financial advice. -Victor CobraSupport exists at this trendline between $43-45k, depending how you draw it.
Disclaimer
Any content and materials included in Sahmeto's website and official communication channels are a compilation of personal opinions and analyses and are not binding. They do not constitute any recommendation for buying, selling, entering or exiting the stock market and cryptocurrency market. Also, all news and analyses included in the website and channels are merely republished information from official and unofficial domestic and foreign sources, and it is obvious that users of the said content are responsible for following up and ensuring the authenticity and accuracy of the materials. Therefore, while disclaiming responsibility, it is declared that the responsibility for any decision-making, action, and potential profit and loss in the capital market and cryptocurrency market lies with the trader.