
Vestinda
@t_Vestinda

What symbols does the trader recommend buying?
Purchase History
پیام های تریدر
Filter
Vestinda
Bitcoin Bull Flag: Last Hurdle for a Major Rally

Over six weeks ago, Bitcoin start forming a Bull Flag pattern. The breakout above the 20-day and 50-day Simple Moving Averages (SMAs) confirmed a low, setting the stage for a potential rally towards the Bull flag's target of approximately $100K. Fast forward to today, BTCUSD has not only surpassed these SMAs but also cleared the Ichimoku Cloud, positioning the price above the 20-day, 50-day, and 200-day SMAs. This alignment signals a bullish outlook. Recent Price Action Recently, Bitcoin has surged past the $71,600 mark, showing a 3.30% increase in the last 4 days. This rise is driven by renewed enthusiasm from both new and short-term investors. According to GlassNode’s latest report, the market is seeing a resurgence in speculative interest. Long-term holders (LTHs), considered the most experienced market participants, are maintaining their positions and continue to accumulate Bitcoin, indicating strong confidence in its long-term growth potential. Technical Resistance and Support Since its all-time high in March, Bitcoin has faced resistance at the Bull flag's upper trend line, with three failed breakout attempts in April an May. As of June 7, BTCUSD is testing this critical resistance again. A successful breakout could lead to a significant rally to $100K, while failure to clear this trend line might result in a correction towards the $54-55K range — watch carefully on SMAs an Ichimoku Cloud. Market Sentiment The "Sell-Side Risk Ratio" suggests that most profit-taking has already occurred within the current price range, pointing to the potential for volatile movements soon. Despite recent market consolidation, long-term holders have shown minimal selling activity, reinforcing their confidence in Bitcoin's future appreciation. Conclusion Bitcoin’s market outlook remains optimistic. The alignment of key SMAs and the Ichimoku Cloud supports a bullish scenario, with further gains likely as speculative interest increases and long-term holders remain steadfast. The next critical test is the $71,300 resistance level, which, if cleared, could pave the way for a substantial rally.
Vestinda
Mastering the Trader Skillset: Building a Strong Pyramid
In the dynamic world of trading, success hinges on a robust skillset. Imagine this skillset as a pyramid, with each level representing a crucial component that traders must master to achieve consistent profitability. At the base, we have Technical Analysis, followed by Risk Management in the middle, and Discipline and Patience at the top. Additionally, Automation plays a pivotal role, integrating seamlessly across the entire structure. Let's delve into each of these elements and understand how they contribute to a trader's success. The Base: Technical Analysis The foundation of the trader's pyramid is Technical Analysis. This involves studying price charts, patterns, and various indicators to make informed trading decisions. Mastering technical analysis is crucial because it: 1. Identifies Trends and Patterns: Recognizing market trends and chart patterns allows traders to predict future price movements, making it easier to enter and exit trades at optimal times. 2. Utilizes Indicators: Tools like moving averages, RSI (Relative Strength Index), MACD (Moving Average Convergence Divergence), and Bollinger Bands provide insights into market momentum, volatility, and potential reversals. 3. Supports Strategy Development: Technical analysis forms the basis for creating and refining trading strategies, whether they are short-term or long-term. The Middle: Risk Management Sitting at the middle of the pyramid is Risk Management, a critical component that ensures long-term survival in the market. Effective risk management includes: 1. Position Sizin: Determining the appropriate size for each trade to limit exposure and avoid catastrophic losses. 2. Stop-Loss Orders: Implementing stop-loss orders to automatically close losing positions before they can significantly impact the trading account. 3. Diversification: Spreading investments across different assets or markets to reduce risk. By prioritizing risk management, traders can protect their capital and remain in the game, even during periods of market volatility. The Peak: Discipline and Patience At the pinnacle of the pyramid are Discipline and Patience, the traits that distinguish successful traders from the rest. These qualities are essential for: 1. Adhering to Strategies: Sticking to predetermined trading plans and strategies, even in the face of emotional challenges and market noise. 2. Avoiding Overtrading: Exercising restraint to prevent impulsive decisions and overtrading, which can erode profits and increase risk. 3. Waiting for the Right Opportunities: Having the patience to wait for high-probability setups, rather than forcing trades. Discipline and patience ensure that traders remain consistent and rational, avoiding the pitfalls of emotional trading. The Integrative Element: Automation Automation in trading acts as an integrative element that enhances every level of the pyramid. It involves using algorithms and trading bots to execute trades based on predefined criteria. Automation benefits traders by: 1. Eliminating Emotional Bias: Automated systems follow strategies without being influenced by fear or greed, ensuring objective decision-making. 2. Enhancing Efficiency: Automation can analyze vast amounts of data quickly and execute trades with precision, improving overall trading efficiency. 3. Consistence: Automated strategies maintain consistency in trading, sticking to the plan without deviation. By incorporating automation, traders can optimize their technical analysis, streamline risk management, and uphold discipline and patience. The trader skillset pyramid provides a comprehensive framework for achieving trading success. Technical Analysis forms the sturdy base, enabling traders to understand market behavior and develop strategies. Risk Management, positioned in the middle, safeguards their capital and ensures longevity. Discipline and Patience, at the top, are the hallmarks of professional trading, allowing traders to execute their plans effectively. Automation, interwoven throughout, enhances each component, providing a modern edge in the fast-paced trading environment. By mastering each level of this pyramid, traders can build a resilient and profitable trading career, equipped to navigate the complexities of financial markets with confidence.
Vestinda
Coinbase's high uncertainty rating explained, key zone $190
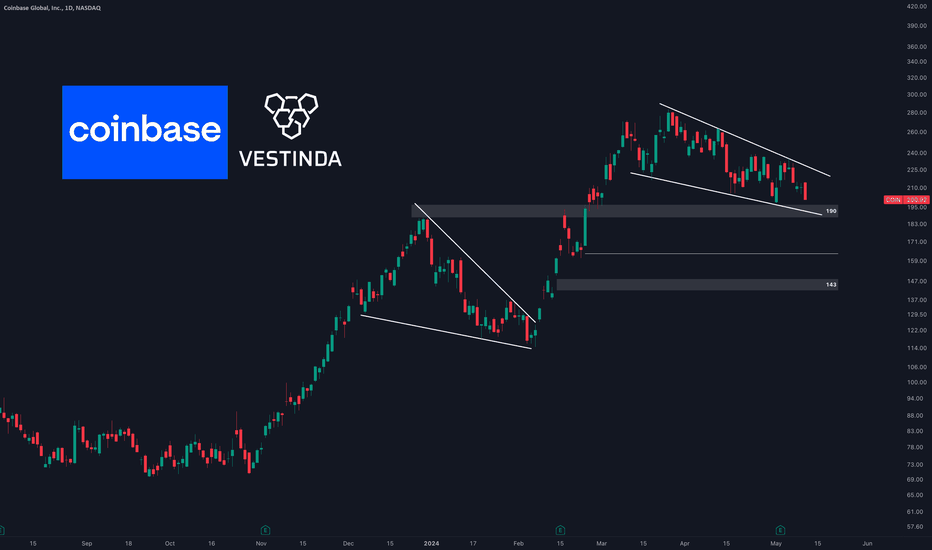
Coinbase's stock price has been in a downward consolidation phase since March, with a key level zone identified at $190. This zone represents previous highs and serves as a crucial support level during this period. A breach below $190 could trigger selling pressure, potentially pushing the price lower towards the open gap at $143. This scenario suggests that a break below $190 may signal further downside momentum in Coinbase's stock price. Coinbase's first-quarter earnings, scrutinized by Morningstar, revealed robust growth driven by surging cryptocurrency prices and volatility. Revenue more than doubled to $1.6 billion, bolstered by a $737 million gain on mark-to-market cryptocurrency assets, resulting in a net income of $1.18 billion. The retail trading business emerged as the primary revenue driver, experiencing a 99% increase from the previous quarter and a remarkable 184% surge from the previous year, totaling $935.2 million. Despite concerns over long-term price competition due to high fees relative to peers, Coinbase's market share remained resilient, with average pricing trending upwards. Economic Moat Rating and Financial Strength Morningstar assessed Coinbase's economic moat as nonexistent, despite its leading position in the US cryptocurrency exchange market. The company's reputation for reliability and compliance has allowed it to charge higher fees than many competitors. With over $5.1 billion in cash and significant cryptocurrency assets, Coinbase maintains a strong financial position, providing flexibility during periods of market volatility. Risk and Uncertainty, Bull and Bear Perspectives Coinbase's exposure to cryptocurrency prices and trading volume, coupled with regulatory uncertainty and interest rate exposure, contributes to its Very High Uncertainty Rating. Bulls emphasize Coinbase's leading market position and potential for global expansion, while bears caution against the cyclical nature of cryptocurrency markets and regulatory challenges, including allegations of acting as an unregistered securities exchange by the SEC.
Vestinda
27 Articles That Helps You to Avoid MONEYGONE Pattern

Are you tired of feeling like your money disappears into thin air? Say goodbye to the ' MONEYGONE ' pattern with our collection of 27 articles packed with tips and tricks to keep your finances on track. In #VestindaTips we've put together this big guide all about how prices move and patterns in trading. Whether you're new to trading or you've been doing it for a while, we want to give you helpful info to understand the ups and downs of the financial world. So, let's learn together and get ready to navigate those tricky markets! Dynamics of Bull Market Cycles: Understanding the ebbs and flows of bull markets is essential for capitalizing on upward trends. Dive into the intricacies of bull market cycles to identify opportunities and optimize your trading strategies. Dynamics of Bear Market Cycles: Conversely, bear markets present unique challenges and opportunities. Explore the dynamics of bear market cycles to mitigate risks and maximize profits during downward trends. Diamond Pattern: How-To Guide: Uncover the secrets of the diamond pattern and learn how to recognize and interpret this rare yet powerful formation in trading. Drawing Trendlines: A Practical Guide: Master the art of drawing trendlines with precision and accuracy. This practical guide offers valuable tips and techniques to identify trends and make informed trading decisions. Think You Know Candlestick Patterns? Delve deeper into the realm of candlestick patterns and refine your understanding of these fundamental tools for technical analysis. What is a Bearish Pennant Pattern? Decode the mysteries of the bearish pennant pattern and discover how to spot this bearish continuation formation in the market. Market Gaps: Strategies, Types, Fills, and Crypto: Explore the phenomenon of market gaps and uncover effective strategies for navigating these price discontinuities across various asset classes, including cryptocurrencies. Three White Soldiers: Learn to recognize and interpret the significance of the three white soldiers pattern, a bullish reversal formation that signals a potential shift in market sentiment. Bullish Pennant Pattern: Gain insights into the bullish pennant pattern and harness its predictive power to identify lucrative trading opportunities in the market. How to Island Reversal Pattern: Navigate the waters of the island reversal pattern and understand its implications for trend reversal and market sentiment. The Triangles: With Real-Life Examples: Explore the various types of triangle patterns, including symmetrical, ascending, and descending triangles, with real-life examples illustrating their significance in technical analysis. Cracking the Short Squeeze: Demystify the phenomenon of short squeezes and learn how to capitalize on these explosive market dynamics for potentially substantial gains. Hammer of Trend Change: Discover the hammer candlestick pattern and its role as a potent signal for trend reversal, providing traders with valuable insights into market dynamics. Basics of Elliott Wave Theory: Unlock the foundational principles of Elliott Wave Theory and leverage this powerful tool for predicting market cycles and trends. The Core Confirmations Every Trader Must Know: Equip yourself with essential trading confirmations to validate your analysis and make well-informed trading decisions with confidence. What are Tweezer Top and Bottom Patterns? Unravel the mysteries of tweezer top and bottom patterns and learn how to interpret these candlestick formations for identifying potential trend reversals. How to Altseason Cycle || Cheat Sheet || Bitcoin Dominance: Navigate the altseason cycle with ease using this comprehensive cheat sheet, complete with insights into Bitcoin dominance and its implications for the broader cryptocurrency market. Rising and Falling Wedges Explained: Understand the characteristics of rising and falling wedges and learn how to effectively trade these patterns for profit. How to Head and Shoulders: Master the head and shoulders pattern, a classic reversal formation that can provide valuable insights into market trends and potential trend reversals. Double Top vs. Double Bottom Patterns: Distinguish between double top and double bottom patterns and learn how to identify and trade these reversal formations effectively. Triple Top vs. Triple Bottom Patterns: Explore the nuances of triple top and triple bottom patterns and their implications for market trends and price action. DIVERGENCE CHEATSHEET: Decode divergence patterns with this comprehensive cheat sheet, providing invaluable insights into market dynamics and potential trend reversals. Supply and Demand Zones: Buying Low, Selling High: Master the art of identifying supply and demand zones to capitalize on optimal entry and exit points in the market. Ascending Channels: The Guide: Navigate ascending channels with confidence using this comprehensive guide, complete with strategies for trading within these bullish formations. Wyckoff Accumulation & Distribution: Unlock the secrets of Wyckoff accumulation and distribution phases and learn how to spot these market manipulation tactics for profitable trading opportunities. The Cup and Handle Pattern in Trading: Discover the cup and handle pattern, a classic bullish continuation formation that can signal significant uptrends in the market. The ABCD Pattern: from A to D: Explore the ABCD pattern and its role in identifying potential entry and exit points in the market, providing traders with a structured approach to trading. With all the cool stuff you've learned from our guide on price action and patterns, you'll be ready to tackle the twists and turns of the financial world like a pro! It doesn't matter if you're just starting out or you've been at it for a while, getting the hang of these basic ideas is super important for making good trades and winning big. So, go ahead and dive in! Happy trading, everyone!
Vestinda
Hong Kong ETF, Ethereum Analysis, EIP 3074

🟣 Today, let's delve into the latest developments in the Ethereum ETHUSDT market landscape. Here's what you need to know: Ethereum's Price Analysis: Ethereum has been in decline since mid-March, with its price developing a Downward Channel pattern. Consolidation periods compressed in Rising Wedges within this pattern suggest a continuation setup that might trigger more selloffs in the coming week. Our analyst eyeing the $2675 support level, where the next bottoming phase could occur, driven by bullish expectations for the broader crypto market. Hong Kong ETF Debut: The launch of spot Bitcoin and Ethereum exchange-traded funds (ETFs) in Hong Kong garnered attention, but initial trading volumes fell short of expectations compared to the United States. While the debut of these ETFs represents a significant milestone for the crypto market in Hong Kong, challenges remain in matching the trading volumes witnessed in other jurisdictions. Despite the subdued start, investor interest in crypto ETFs remains a key area to watch, reflecting evolving market dynamics and regulatory considerations. Ethereum Improvement Proposal (EIP) 3074: Ethereum's recent developers call highlighted discussions around EIP 3074, a proposal aimed at enhancing crypto wallets' functionality. This proposal enables regular wallets to function like smart contracts, potentially reducing transaction costs for users. However, developers remain divided on its implementation, citing concerns about complexity and security risks. As discussions progress, the impact of EIP 3074 on Ethereum's ecosystem and price trajectory should be closely monitored by investors. Stay tuned for further updates and insights
Vestinda
Dynamics of Bear Market Cycles

Bear markets, characterized by declining asset prices and investor pessimism, are a formidable force in the financial landscape. Understanding the distinct phases of a bear market cycle is essential for investors to navigate turbulent times and identify potential opportunities amidst the chaos. Shot across the Bow: The onset of a bear market sends a shockwave through the financial markets, shattering the "animal spirits" that drive bullish sentiment. Investor confidence wanes as uncertainty looms large, marking the beginning of a challenging journey ahead. Bull-Trap: Amidst the downward spiral, occasional rallies can deceive investors into believing that the worst is over. The "buy the dip" mentality prevails as hopeful traders attempt to capitalize on perceived bargains, only to be ensnared by the bear's trap once again. The Lower-High: As the bear market persists, a crucial shift in market behavior and psychology becomes apparent. The formation of lower highs signals a fundamental change in sentiment, as optimism gives way to caution and apprehension. Breakdown: The breakdown phase marks the definitive confirmation of a change in trend, as selling pressure intensifies and asset prices plummet. This descent into the deflationary abyss underscores the severity of the market downturn and underscores the need for defensive strategies. Fear and Capitulation: With fear gripping the markets, sentiment reaches a nadir as pessimism pervades and panic selling ensues. Investors capitulate in droves, relinquishing their holdings in a desperate bid to salvage what remains of their portfolios. Bottom Fishing: Amidst the chaos, value buyers emerge, scouring the market for opportunities amidst the wreckage. However, their efforts are met with fierce resistance from residual sellers, as the battle for market equilibrium rages on. Despair, End of Bear: In the depths of despair, all hope seems lost as the bear market reaches its nadir. Yet, amidst the gloom, a glimmer of optimism emerges as residual selling dries up, signaling the potential for a new beginning. Bear market cycles are a testament to the ebb and flow of market sentiment, characterized by periods of turmoil and uncertainty. By understanding the key phases of a bear market cycle, investors can better prepare themselves to weather the storm and emerge stronger on the other side.
Vestinda
Mid April: Market pullbacks, inflation concerns; critical levels
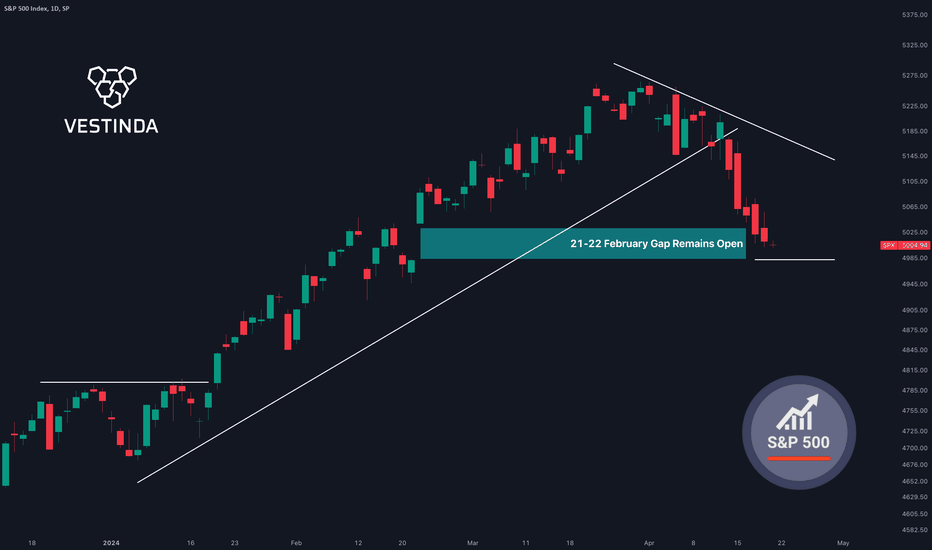
In April, the markets navigated a sluggish terrain, witnessing pullbacks from the record highs achieved in March for both the S&P 500 and the Dow. Meanwhile, the NASDAQ experienced a marginal dip, bolstered by specific technology stocks. Persistent concerns surrounding inflation lingered, exacerbated by the latest Consumer Price Index data revealing a 3.5% annual increase in March, with core inflation climbing to 3.8%. These figures, coupled with inflation data surpassing expectations, tempered anticipations for immediate interest-rate adjustments. Our analysis pinpoints a notable development as the US stock market dipped below the critical 5141 level, meriting close observation. Signs suggest a potential further descent, potentially to close a gap, presenting a prospective opportunity for traders. We recommend traders monitor these levels vigilantly for insights into market trajectory and potential trading prospects, particularly surrounding the 4982 gap level. This juncture could serve as a pivotal support or resistance zone, contingent upon price action and market sentiment. Diligently tracking these benchmarks can furnish invaluable guidance for making well-informed trading decisions amidst the current market landscape.
Vestinda
Dynamics of Bull Market Cycles

Bull markets are the epitome of investor optimism and economic growth, characterized by rising asset prices and increasing investor confidence. However, within every bull market, there lies a cyclical pattern composed of distinct phases: Discovery, Momentum, and Blow-off. Understanding these phases is crucial for investors to navigate the market efficiently and capitalize on opportunities while mitigating risks. 🟣 Discovery Phase: 👉 Accumulation: During the accumulation phase, institutional investors and smart money recognize undervalued assets and begin quietly accumulating positions. This often occurs when the broader market sentiment is still pessimistic or uncertain, presenting attractive buying opportunities. 👉 Trend Emergence: As accumulation continues, subtle shifts in market dynamics become apparent. Prices begin to exhibit higher highs and higher lows, indicating the emergence of an uptrend. Technical indicators such as moving averages may start to show bullish crossovers, further confirming the trend. 🟣 Momentum Phase: 👉 Shake-out: The shake-out phase is characterized by short-term price declines or corrections that test investor resolve. Weak-handed investors, who bought near the end of the accumulation phase or are driven by fear, panic sell their positions. This phase often creates volatility and uncertainty but also offers opportunities for long-term investors to accumulate quality assets at discounted prices. 👉 Momentum Building: Following the shake-out, momentum begins to build as the broader market recognizes the strength of the uptrend. More investors start participating in the rally, driving prices higher. Positive news catalysts and strong earnings reports further fuel the momentum, attracting even more investors. 👉 First Sentiment: As the bull market gains momentum, investor sentiment shifts from cautious optimism to moderate confidence. Market participants start to believe in the sustainability of the uptrend, leading to increased buying activity. However, skepticism may still linger, especially among contrarian investors who remain wary of potential overvaluation. 🟣 Blow-off Phase: 👉 Renewed Optimism: In the blow-off phase, optimism reignites as investors regain confidence in the market's upward trajectory. Corrections or pullbacks are viewed as buying opportunities rather than signals of impending reversal. Institutional investors and retail traders alike re-enter the market, driving prices to new highs. 👉 FOMO (Fear of Missing Out): Fear of Missing Out becomes prevalent as investors fear being left behind in the rally. Social media, financial news outlets, and word-of-mouth recommendations amplify the sense of urgency to buy, further fueling price appreciation. This FOMO-driven buying frenzy can lead to exaggerated price moves and irrational exuberance. 👉 Euphoria: Euphoria marks the peak of the bull market cycle. Investors become irrationally exuberant, believing that the current uptrend will continue indefinitely. Risk management takes a backseat as greed overrides caution. Valuation metrics may reach extreme levels, signaling frothiness in the market. Understanding the cyclical nature of bull market cycles is essential for investors to navigate the market successfully. By recognizing the distinct phases of Discovery, Momentum, and Blow-off, investors can make informed decisions, capitalize on opportunities, and protect their portfolios from potential downturns. While bull markets are synonymous with optimism and prosperity, prudent risk management and a keen awareness of market dynamics are critical for long-term investment success.
Vestinda
🟠 BITCOIN MULTI TIMEFRAME: ZERO MOMENTUM IN PLAY 🟣

🟣 Hey there, TradingView fam! Ready for some fresh Bitcoin analysis? We've got a juicy update for you, covering multiple timeframes and packed with insights from key indicators. If you're diving into this post right now, show us some love with a thumbs up! And don't forget to jump into the comments section for some lively discussion. We'd love to hear your thoughts! Let's dive in! 💜 Let's kick things off with a look at the daily perspective. We've plotted the EMA 20, EMA 100, and a Triangle Pattern. Triangles are interesting because they often signal a temporary pause in the prevailing trend. This happens as buyers and sellers push against each other, causing momentum to dissipate. While triangles are fairly easy to spot, trading them can be tricky. Prices can get stuck for a while without any significant breakouts, and when a breakout finally happens, it can sometimes be a false signal, leaving traders scratching their heads. Now, let's talk about the exponential moving averages (EMAs). They're great for tracking trends because they give more weight to recent price action. Currently, the EMA 20 is above the EMA 100, indicating a clear uptrend. In this scenario, these EMAs act as dynamic support and resistance levels. The EMA 20 offers short-term support, while the EMA 100 serves as a long-term support line. Check out our tutorial on trading triangles to learn more about how to navigate these patterns: So now, let's talk about RSI - it's a pretty handy momentum indicator that's all about spotting when the market's either feeling overbought or oversold. When RSI drops below 30, we're talking oversold territory, and when it shoots past 70, we're looking at overbought conditions. Funny thing is, lots of folks get it wrong, selling when RSI's high and buying when it's low. But you know what? Sometimes the market keeps on climbing even with RSI above 70, and it can still drop lower when RSI's below 30. Now, here's a neat trick with RSI: instead of just using those standard 30 and 70 marks, we tweak it a bit. Push the upper band to 60 and lower it to 40. So, when RSI's cruising above 60, it's telling us the market's got some solid upward momentum, and when it's below 40, well, things are getting bearish momentum. Taking a peek at Bitcoin's charts, both on the daily and 4-hour timeframes, RSI seems stuck in the middle, indicating there's not much momentum swinging either way. But hey, Bitcoin can flip on a dime, right? That's why it's crucial to keep an eye on RSI, especially with the halving on the horizon. By the way, don't forget to check out our RSI tutorial! It's packed with valuable insights to help you master this powerful momentum indicator: Now, onto the SuperTrend indicator - another nifty tool for tracking trends and spotting reversals. We've fine-tuned the settings for Bitcoin, setting ATR to 5 and the multiplier to 2, based on some solid backtesting data. Looking at the daily timeframe, SuperTrend 's giving us sell signals, but hop over to the 4-hour chart, and suddenly it's flashing a buy opportunity. Thing is, though, the EMA combo still looks bullish, and RSI's not showing much oomph. So, that early SuperTrend buy signal? Might be a bit premature, you know? And here's something fascinating on the monthly timeframe: Bitcoin's showing seven straight green candles. That's unheard of! Last time we saw anything close was back in 2021, with six greens in a row during a post-halving bull market. In conclusion, April 2024 poses challenges for both buyers and sellers of Bitcoin, potentially resulting in false entries. The market likely needs to recalibrate following 7 months of growth, presenting an opportunity for early investors to capitalize on this shift. Stay informed and explore our other educational resources and posts.🟣 Less than 100 blocks remaining until Bitcoin halving!
Vestinda
Here are 12 crucial insights every trader should keep in mind

In the fast-paced world of trading, where every tick of the clock can mean profit or loss, mastering the art requires more than just luck or intuition. Whether you're a seasoned veteran or just dipping your toes into the market waters, understanding some fundamental principles can make all the difference. Adaptability is Paramount: In the ever-evolving landscape of financial markets, rigidity can be a trader's worst enemy. Markets are influenced by a myriad of factors, from economic indicators to geopolitical events, and they can shift direction swiftly. Successful traders understand the importance of remaining agile, ready to adjust their strategies in response to changing market conditions. This might involve switching trading styles, altering risk management techniques, or even completely reversing positions based on new information. The ability to adapt is not just a skill but a necessity for thriving in the unpredictable world of trading. Quality Over Quantity: In the pursuit of profitability, it's easy to fall into the trap of chasing every potential trade opportunity. However, experienced traders recognize that success is not measured by the sheer number of trades executed but by the quality of those trades. Rather than spreading themselves thin across multiple positions, they focus their efforts on identifying high-probability setups with favorable risk-reward ratios. This disciplined approach allows them to maintain consistency and avoid unnecessary losses associated with impulsive trading decisions. Stick to Your Strengths: The trading arena is vast and diverse, offering countless strategies and approaches. While it may be tempting to experiment with new techniques, seasoned traders understand the importance of sticking to what they know best. By honing their skills in a particular trading style or asset class, they can develop a deeper understanding of market dynamics and recognize opportunities that align with their expertise. This doesn't mean being stagnant or closed-minded but rather embracing a strategy that plays to their strengths and maximizes their chances of success. Learn from Mistakes: Mistakes are an inevitable part of the trading journey, but they can also serve as valuable learning opportunities. Rather than dwelling on losses or repeating the same errors, successful traders approach each setback as a chance to grow and improve. They meticulously analyze their trades, identifying patterns of behavior or market conditions that led to unfavorable outcomes. By keeping detailed records and maintaining a journal of trades, they can track their progress over time and make adjustments to their strategy accordingly. Patience Pays Off: In a world where information moves at the speed of light and markets can react in an instant, patience is a virtue that can't be overstated. Successful traders understand that waiting for the right opportunity is often more profitable than chasing every price fluctuation. They exercise patience and discipline, refusing to enter trades until all criteria of their trading plan are met. This approach not only reduces the likelihood of impulsive decisions but also increases the probability of success by focusing on high-quality setups with optimal risk-reward ratios. Trade Wisely, Not Desperately: Desperation is the enemy of rational decision-making in trading. Whether driven by fear of missing out or a desire to recoup losses, impulsive trading can lead to disastrous consequences. Seasoned traders maintain a cool head and adhere to their trading plan, even in the face of adversity. They understand that forcing trades out of desperation is akin to gambling and prioritize long-term success over short-term gains. By staying disciplined and trading only when conditions are favorable, they avoid the pitfalls of emotional trading and preserve capital for future opportunities. Stay Grounded: Market euphoria can be a dangerous sentiment, clouding judgment and fueling irrational exuberance. Successful traders remain grounded in reality, avoiding the temptation to get swept up in hype or hysteria. They approach each trade with a clear mind and objective analysis, unaffected by the emotions of the crowd. By maintaining a healthy skepticism and focusing on empirical evidence rather than speculative fervor, they can navigate volatile markets with confidence and composure. Read the Market, Not Just the News: While staying informed about market news and economic developments is essential, successful traders understand that price action is the ultimate arbiter of market sentiment. They pay close attention to how prices react to news events, recognizing that market sentiment can often diverge from fundamental analysis. By reading the market's response in real-time, they can identify potential opportunities or threats that may not be immediately apparent from headlines alone. This nuanced understanding allows them to make informed trading decisions based on price action rather than speculation. Look Beyond the Headlines: Major news events and economic indicators can often trigger significant market movements, but their impact may be short-lived or already priced into the market. Successful traders look beyond the headlines, focusing on the broader context and underlying trends that drive price action over the long term. They understand that market sentiment is influenced by a complex interplay of factors, including investor psychology, market structure, and macroeconomic trends. By considering the deeper implications of news events and anticipating market reactions, they can position themselves to capitalize on emerging opportunities and mitigate risks. Know Your Comfort Zone: Emotional stability is essential for maintaining consistency and avoiding costly mistakes in trading. Successful traders know their emotional and financial limits, trading within their comfort zone to prevent fear or greed from dictating their decisions. They size their positions accordingly, ensuring that potential losses are manageable and won't disrupt their overall trading plan. By staying within their comfort zone, they can approach each trade with confidence and objectivity, regardless of market conditions or external pressures. Embrace Your Unique Style: While there's no shortage of trading strategies and methodologies, successful traders understand that there's no one-size-fits-all approach to trading. Instead of blindly following the crowd or adopting the latest fad, they embrace their unique style and tailor their approach to suit their personality, risk tolerance, and market outlook. Whether it's day trading, swing trading, or long-term investing, they focus on strategies that play to their strengths and align with their objectives. By embracing their individuality and staying true to their convictions, they can navigate the markets with confidence and consistency. Trade with Conviction: Confidence is a cornerstone of successful trading. Whether entering a new position or managing an existing trade, successful traders approach each decision with unwavering conviction, based on thorough analysis and a clear understanding of their strategy. They trust their instincts and remain steadfast in their convictions, even in the face of uncertainty or adversity. By trading with conviction, they project confidence to the market and instill trust in their own abilities, fostering a positive feedback loop of success and self-assurance. In conclusion, trading is both an art and a science. While there's no guaranteed formula for success , mastering these fundamental insights can significantly improve your odds in the dynamic world of trading. Stay adaptable, stay informed, and above all, stay true to your strategy. Happy trading!
Disclaimer
Any content and materials included in Sahmeto's website and official communication channels are a compilation of personal opinions and analyses and are not binding. They do not constitute any recommendation for buying, selling, entering or exiting the stock market and cryptocurrency market. Also, all news and analyses included in the website and channels are merely republished information from official and unofficial domestic and foreign sources, and it is obvious that users of the said content are responsible for following up and ensuring the authenticity and accuracy of the materials. Therefore, while disclaiming responsibility, it is declared that the responsibility for any decision-making, action, and potential profit and loss in the capital market and cryptocurrency market lies with the trader.