
Umlingo
@t_Umlingo

What symbols does the trader recommend buying?
Purchase History
پیام های تریدر
Filter
Umlingo
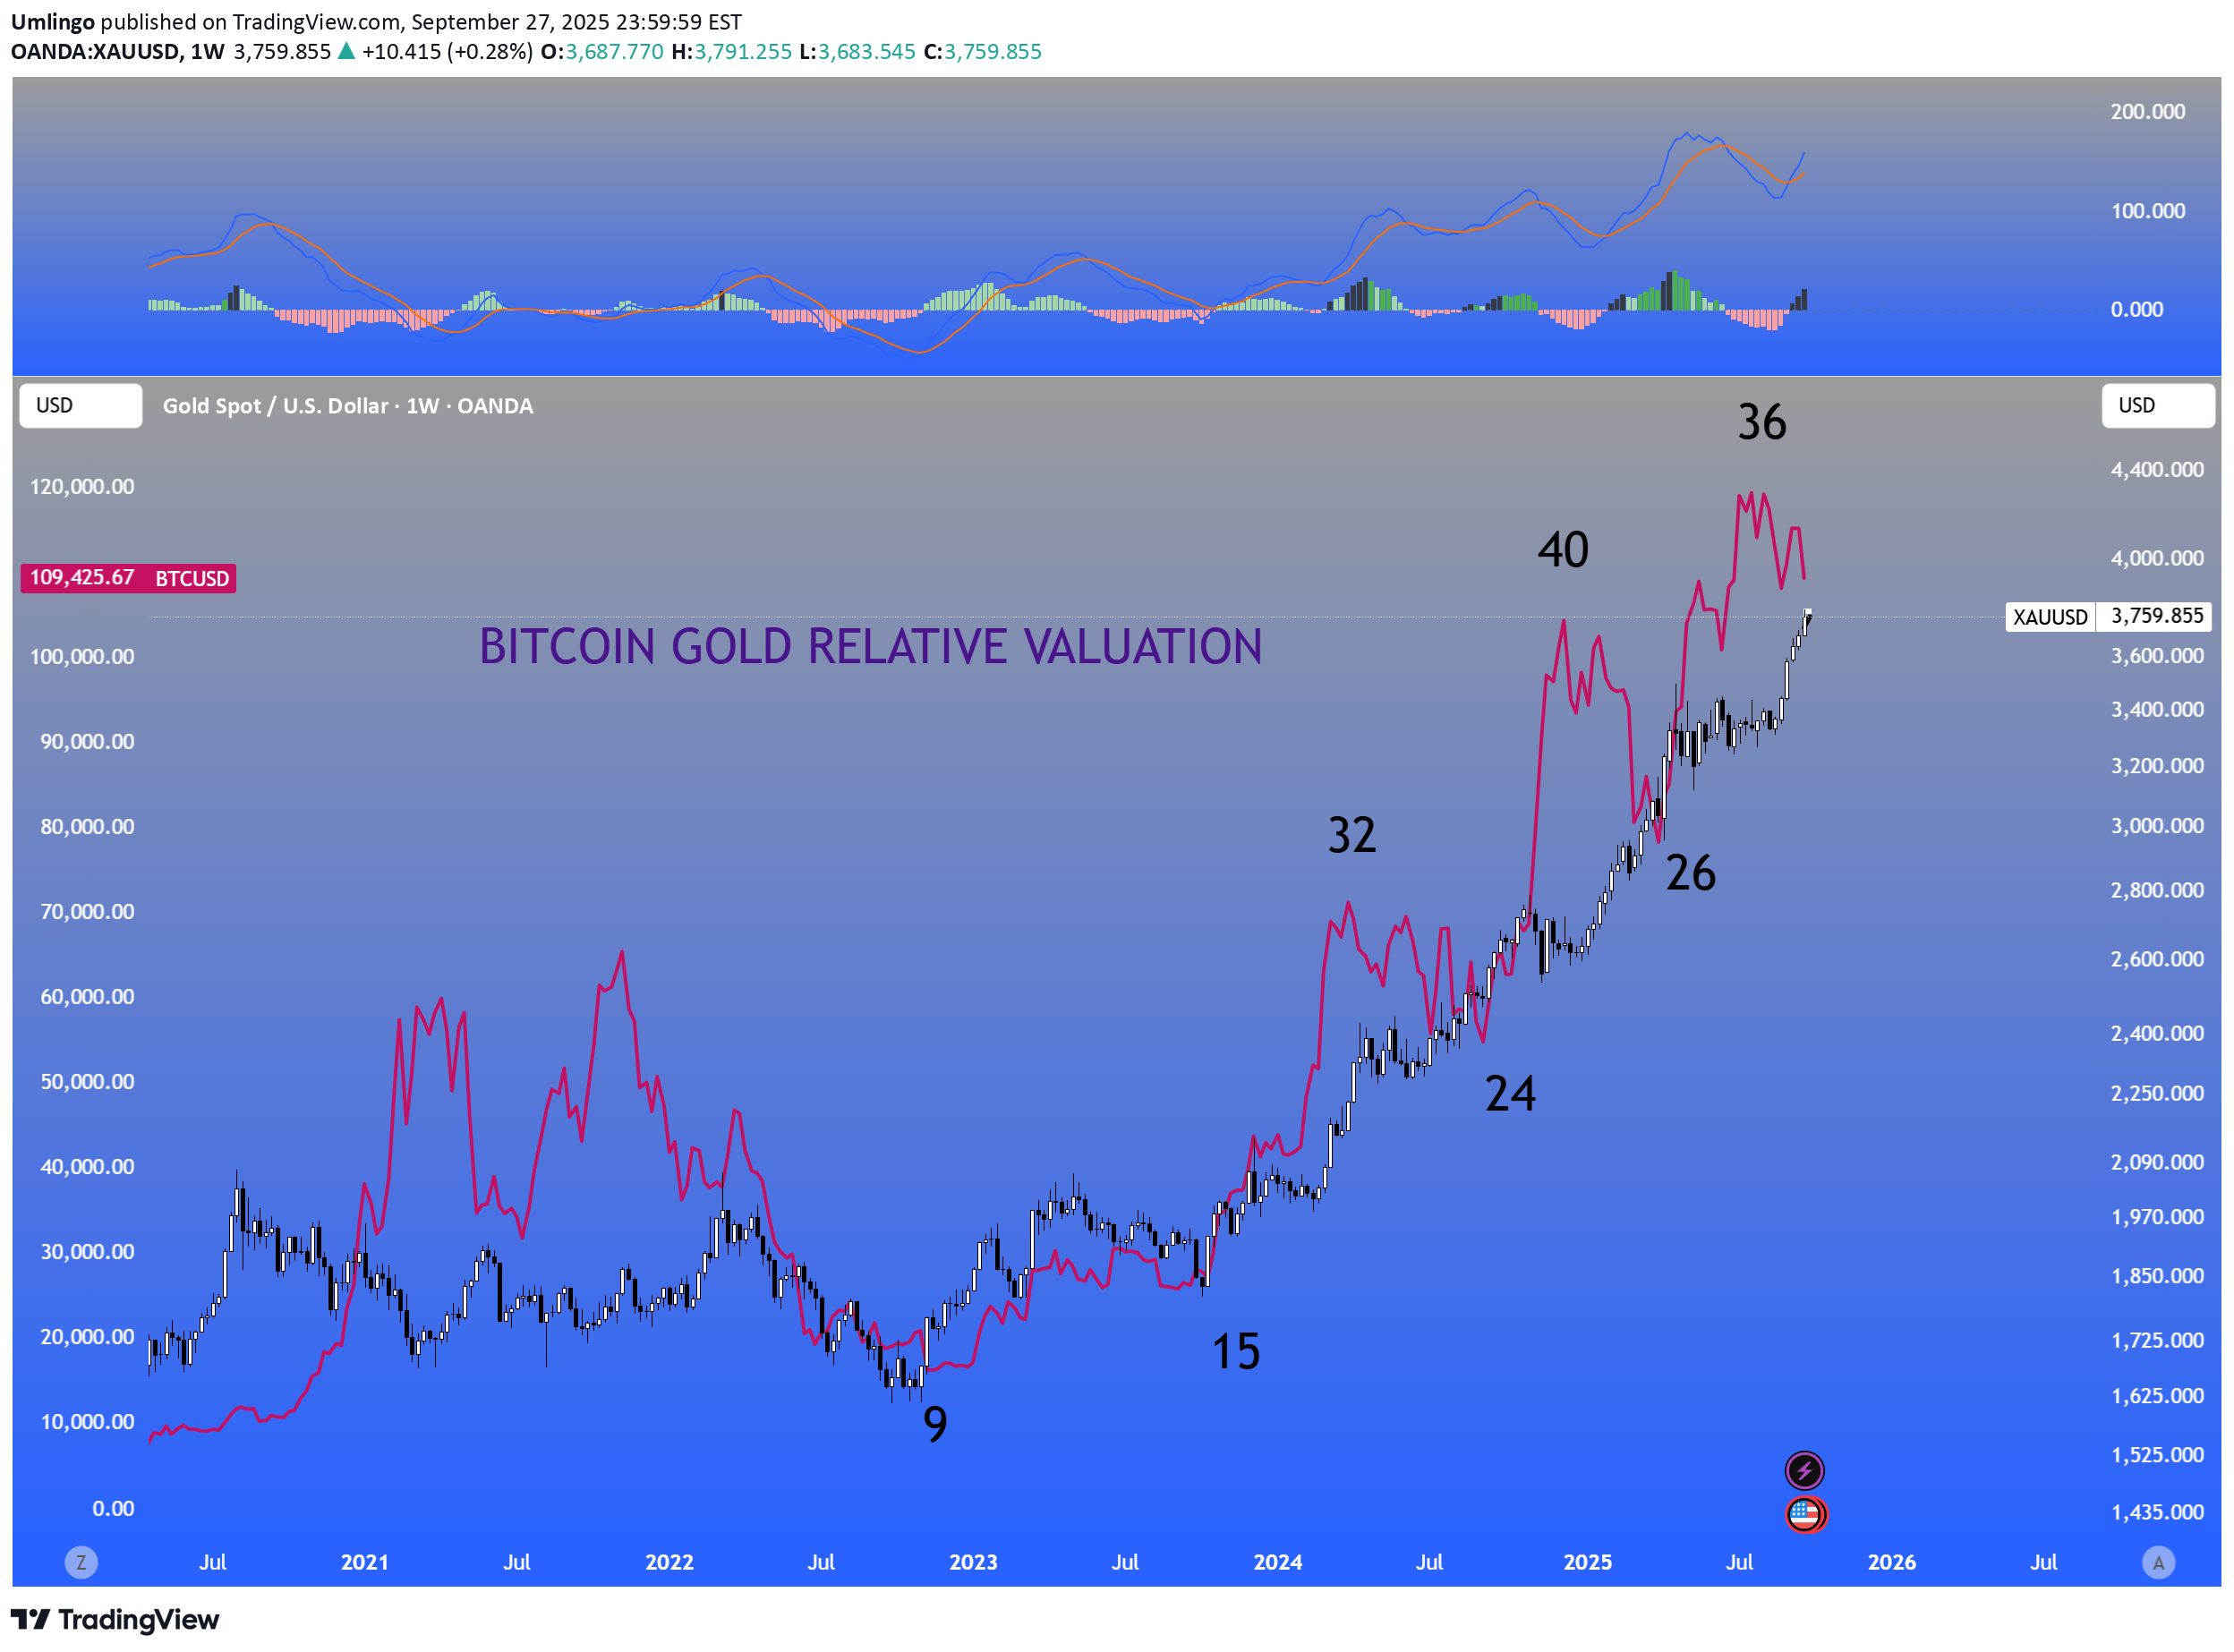
If we look to the weekly chart , there is a positive correlation between Bitcoin and Gold. The relative valuation for each of the legs can be seen on chart. Bitcoin will rally further than gold and will then retrace to a lower multiple. This retracement multiple in the last 2 years has been 24 and 26. If gold holds near its current price , then Bitcoin is likely to retrace back to a lower relative valuation with gold. 1. 24 multiple = 90,000 2. 26 multiple = 97,500 3. 28 multiple = 105,000 From Bitcoin recent high of 119,000 to the current 109,000 , then relative valuation suggests Bitcoin has further to fall from 4000 to 19,000 points.
Umlingo
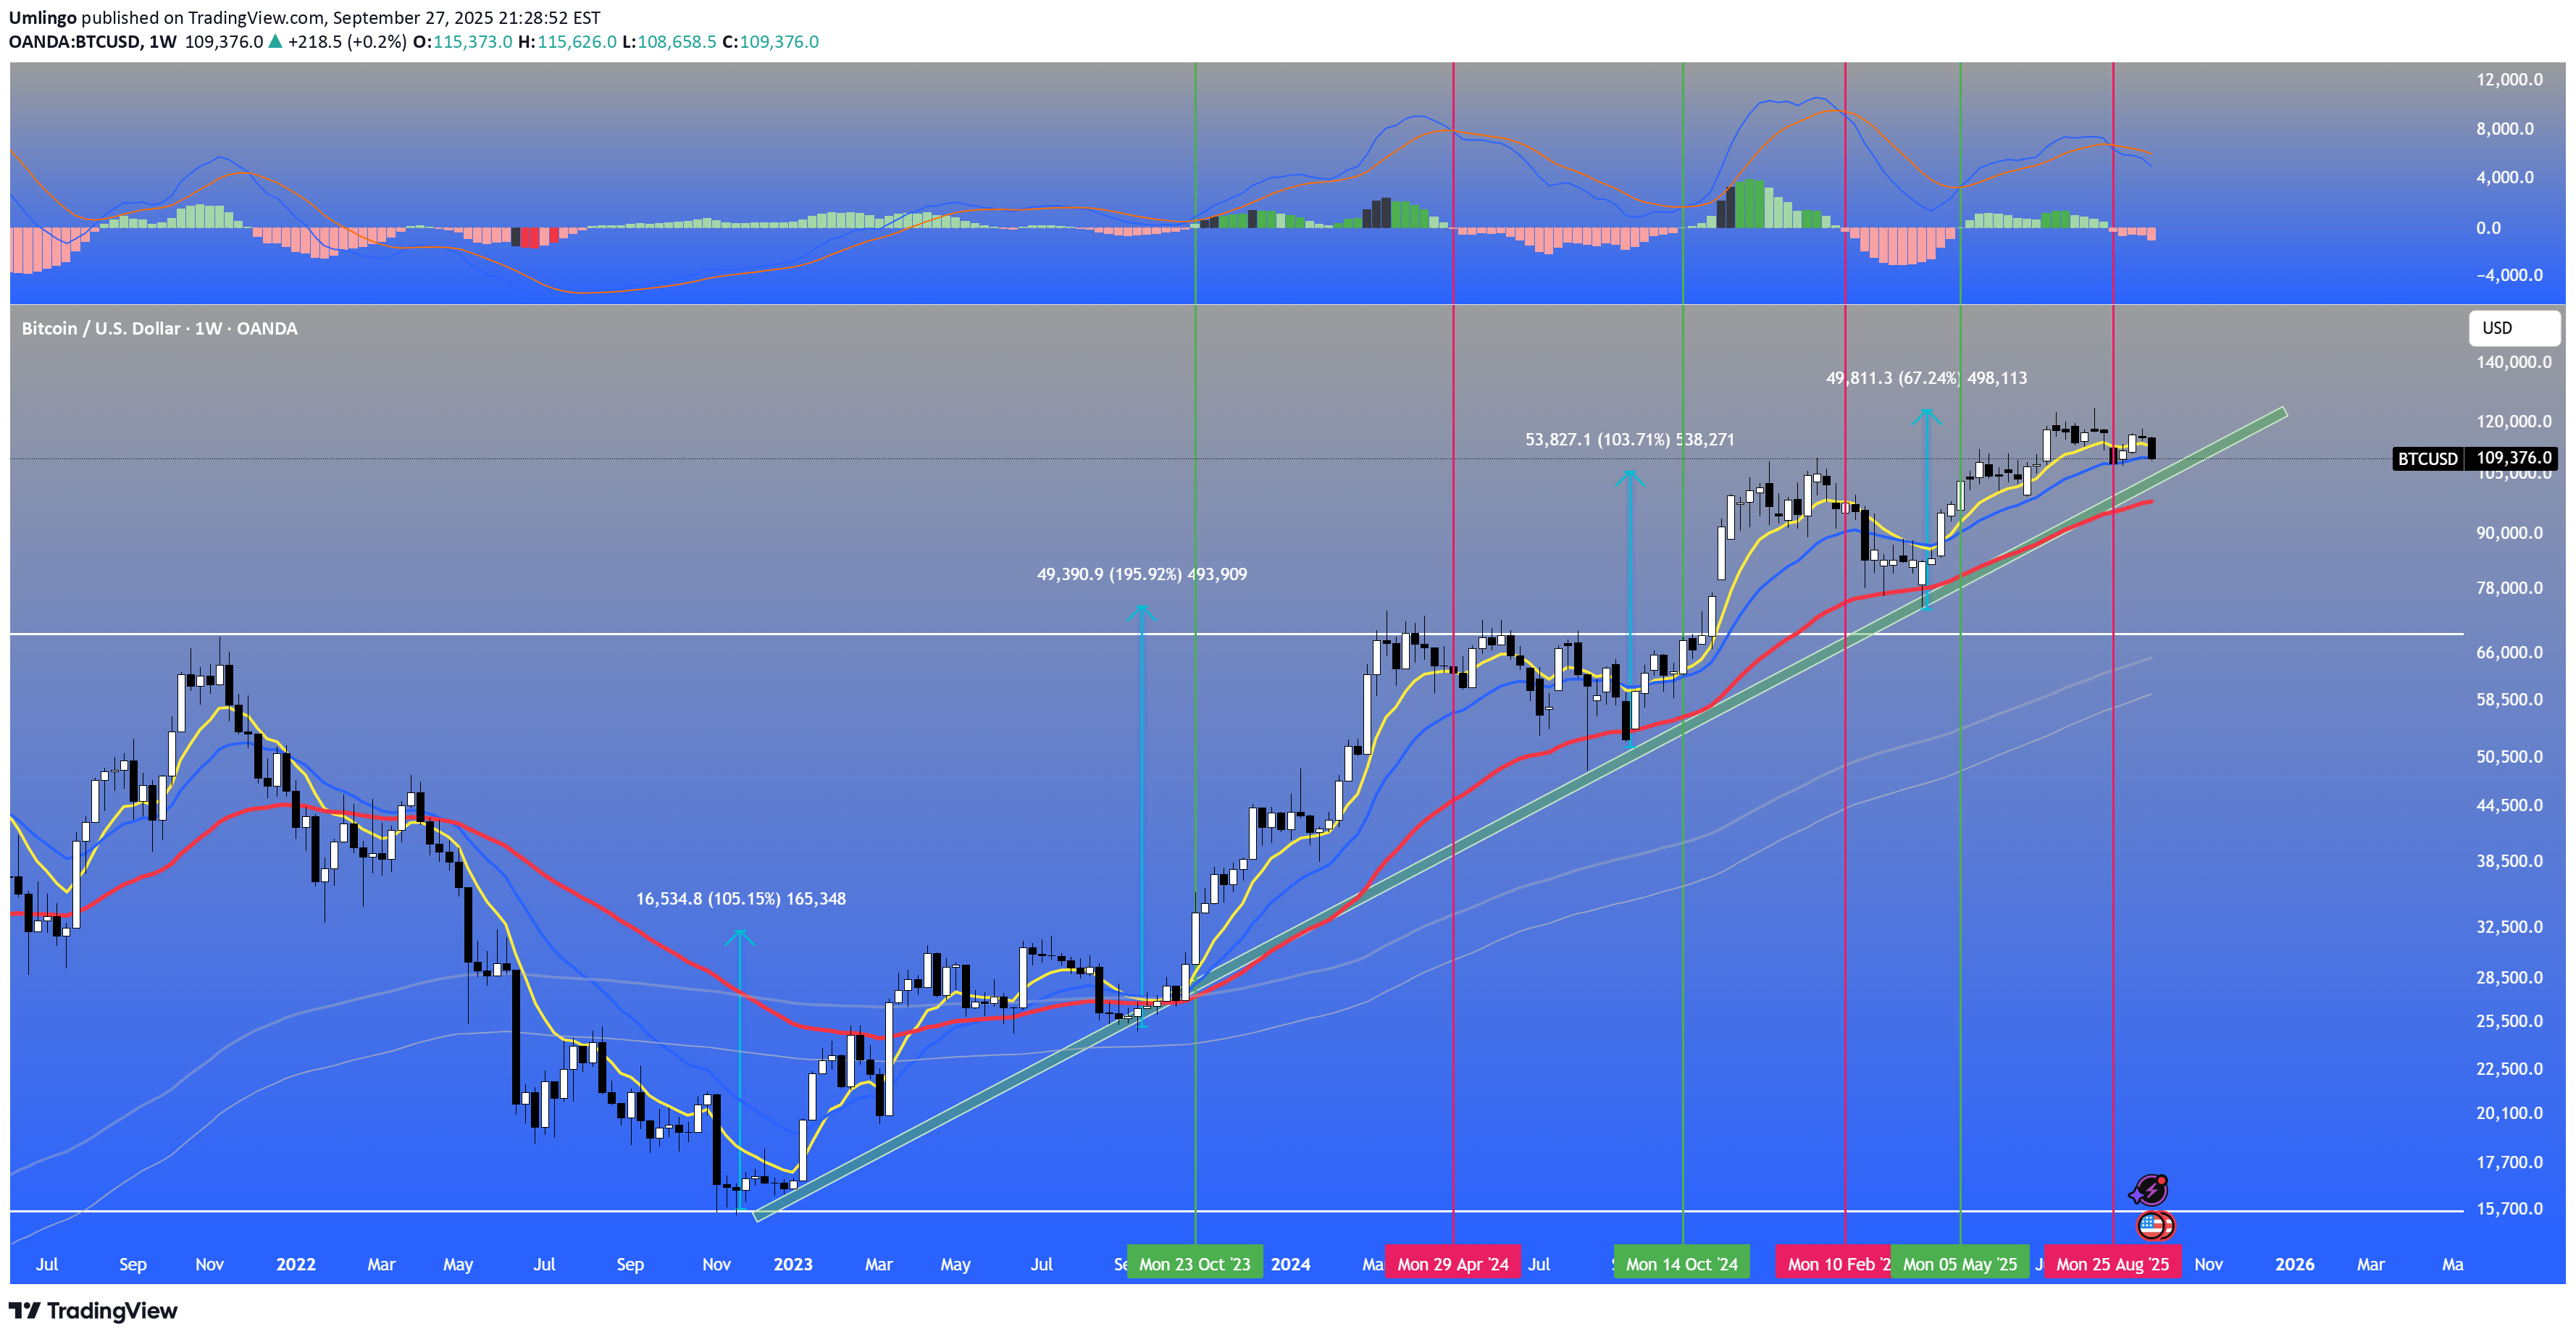
Lets look at the current bull run in Bitcoin from the Nov 2022 low around 16,000. Major Support resistance - identified at 16000-20000 and at 66000-70000 Waves - there have been 4 impulsive waves and 4 corrective. The last 3 impulsive moves resulted in roughly 50K rise. The corrective moves have been Rectangles or Bull Flags. Trendline - a supporting trendline can be identified , that has been touched on 3 occasions to date. Moving Averages - since price has moved above the 200 period moving channel, the 20/50 MAV has stayed in a golden relationship. Note the more responsive 9 MAV has momentarily crossed below the 20 MAV at the low of the corrective cycle. Price also has tested the 50 MAV at each low. MACD - The slow/fast signal lines crossed the Zero axis in March 23 and has stayed above for the duration. Each golden cross and dead cross approximates 4 weeks from a high or low in price. Additionally, if price moves outside the bollinger bands (signified by grey bars) , a consolidation soon follows. The bearish divergence of price and MACD signal is noted. Where are we now ? Primary Trend - Dow would suggest we are still in a Bull Market. Signals - The MACD had a weekly dead cross on the 25th August 2025. Price been in consolidation since the 14th July 2025. The 9ema space to 20 ema is contracting, but it has not had a dead cross as yet. The 50 MAV sits at 98000. Trendline support 102000-107000. Where to next ? Bull Case - primary trend is up and until it bends down, Bitcoin appreciates. Support likely above 95000 and next leg to 150000. MACD golden cross comes in timely, so waiting for this confirmation would assist. Bear Case - possibly a major correction if the trendline is broken comprehensively to the downside. MACD signal lines crossing below Zero would be the confirmation . The swing low of 75000 and the major support at 70000 would be the obvious projections.
Umlingo
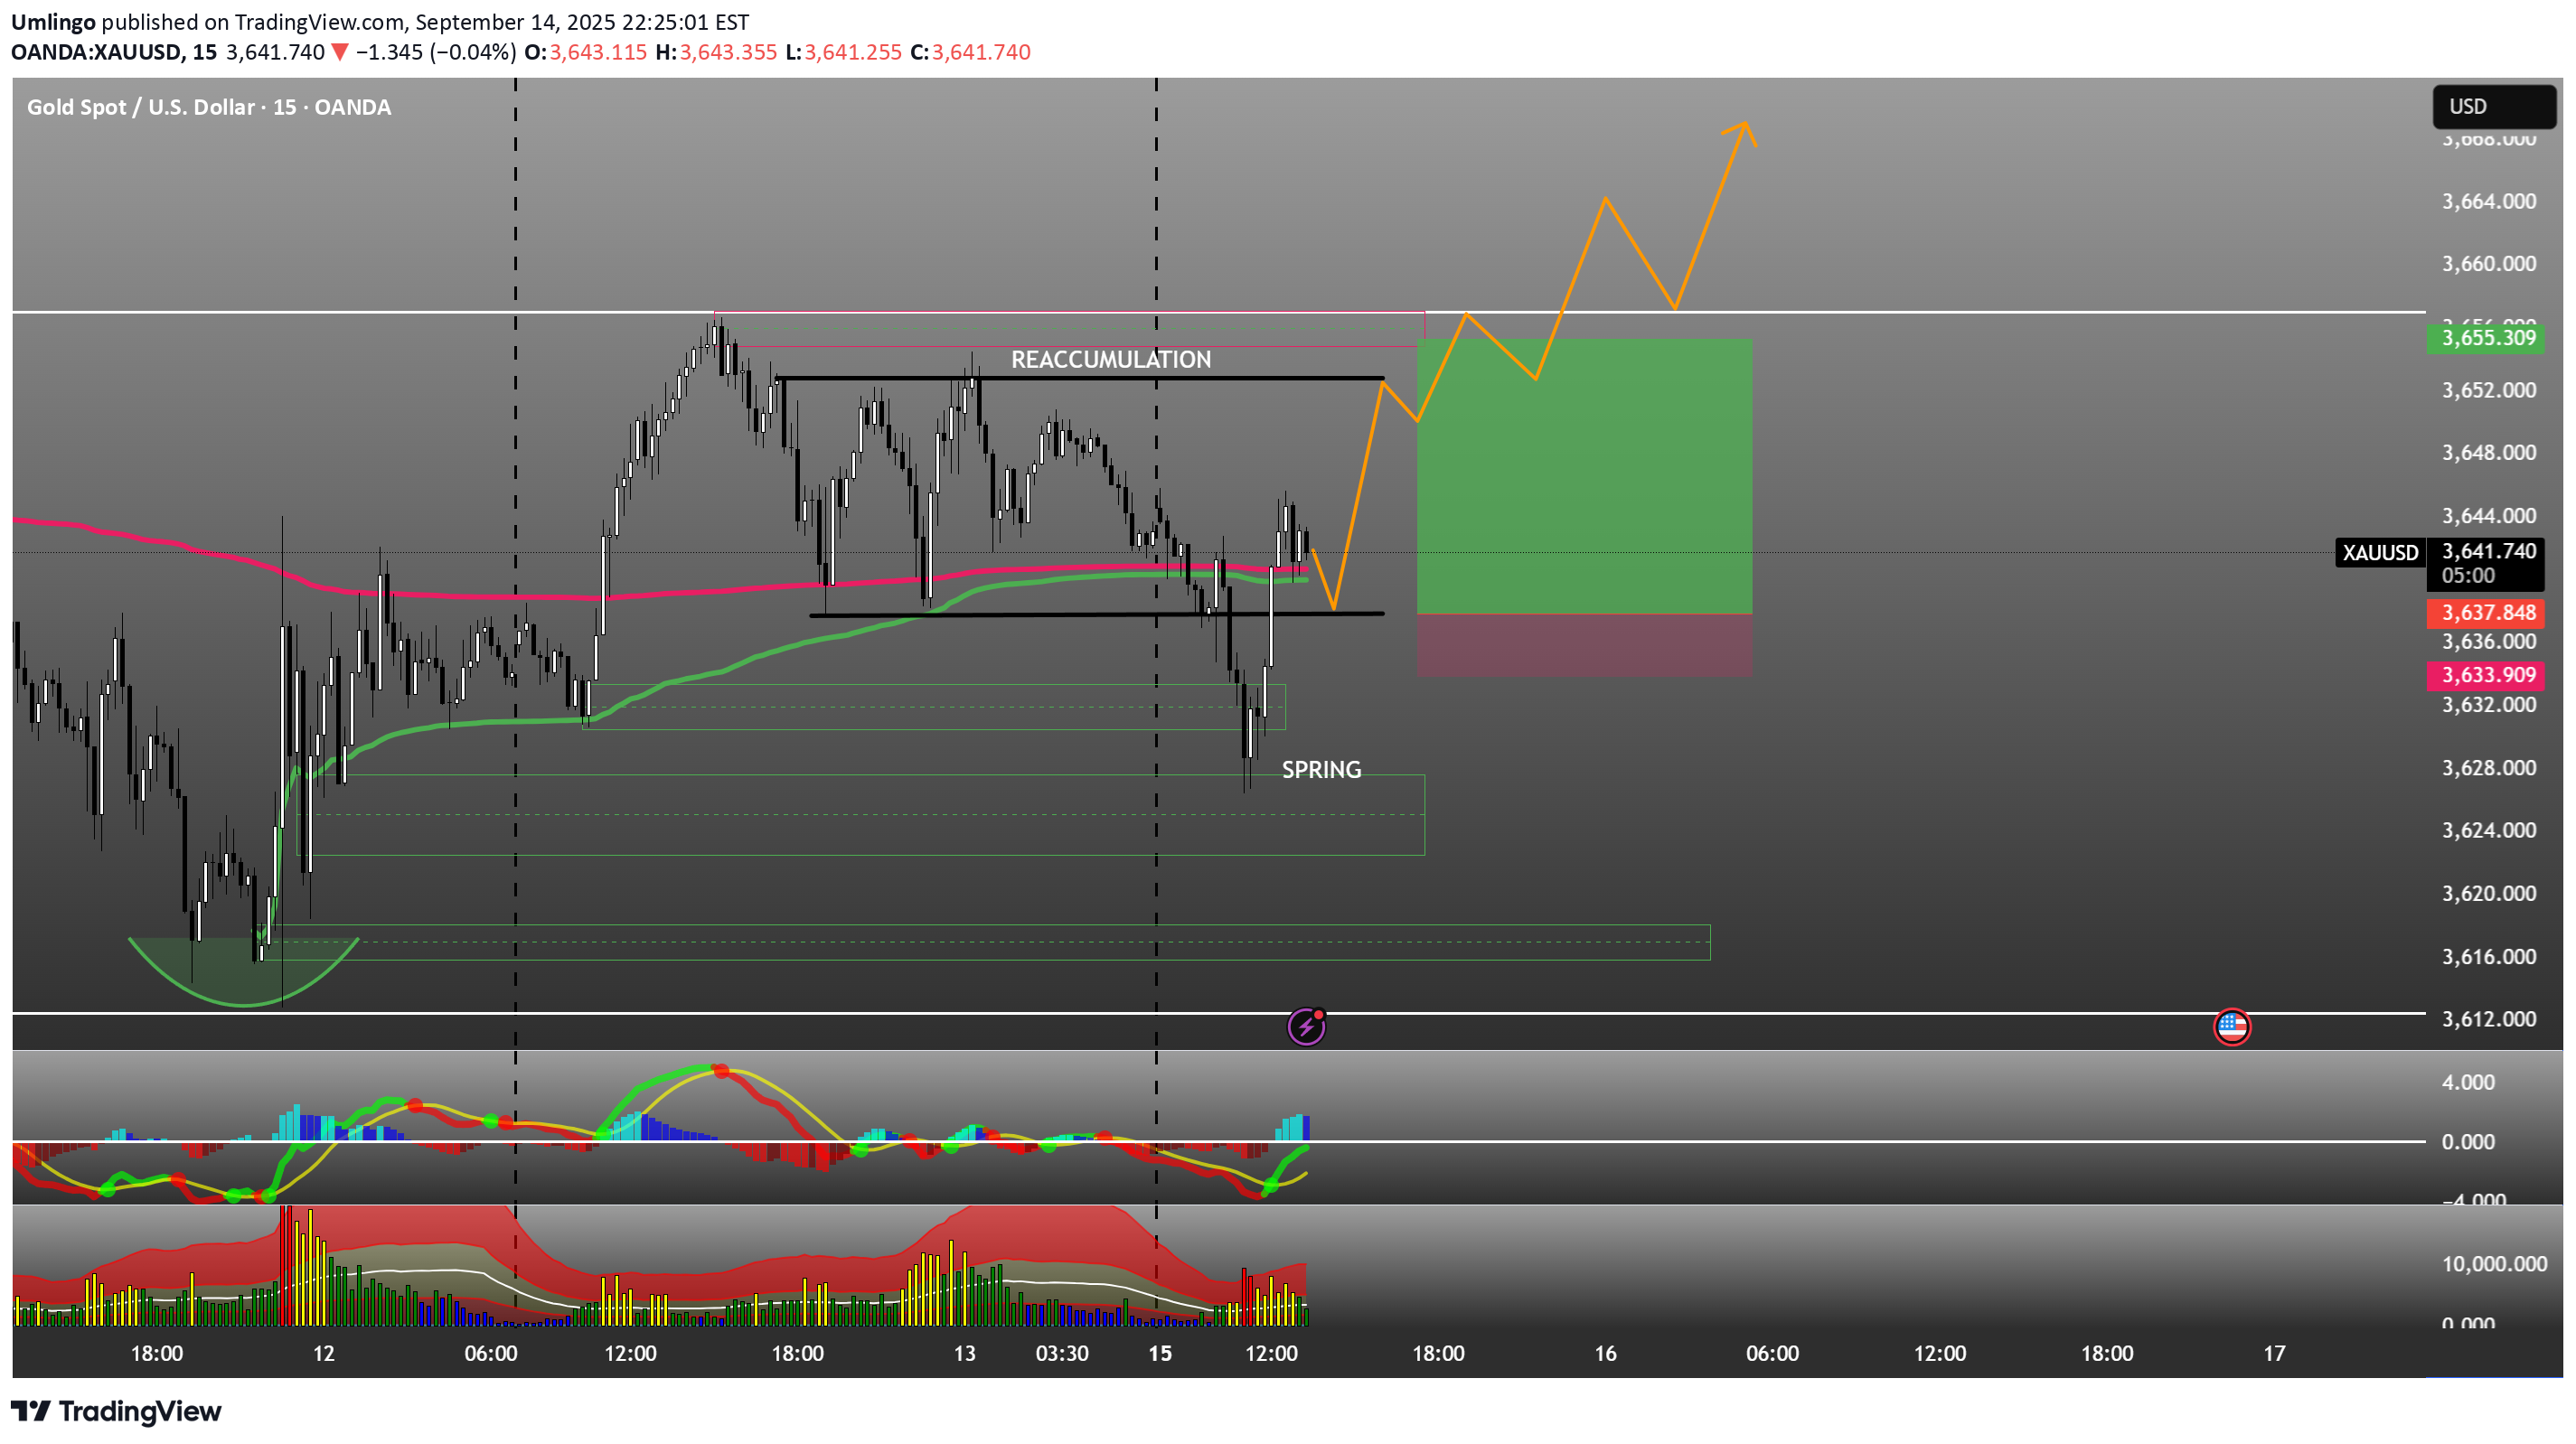
Gold appears to be in a short term accumulation. Price seems to have formed a SPRING ( Bear Trap). Look for price to move within, break and test the upper resistance zone of the consolidation. The suggested trade long is on chart.Done
Umlingo
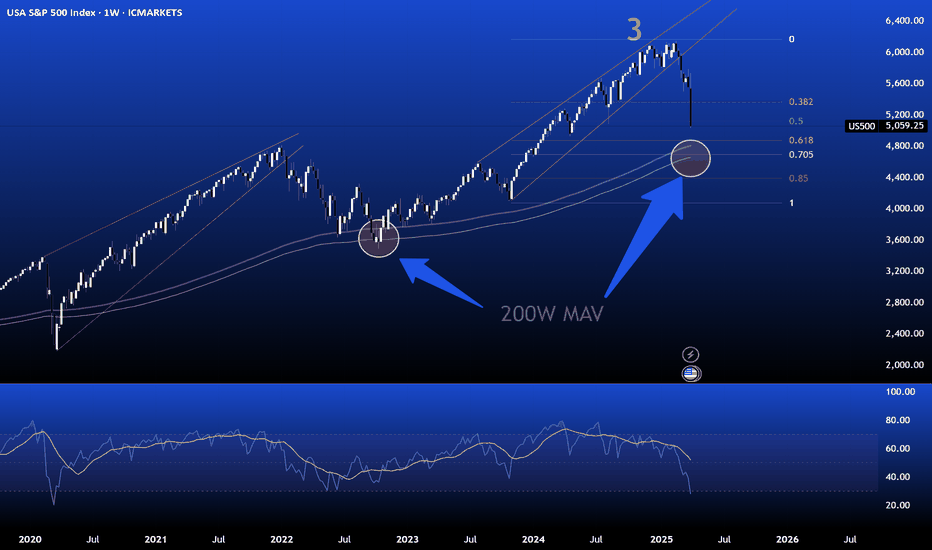
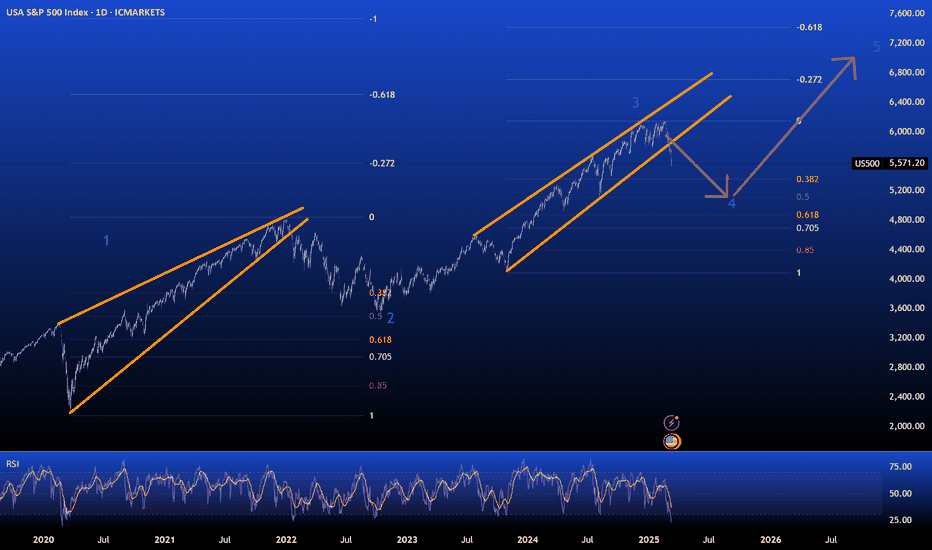
The markets are spooked by the recent Trump Administration Tariff's. Such political mayhem harks back to the Smoot Hawley Tariffs of 1930 , when Protectionism plummeted the world into chaos. Fear and Panic has gripped investors. The last week has seen a rapid decline of this index, with the market falling over 5% in the recent trading session. To date the market is down 17.5 percent from the high of 6147. It is likely we will pass into Bear Market territory in the coming week. From a technical perspective , last week was the largest bear candle in the last 5 years and the RSI has moved into the oversold zone. If we look to the last Bear Market of 2022, the 200 Week MAV acted as support. This may be an area again, where the market forms a low. This would coincide with a 70.5 percentile Fibonacci retracement. So 4550 is the updated target for the current move down.
Umlingo
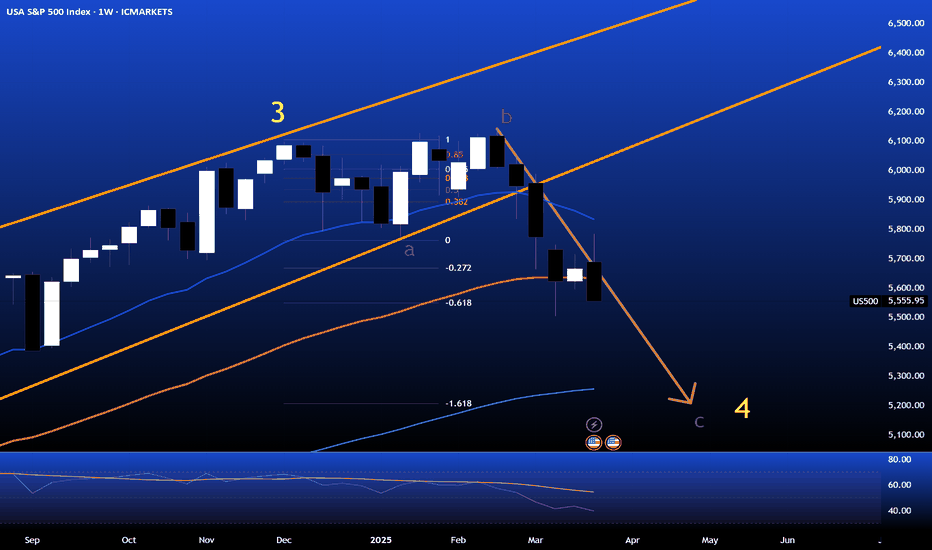
From an Elliott perspective the market appears to be in a 4th Wave correction. The a and b waves have completed and now the c wave is playing out. If we look to a 1.618 extension of the a wave , the target projection is 5200. The bias is to the downside and the bearish sentiment continues to 5200 and possibly an overshoot to lower levels.
Umlingo
Possible wave 4 in progress , with targets of 5200-5400.
Umlingo
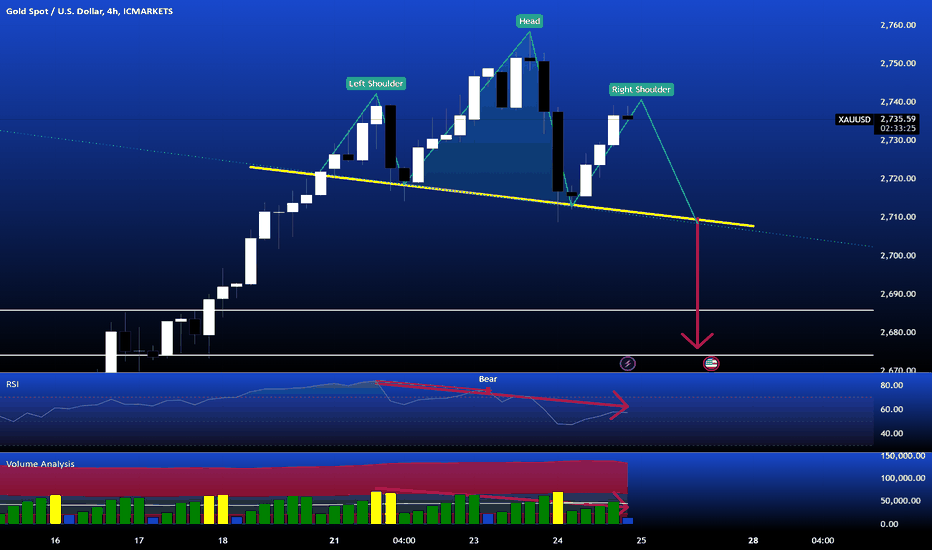
On the intraday chart, Gold may be in midst of completing a H&S pattern. Price has formed the right shoulder peak . A Neckline is discernable. Momentum and Volume are in divergence to price. That is , there is a progressive decline in both as the price looks to form a third peak. A short trade is considered a. Aggressive - from this peak, with stop outside the ATH. b. Conservative - from a neckline break. Target is structural support below.
Umlingo
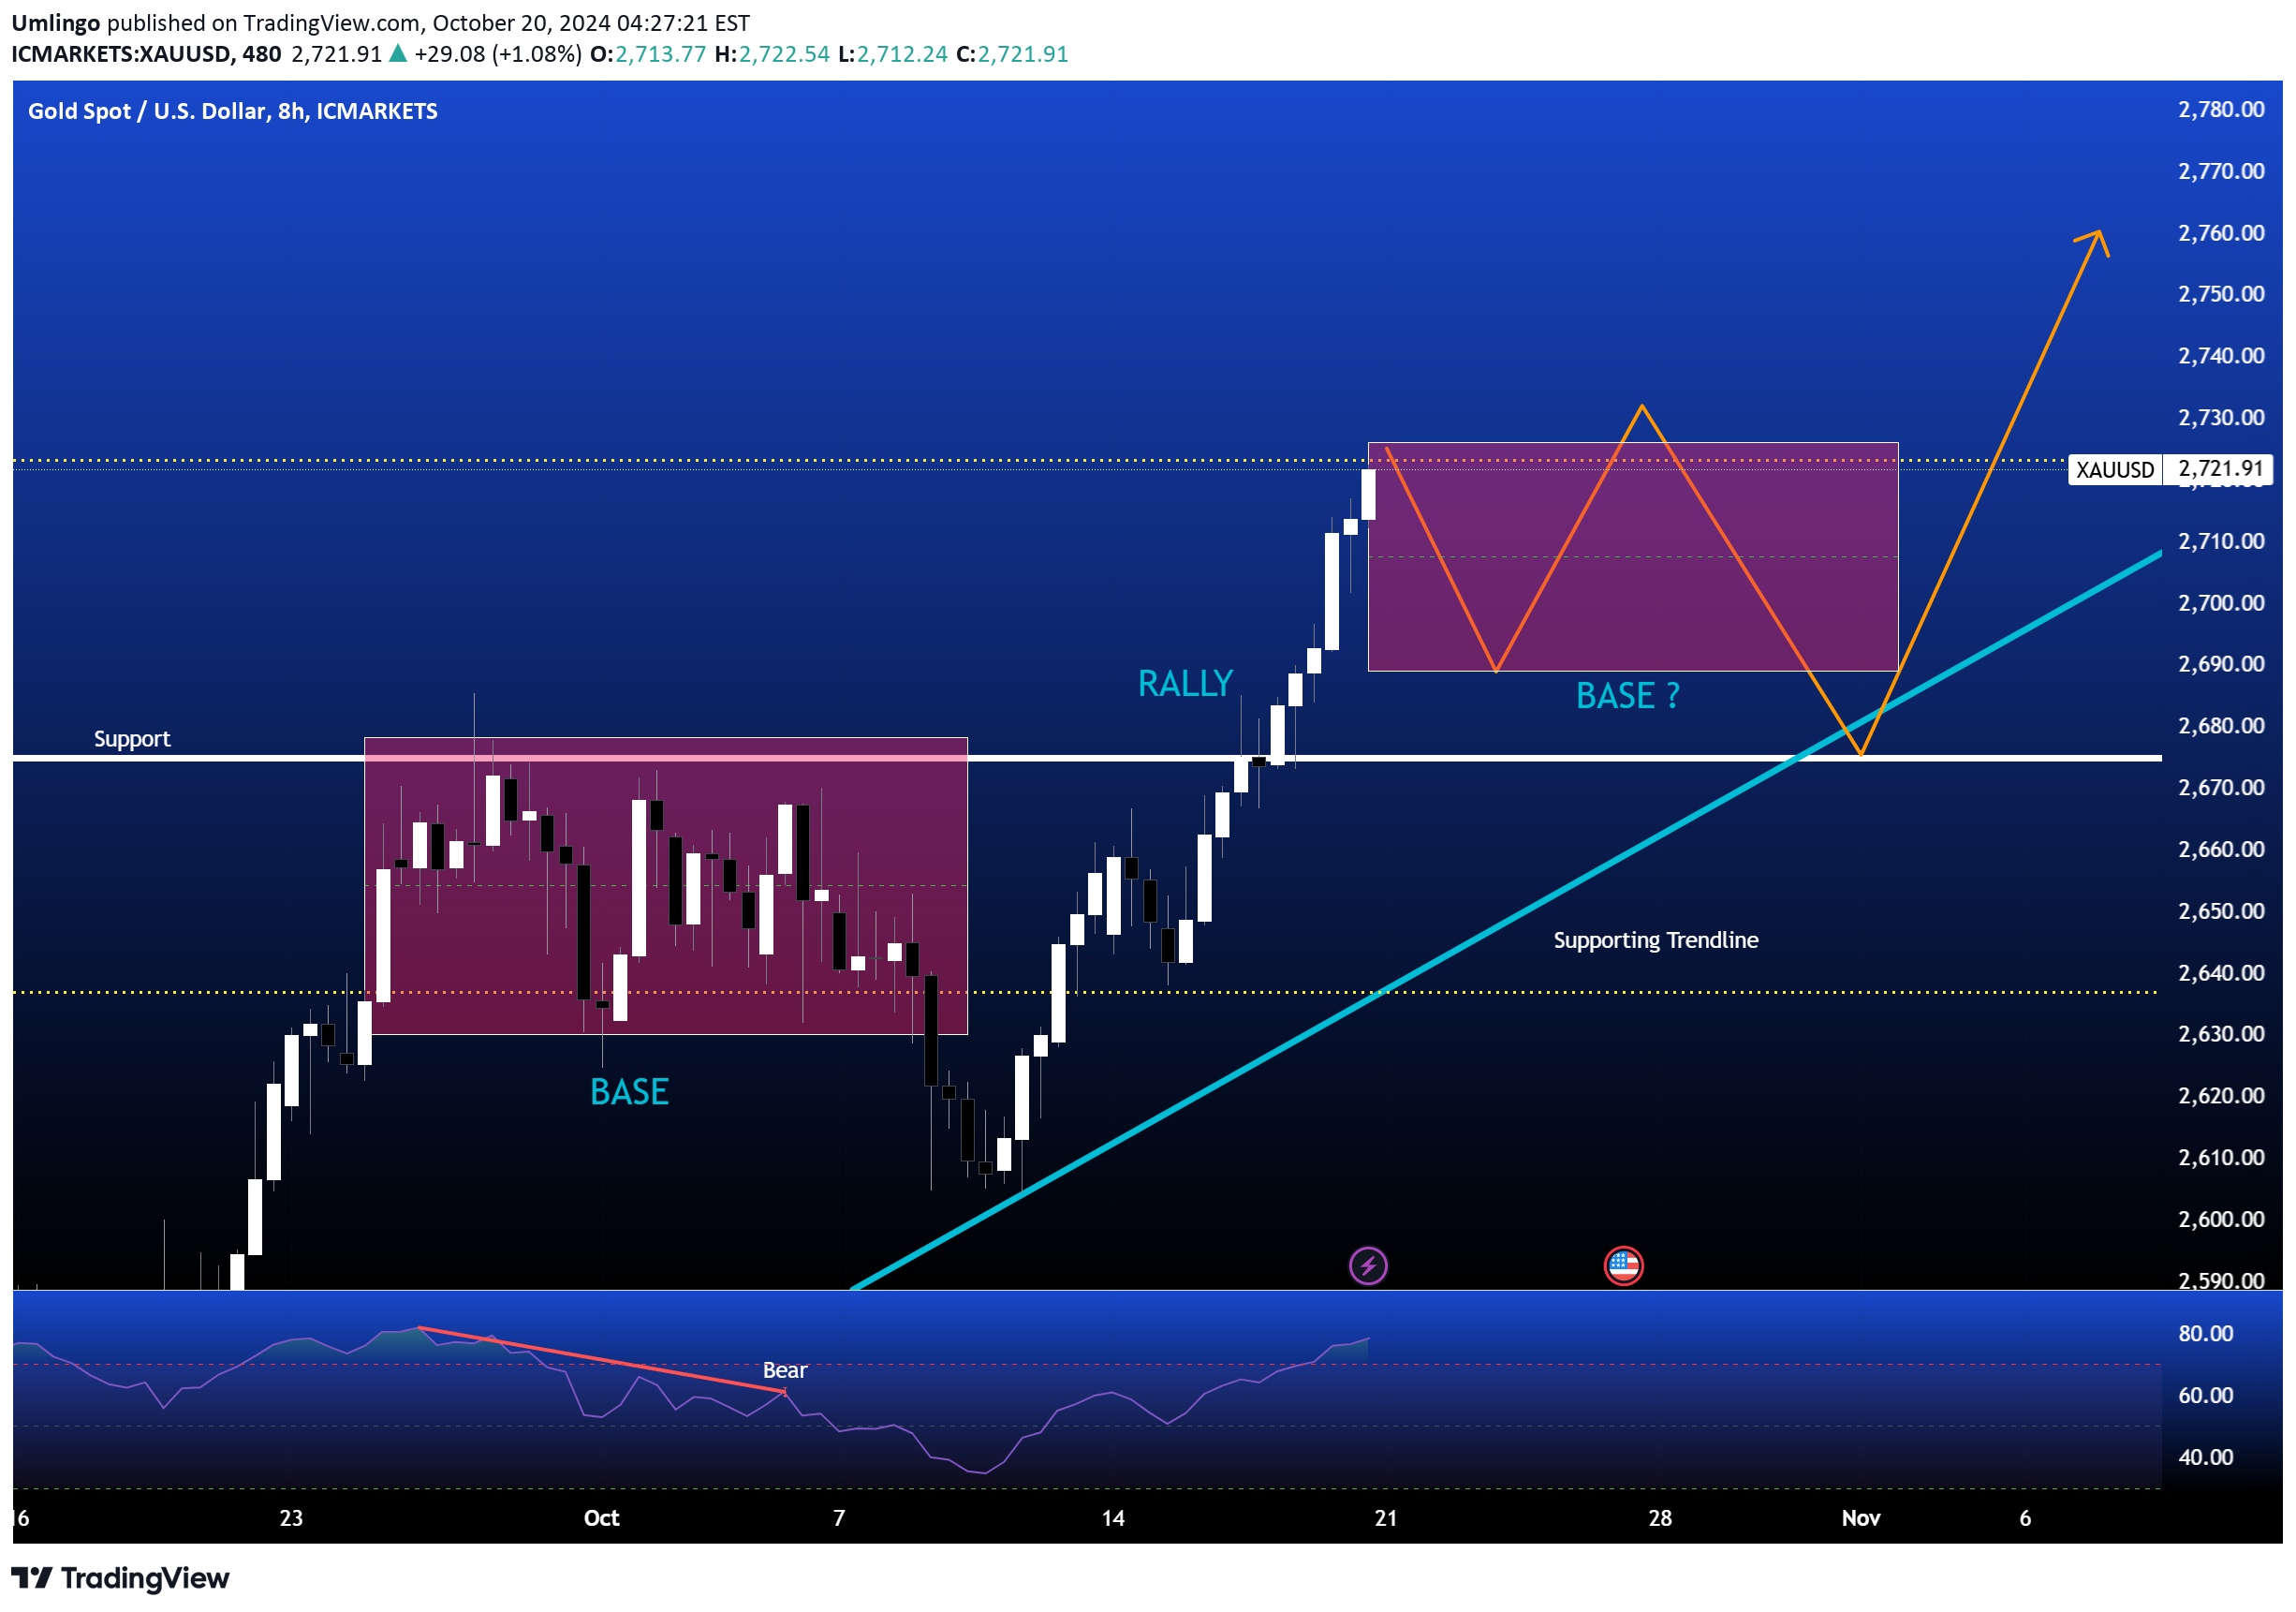
Gold had a fairly strong price appreciation last week, breaking out of a minor consolidation. A new ATH has formed. With the RSI printing in the OS Zone, maybe next week will see a consolidation of price as the smart money once again accumulates, before the next leg up. The bias is long, but only at a price level of 2675 - 2785 ,on a pullback.
Umlingo
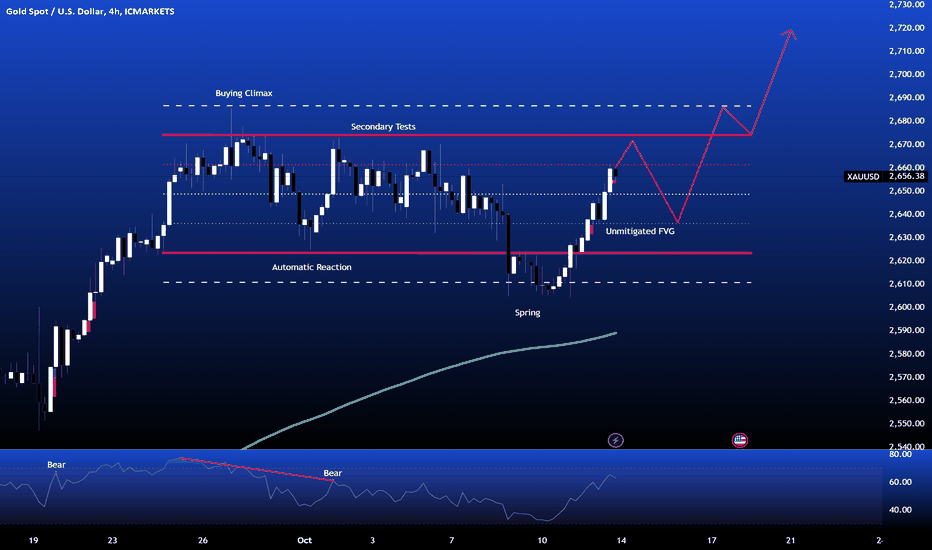
On the intraday chart, Gold has spent most of the last 2 trading weeks within an accumulation pattern. For the coming week considering Gold to stay within Range - resistance coming at 2675 and the support at the unmitigated Bullish FVG 2630. With price above the 200 MAV, the bias is to the long side and retracements to the 0 - 0.25 level of this range offer buying opportunity.Price is following the arrows.... sweetDone
Umlingo
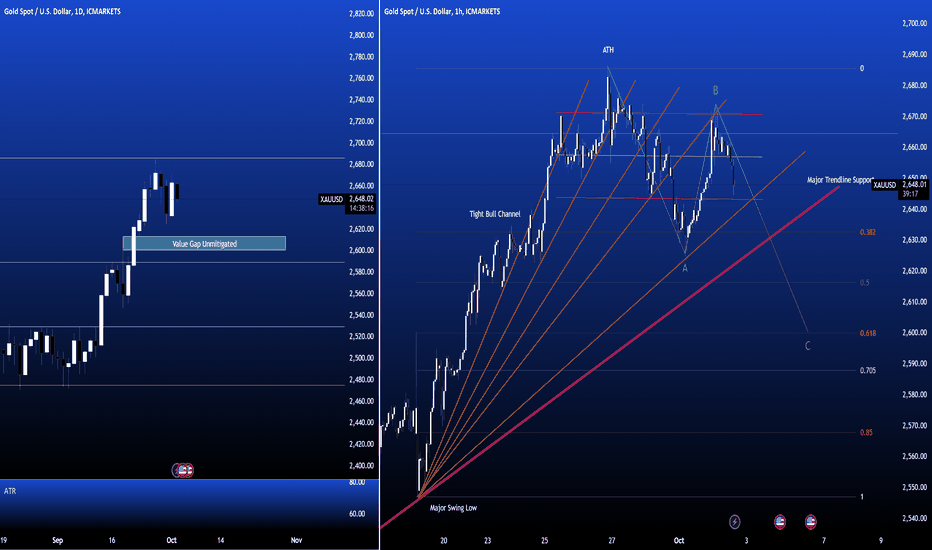
Gold has a daily Value Gap between $2600 and $2613. On the intraday chart we can see price consolidating, from the Bull Channel in late September 2023. We can see several support areas (fan lines) originating from the last major swing low. Looking for a scenario where price breaks Point A and searches the Value Gap ( Point C) , which is in the OTE zone for a long at Fibonacci 618, completing an ABC movement.It took 5 days to hit target....
Disclaimer
Any content and materials included in Sahmeto's website and official communication channels are a compilation of personal opinions and analyses and are not binding. They do not constitute any recommendation for buying, selling, entering or exiting the stock market and cryptocurrency market. Also, all news and analyses included in the website and channels are merely republished information from official and unofficial domestic and foreign sources, and it is obvious that users of the said content are responsible for following up and ensuring the authenticity and accuracy of the materials. Therefore, while disclaiming responsibility, it is declared that the responsibility for any decision-making, action, and potential profit and loss in the capital market and cryptocurrency market lies with the trader.