
UbiquitousAngles
@t_UbiquitousAngles

What symbols does the trader recommend buying?
Purchase History
پیام های تریدر
Filter
UbiquitousAngles
Benford's Law Applied to the S&P 500 (SPX)
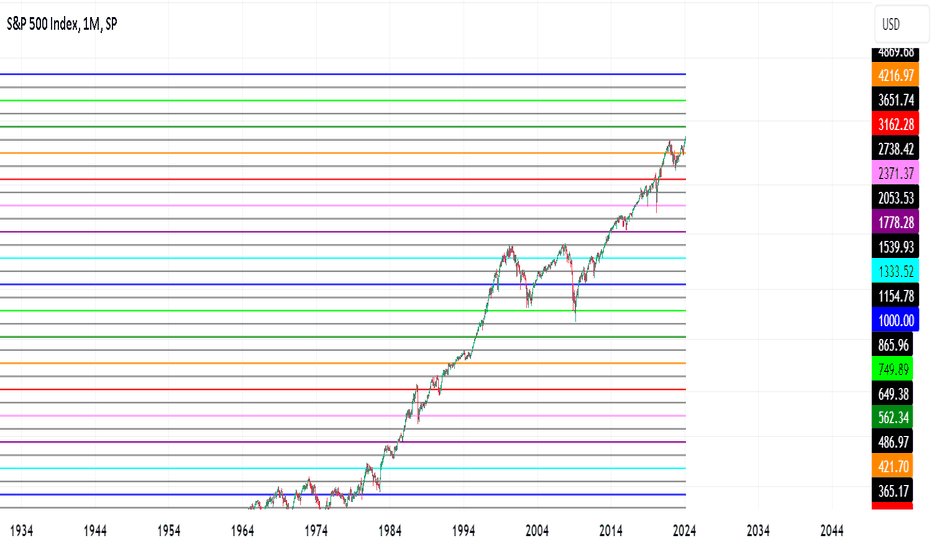
As I have shown in previous posts for other assets, these are the expected price levels explained as midpoints adhering to Benford's Law, also known as the Law of Anomalous Numbers. Even though these gridlines shown are not always the price level of a reversal, we see that oftentimes these midpoints do in fact act as support or resistance, and the midpoints not shown between the midpoints shown also act as relevant price levels. The probability of leading digits according to Benford's Law: P(1) = 30.1% P(2) = 17.6% P(3) = 12.5% P(4) = 9.7% P(5) = 7.9% P(6) = 6.7% P(7) = 5.8% P(8) = 5.1% P(9) = 4.6% Legend: 1.33 light blue 1.78 purple 2.37 pink 3.16 red 4.21 orange 5.62 dark green 7.50 light green 10 dark blue Next order of midpoints in gray For a more complete explanation to this methodology, check out the links below.
UbiquitousAngles
Benford's Law Applied To Gold

Gold is another asset that I follow and am not surprised to see it adhere to the principle of midpoints as explained by Benford's Law, also known as the Law of Anomalous Numbers. These gridlines I've drawn are midpoints and viewed on a logarithmic chart in order to more easily compare rates of change across magnitudes of price over a long period time. I have explained the rationale in previous posts, which you can view in the links below. The probability of leading digits according to Benford's Law: P(1) = 30.1% P(2) = 17.6% P(3) = 12.5% P(4) = 9.7% P(5) = 7.9% P(6) = 6.7% P(7) = 5.8% P(8) = 5.1% P(9) = 4.6% Legend: 1.33 light blue 1.78 purple 2.37 pink 3.16 red 4.21 orange 5.62 dark green 7.50 light green 10 dark blue Next order of midpoints in gray
UbiquitousAngles
Benford's Law Applied to Nano (XNO)

I have already introduced the Law of Anomalous Numbers, also known as Benford's Law. While using a Logarithmic price scale helps give perspective to the change in price over time, I have added additional lines equally spaced at each magnitude to further clarify price action. I first split each magnitude in half by taking the square root of 10, which equals 3.16. Applied to financial markets Benford's Law suggests price should spend half the time between 1*10^x and 3.16*10^x and the other half of the time between 3.16*10^x and 1*10^(x+1), etc. Despite this representation, we are only concerned with the leading digit, so price does not have to spend an equal amount of time at each magnitude. The longer the period of time and orders of magnitude in price we measure, the greater the likelihood the leading digit will gravitate toward the power law distribution seen below. We should note that subsequent digits appear to follow this distribution as well but gravitate toward a uniform distribution the further away we measure from the leading digit. This is independent of the base number system used and can most easily be understood using a percent change perspective. The probability of leading digits: P(1) = 30.1% P(2) = 17.6% P(3) = 12.5% P(4) = 9.7% P(5) = 7.9% P(6) = 6.7% P(7) = 5.8% P(8) = 5.1% P(9) = 4.6% Legend and how each number can be derived but arranged in numeric order: sqrt(1.78) = 1.33 light blue sqrt(3.16) = 1.78 purple 1.33*1.78 = 2.37 pink sqrt(10) = 3.16 red 1.33*3.16 = 4.21 orange 1.78*3.16 = 5.62 dark green 2.37*3.16 = 7.50 light green 10 dark blue Next order of midpoints in gray I find it interesting how midpoints, midpoints of midpoints, etc., seem to consistently interact with price as support and resistance rather than just being an arbitrary number along a supposed random walk. If we continue to take midpoints of midpoints infinitely, we will naturally fill in every number. We then gather that the most significant number is 1 (across magnitudes), followed by its midpoint (3.16), followed by the midpoints of the midpoint (1.78 and 5.62), followed by the midpoints of midpoints (1.33, 2.37, 4.21, and 7.5), etc. Market pressures force price in one direction or another but seem to shift or alleviate around these and other midpoints until that pressure subsides or other pressures arise. These price levels are not the cause yet are interconnected with the effect as seen on this chart and others.
UbiquitousAngles
Change Comes Quickly

To many factors at play to even come close to timing the paradigm shift, but the thesis has remained unchanged as time continues to provide supporting evidence. Fiat currencies are built upon debt, which has an element of time. Since time is a constant and cannot be manipulated, all we have to do as investors is wait. More money will continue to be created in the long term, as a byproduct of banks operating with fractional reserves and due to the extraordinary measures taken by the Fed towards the end of credit cycles in order to soften the inevitable crash and spur the next boom. There is no tolerance for prolonged deflation as years of business-as-usual moderate inflation is the expectation, and the positive feedback loop is more immediate and severe during the busts that follow since debt cannot be repaid and further debt will not be issued. This forecast was created using the "Bars Pattern"
UbiquitousAngles

Disclaimer
Any content and materials included in Sahmeto's website and official communication channels are a compilation of personal opinions and analyses and are not binding. They do not constitute any recommendation for buying, selling, entering or exiting the stock market and cryptocurrency market. Also, all news and analyses included in the website and channels are merely republished information from official and unofficial domestic and foreign sources, and it is obvious that users of the said content are responsible for following up and ensuring the authenticity and accuracy of the materials. Therefore, while disclaiming responsibility, it is declared that the responsibility for any decision-making, action, and potential profit and loss in the capital market and cryptocurrency market lies with the trader.