
US30EMPIRE
@t_US30EMPIRE

What symbols does the trader recommend buying?
Purchase History
پیام های تریدر
Filter
US30EMPIRE
Gold XAUUSD market analysis
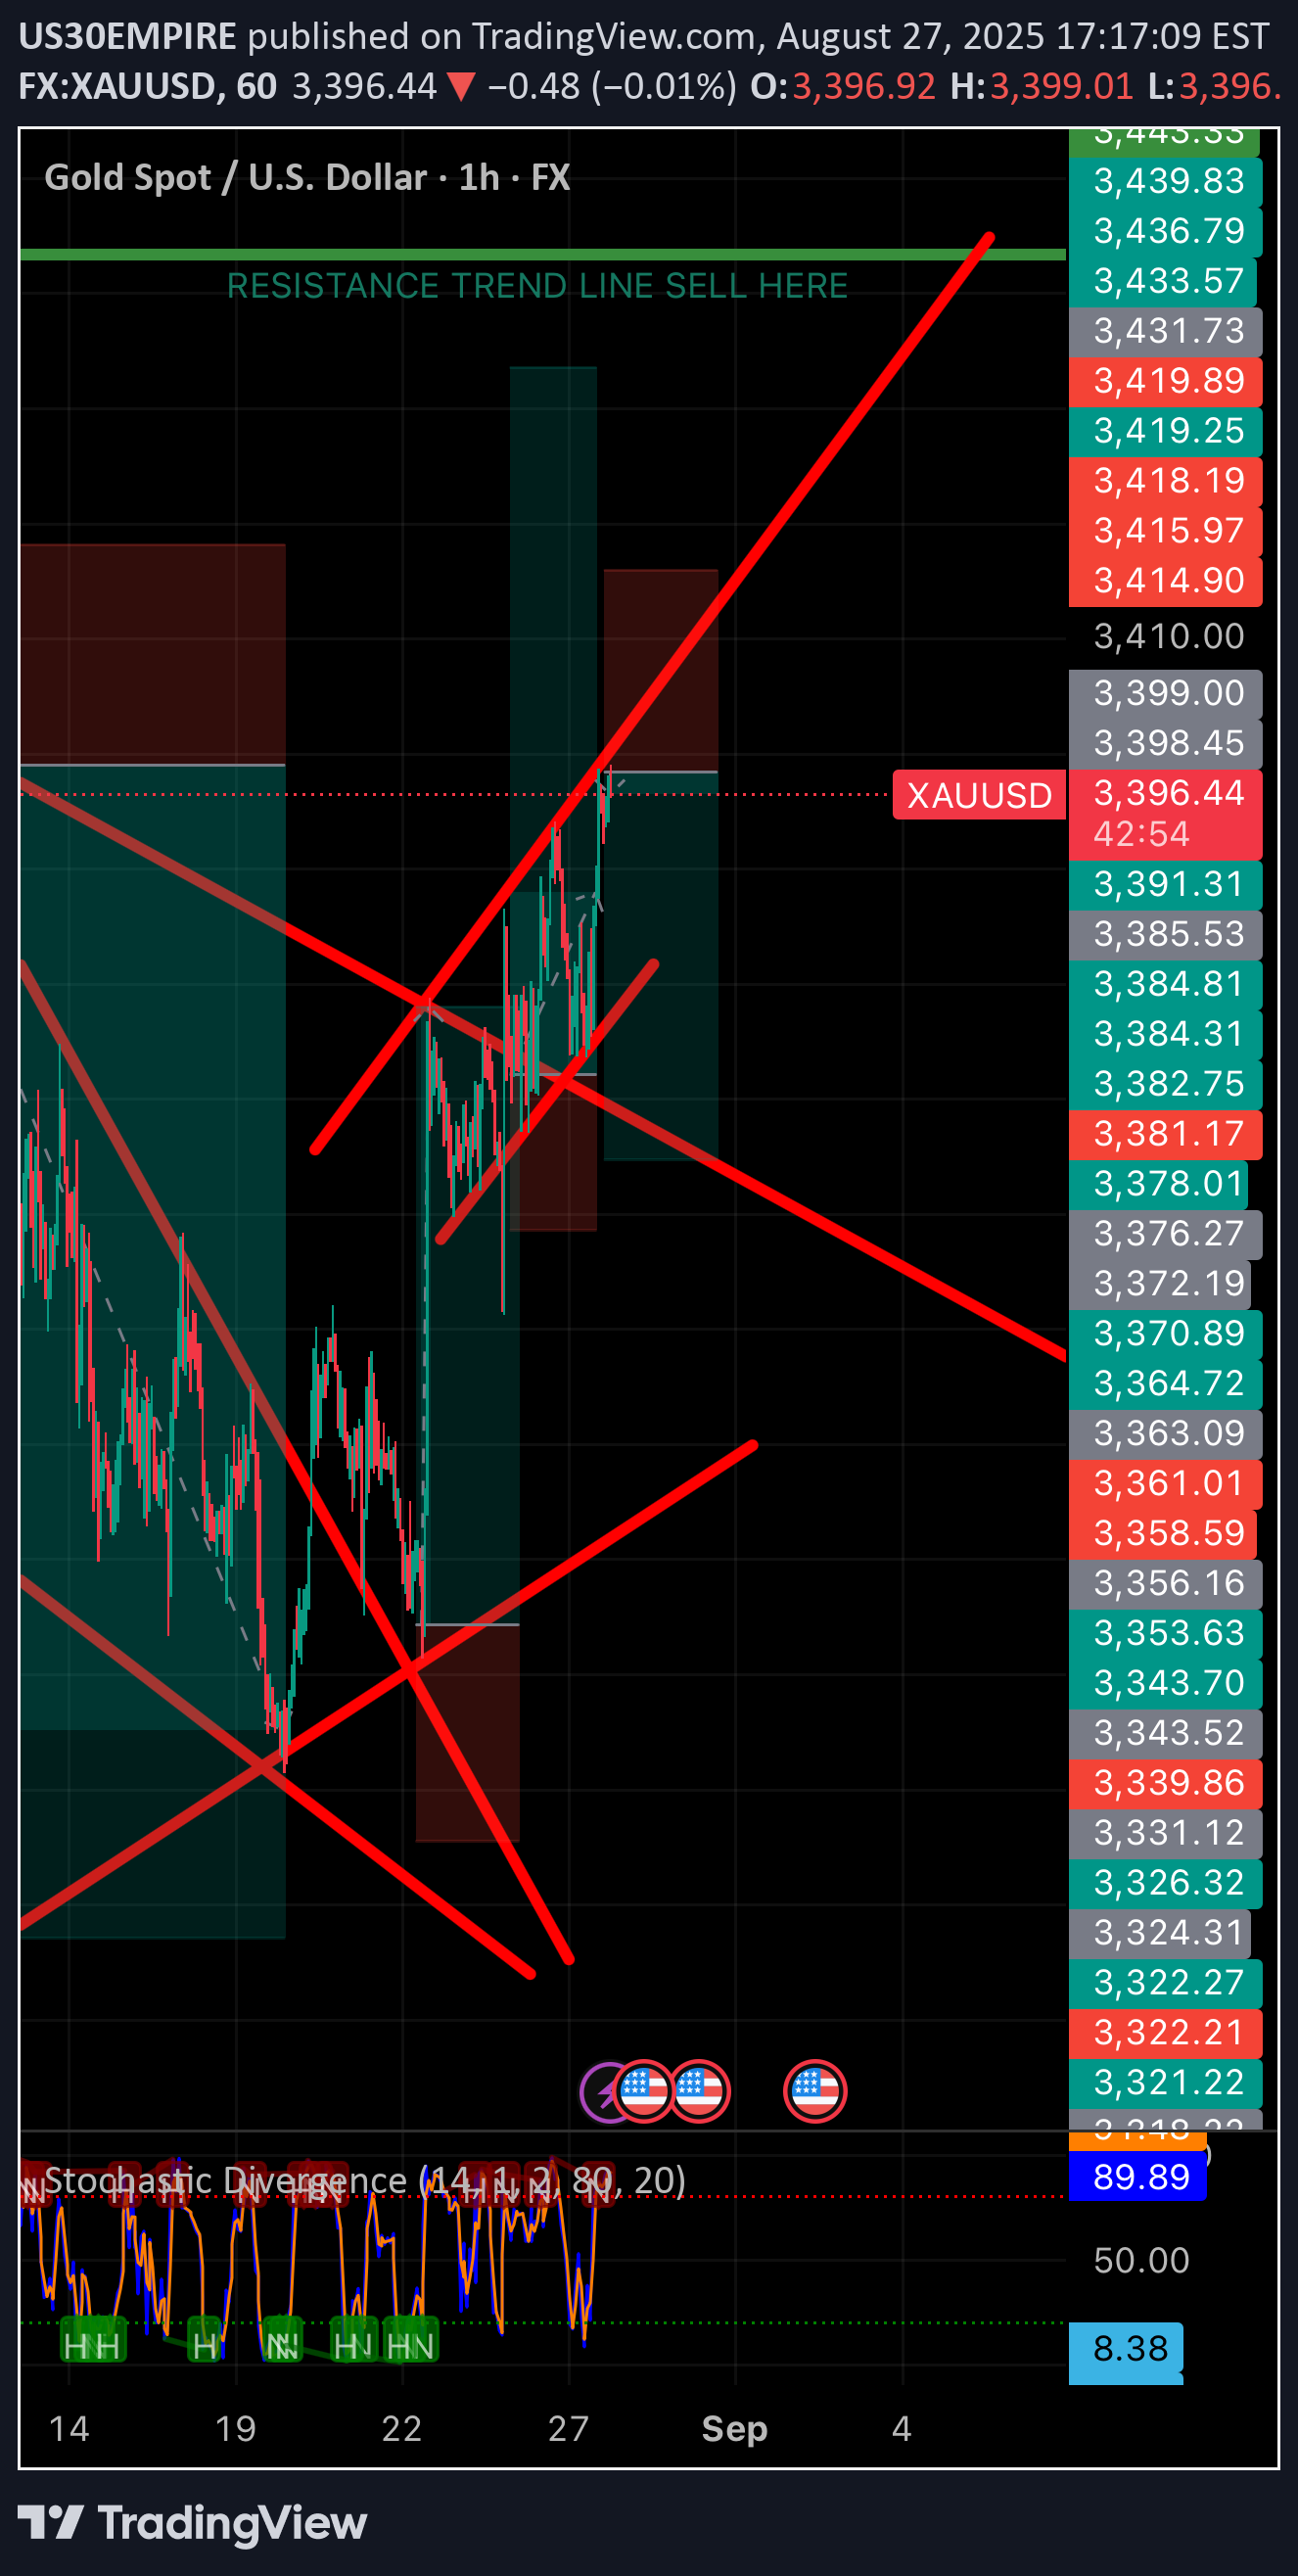
Gold #xauusd technical analysis. Price is bouncing off trend lines as support and resistance. Price is at resistance levels and should continue to drop down to support levels at the 3380 area. If you are forex trading gold #xauusd the short is short term goal. If you are trading futures we are still in a bull market overall direction is up. We will see the market retrace here back to our support trend lines.
US30EMPIRE
Gold sell opportunity
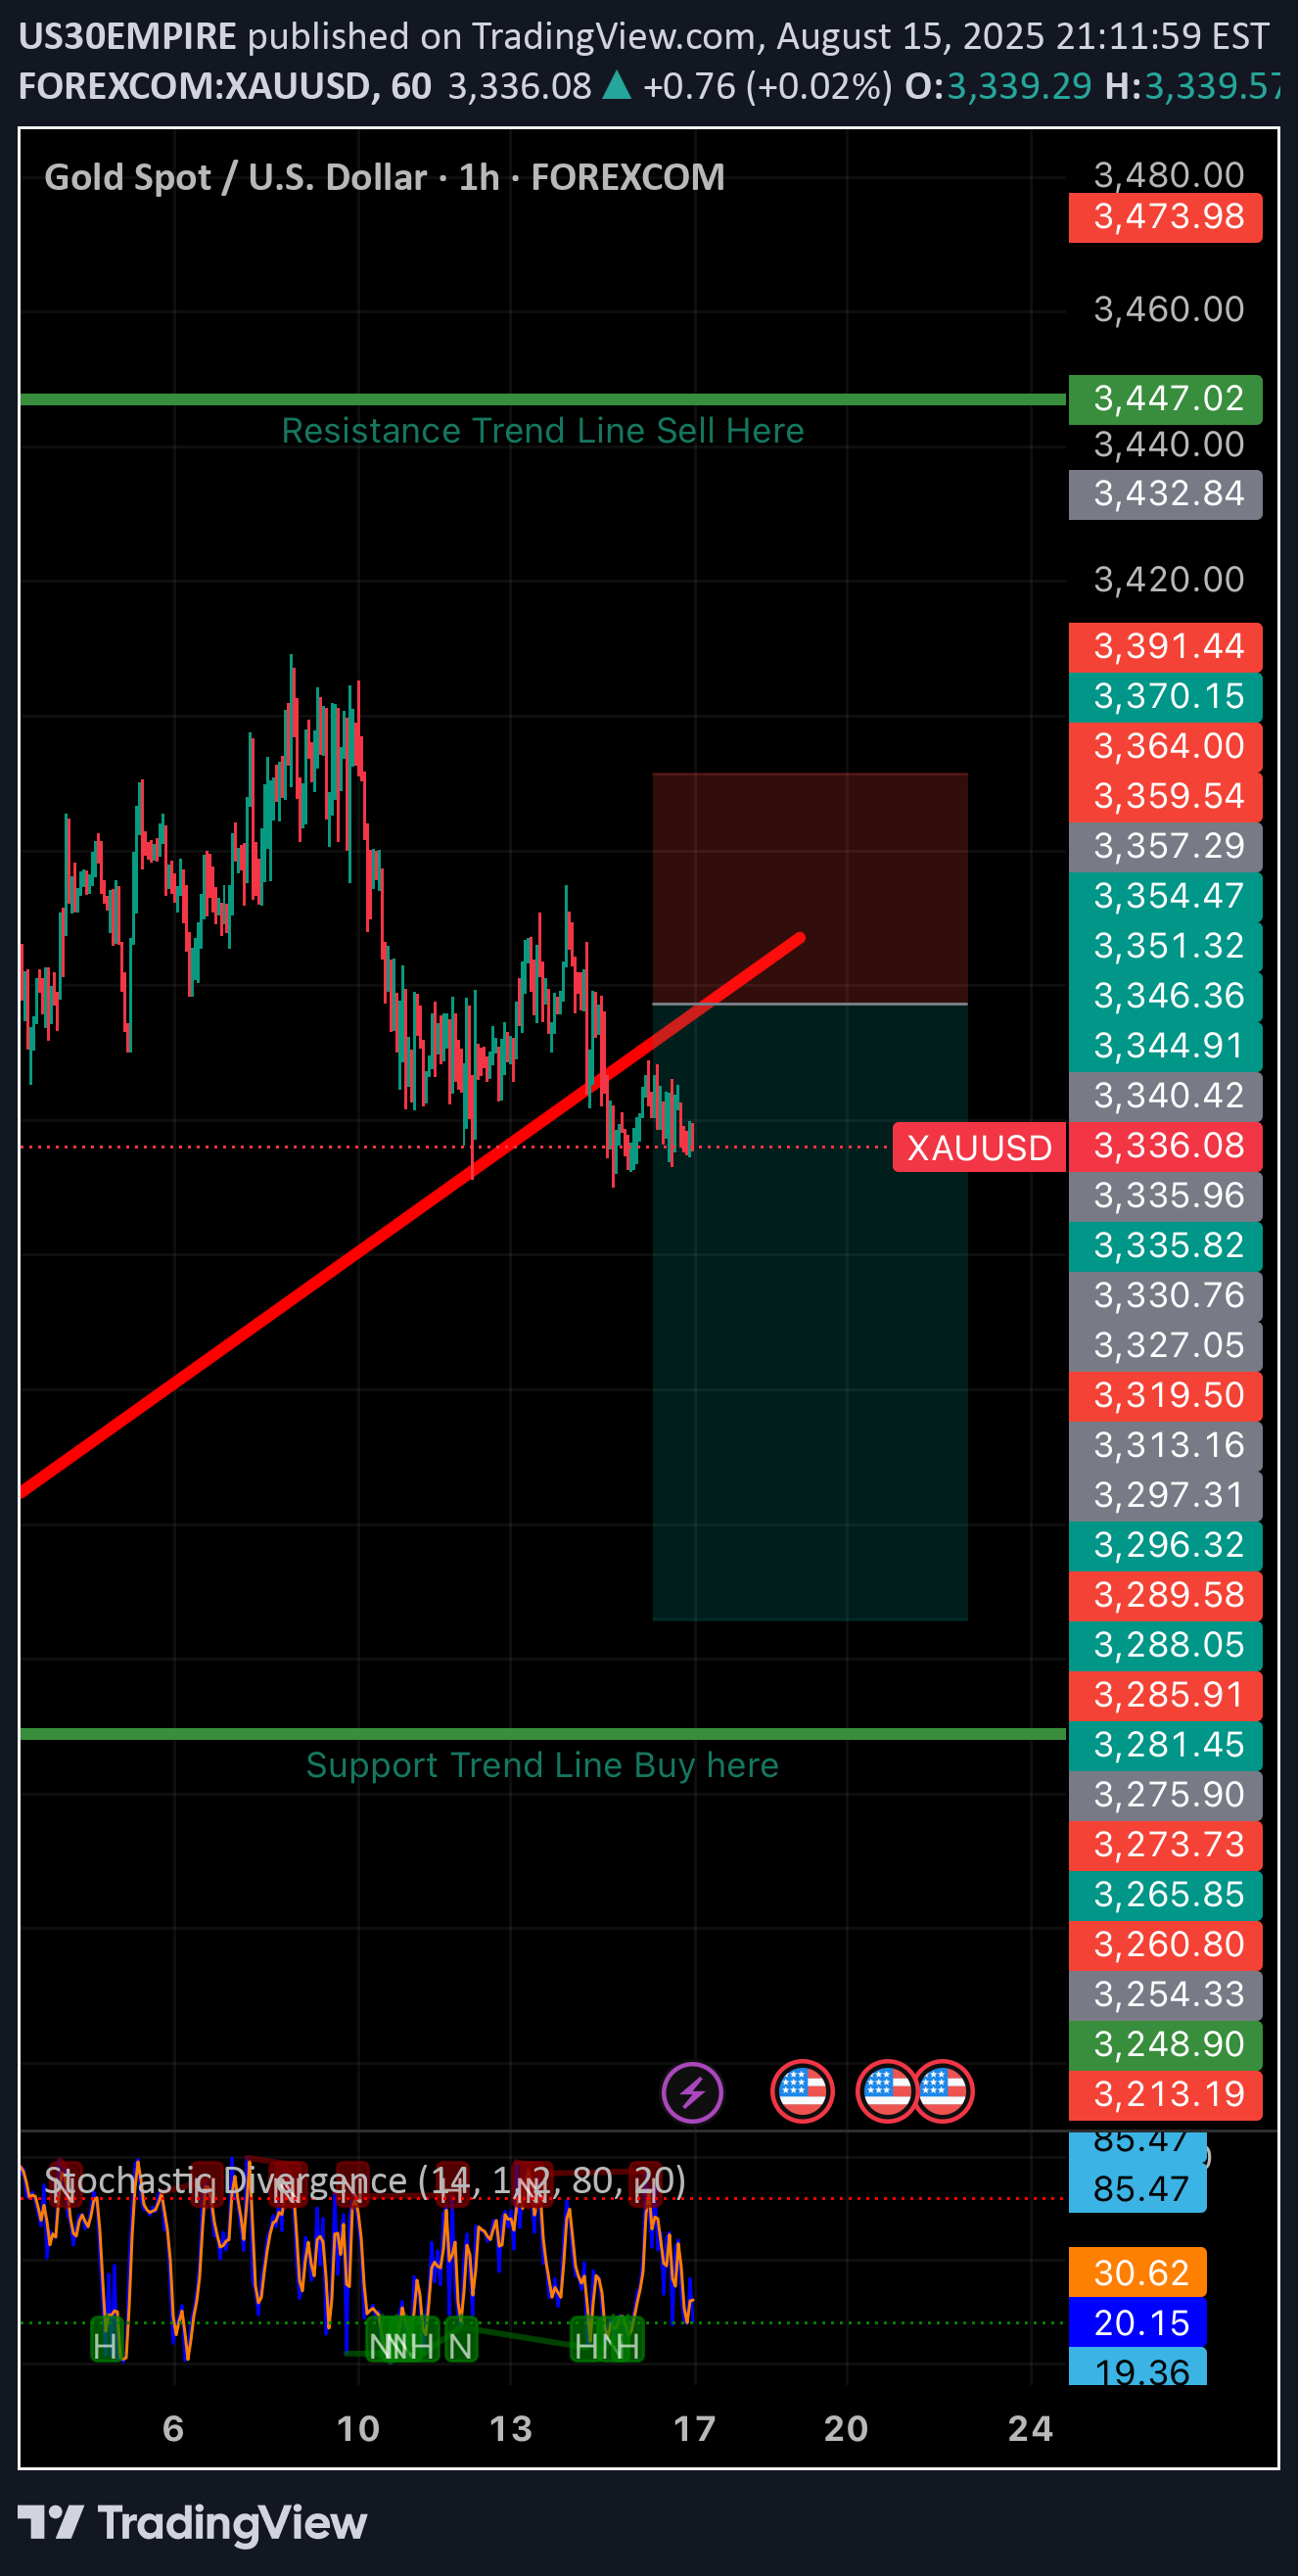
Gold price broke through trend line. This is clear breakout opportunity to the down side
US30EMPIRE
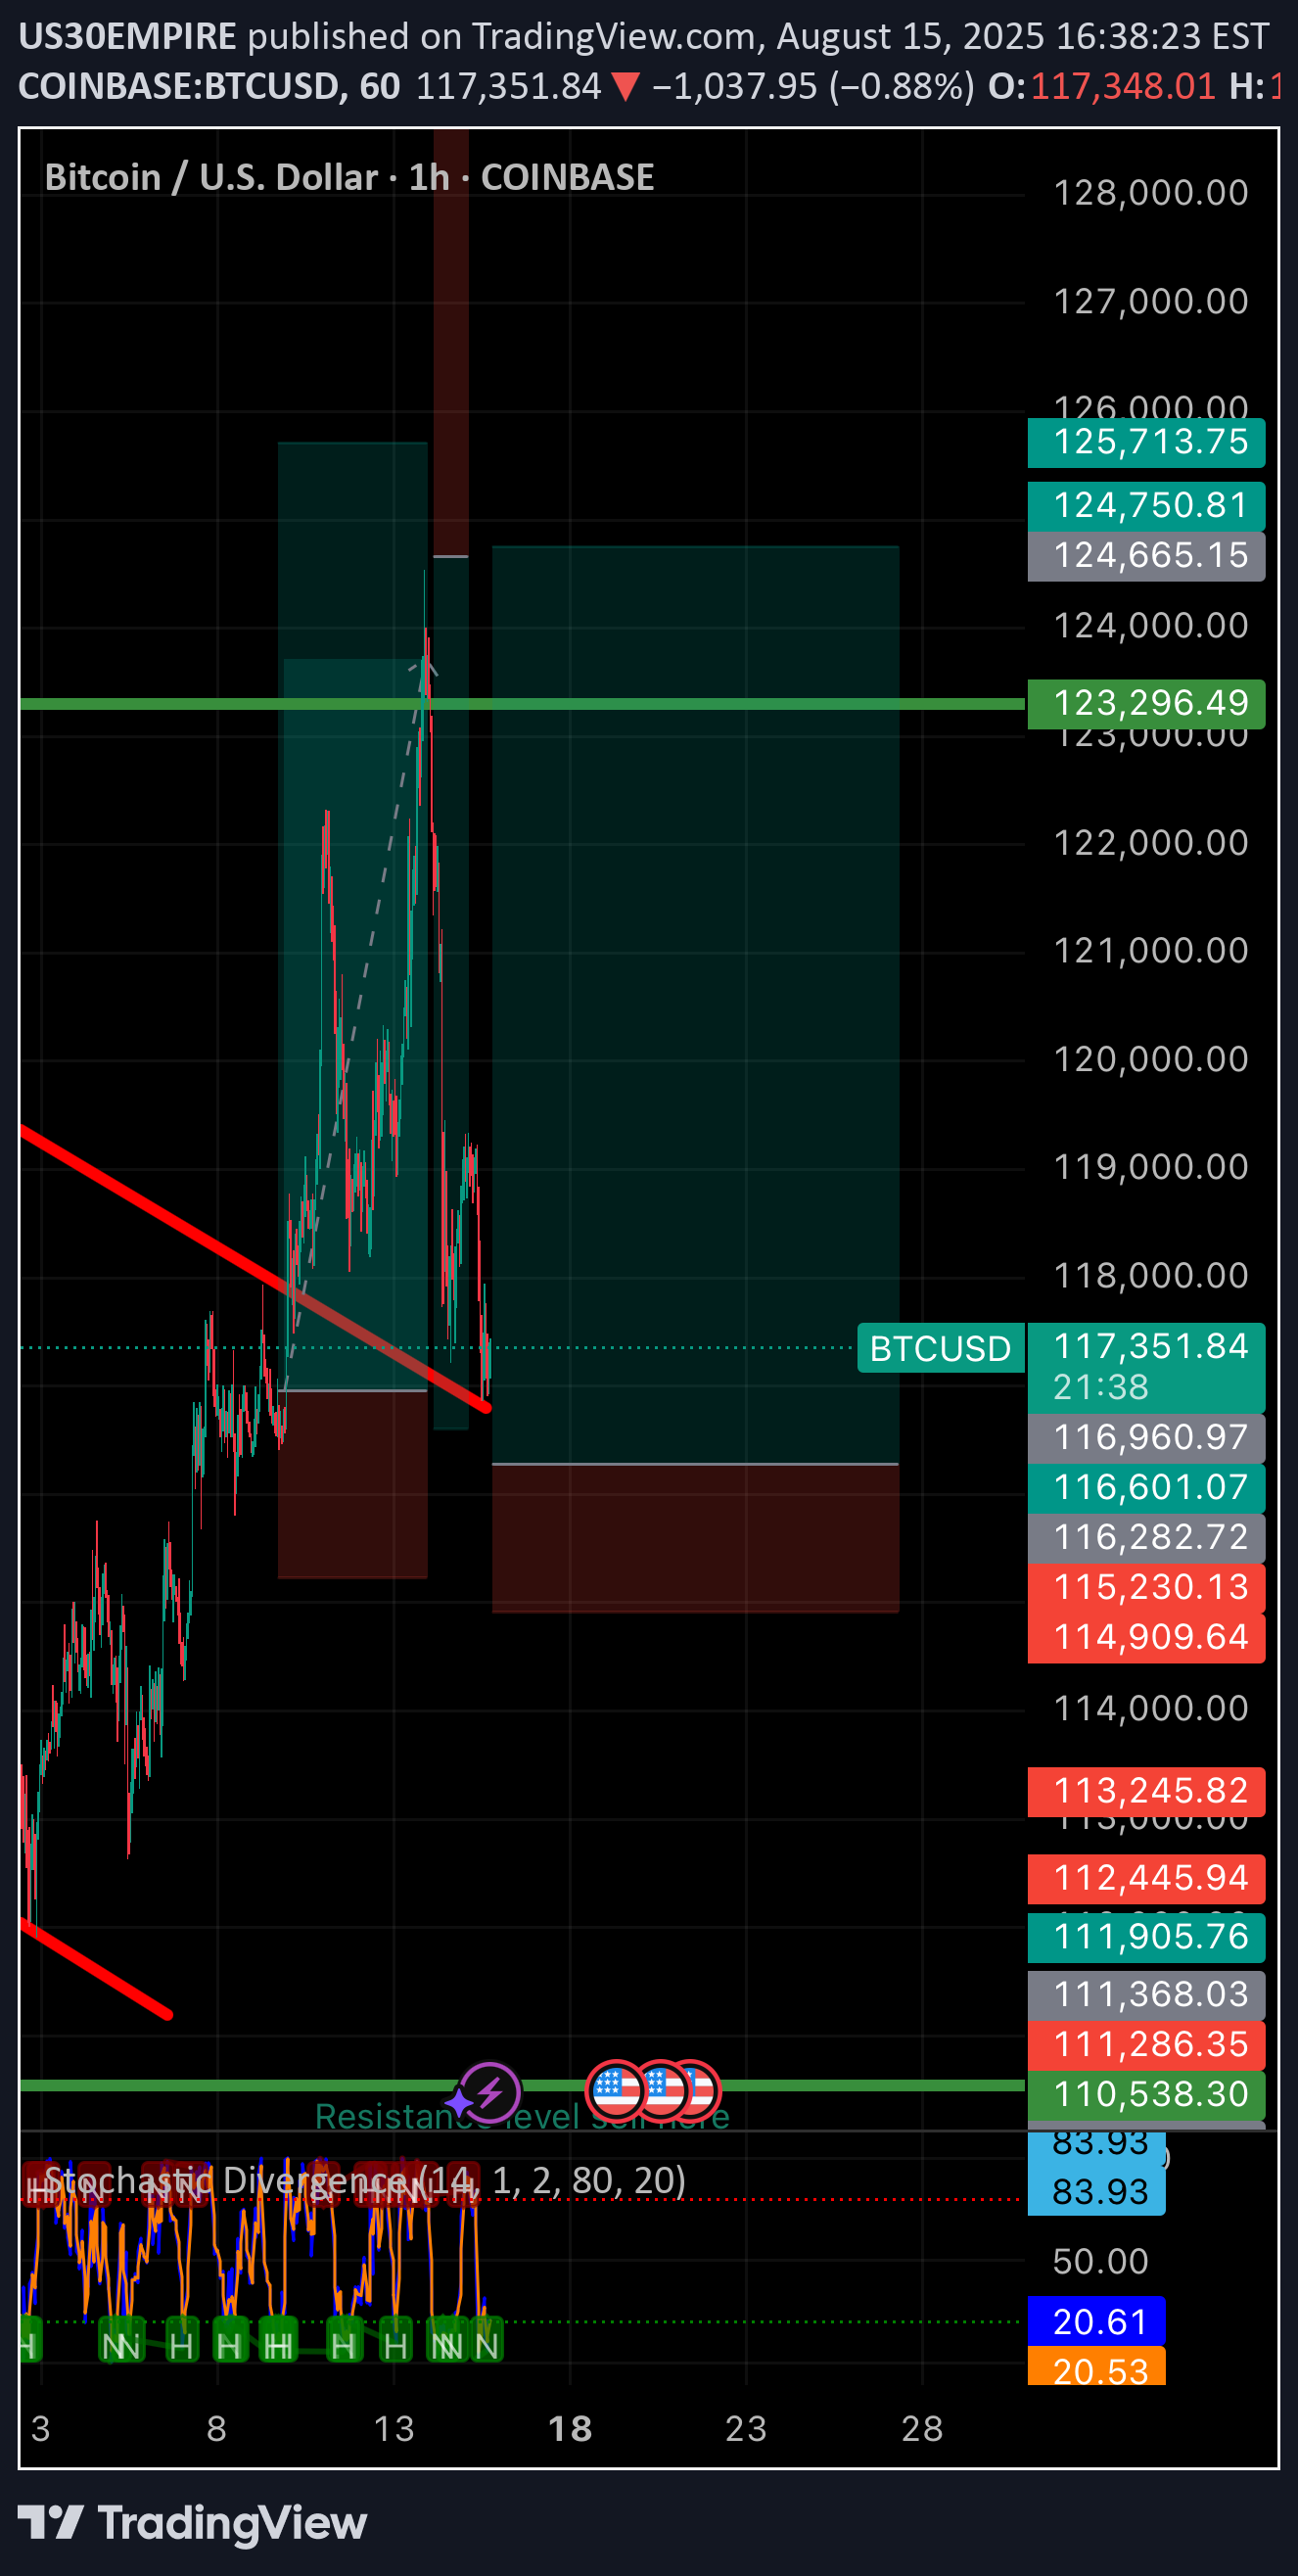
Bitcoin buy technical analysis
US30EMPIRE
Bitcoin sell technical analysis

Description:Bitcoin is rejecting major resistance near $94,000 after forming a bearish engulfing candle on the 4H chart.•Key Resistance: $94,000–$95,000 zone rejected with strong selling pressure.•RSI Divergence: Bearish divergence between price and RSI confirms weakness.•Break of Support: Price broke minor support at $92,800, shifting short-term structure bearish.•Moving Averages: Trading below the 50 EMA on the 4H chart, signaling bearish momentum.Sell Setup:•Look for entries around $93,500–$94,000 (retest zone).•Stop-loss above $95,000.•TP1: $91,000•TP2: $88,500Bitcoin is showing clear signs of a pullback — sellers are currently in control.
US30EMPIRE
Xauusd sell opportunity GTE

Xauusd sell opportunity GTE VIP. Technicals looking like it will drop to bottom support zone
US30EMPIRE

Us30 sell technical analysis Good technicals Analyst predict $3300 area
US30EMPIRE

(DOGE) Market Analysis as of February 8, 2025**Current Price:** $0.25199 **Previous Close:** $0.24657 **Day Change:** +$0.00542 (+2.20%) Market Status:- **Open:** The market is currently open for trading.- **Price Movement:** Dogecoin has experienced a slight upward movement with a 2.20% increase in the current trading session.- **Price Range:** The price has fluctuated between $0.23866 and $0.2618 recently.Recommendation:Given the current upward trend, here is a speculative trading strategy:- **Buy/Sell Recommendation:** **Buy**- **Stop Loss Level:** $0.2400 (to limit potential losses if the price drops)- **Take Profit Level:** $0.2700 (to secure gains if the price rises)**Disclaimer:** Cryptocurrency investments are highly volatile and speculative. This recommendation is based on current market trends and should be considered as part of a broader investment strategy. Always conduct your own research or consult with a financial advisor before making investment decisions.
US30EMPIRE

US30EMPIRE

Market Analysis: Gold (XAU/USD)Gold is positioned for a bullish move, as the price has successfully passed through the Imbalance Fair Value Gap (IFVG), indicating strong momentum to the upside. The breakout confirms buyer dominance, and the stochastic divergence supports continued bullish pressure.Current price action suggests a potential rally toward key resistance zones, with 2883.3 acting as the next major target. Look for pullbacks as buying opportunities to maximize entry efficiency.Stay long on gold as the bullish structure remains intact for further gains.
US30EMPIRE
Gold buy technical analysis

Gold buy technical analysis. Trend is showing some buy opportunities
Disclaimer
Any content and materials included in Sahmeto's website and official communication channels are a compilation of personal opinions and analyses and are not binding. They do not constitute any recommendation for buying, selling, entering or exiting the stock market and cryptocurrency market. Also, all news and analyses included in the website and channels are merely republished information from official and unofficial domestic and foreign sources, and it is obvious that users of the said content are responsible for following up and ensuring the authenticity and accuracy of the materials. Therefore, while disclaiming responsibility, it is declared that the responsibility for any decision-making, action, and potential profit and loss in the capital market and cryptocurrency market lies with the trader.