
UAE_USA_GOLD_TRADERS
@t_UAE_USA_GOLD_TRADERS

What symbols does the trader recommend buying?
Purchase History
پیام های تریدر
Filter
UAE_USA_GOLD_TRADERS
BTCUSD Approaching Support Trendline | Potential Bullish Continu
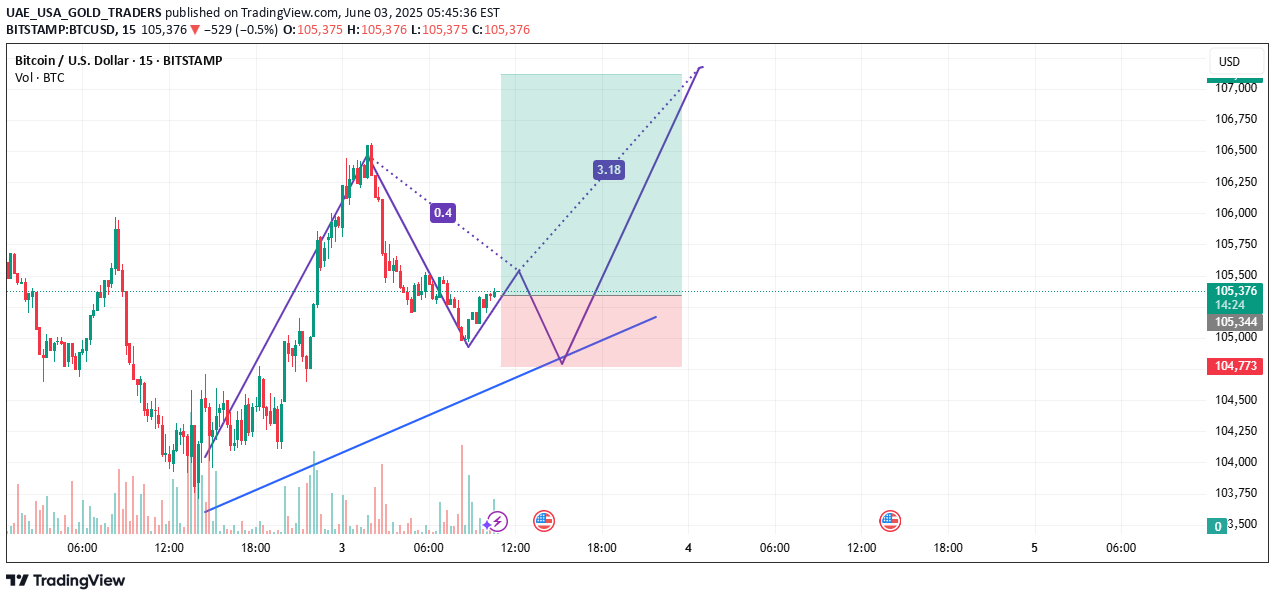
Bitcoin (BTCUSD) is showing a potential bullish continuation pattern on the 15-minute chart. Price is currently near a rising trendline support, with a possible bounce forming. The projected move suggests a strong upside if the support holds. Key levels to monitor include the recent low around 104,773 and upside target near 107,000. The setup indicates a favorable risk-reward structure. This is a technical analysis perspective and intended for charting reference.wow wonderful 😊well-done
UAE_USA_GOLD_TRADERS
"XAUUSD Potential Reversal Zones | Harmonic Setup in Play"
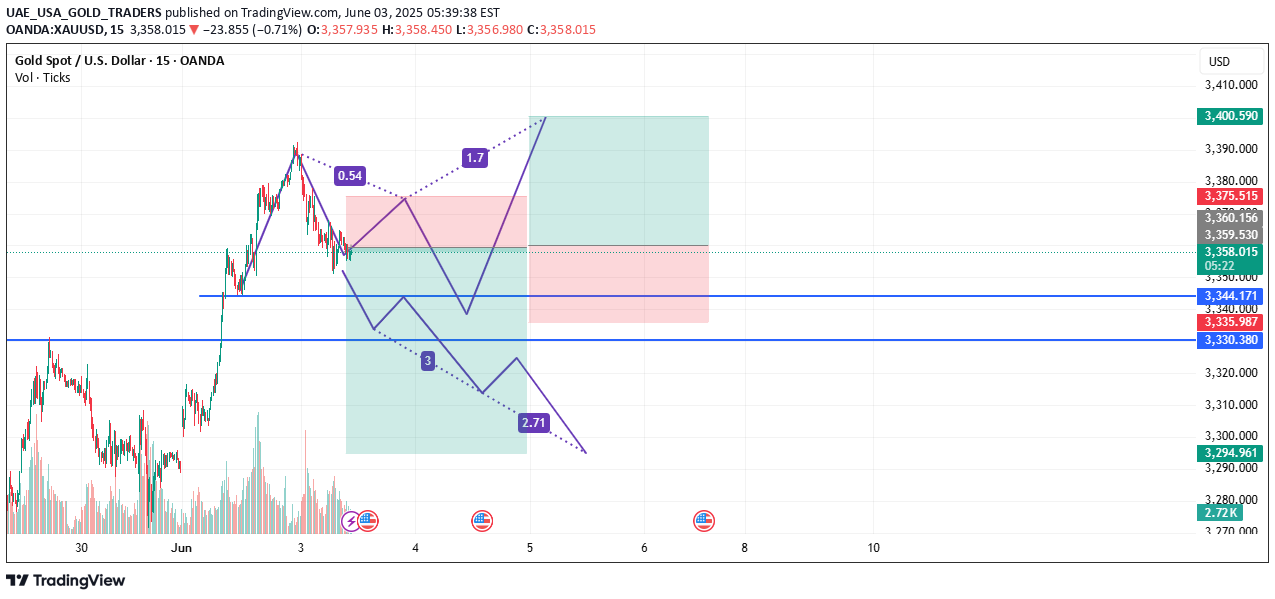
Gold (XAUUSD) is showing a possible harmonic structure forming on the 15-minute chart. Key levels around 3344 and 3330 are being watched closely as potential support zones, with bullish and bearish scenarios mapped. Price action around these levels may offer clues for the next directional move. Chart illustrates both bullish breakout and extended correction scenarios. This is a technical outlook only, not financial advice.wow wonderful 💯well-done
UAE_USA_GOLD_TRADERS
BTCUSD – Bullish Channel Support Bounce Setup

BTCUSD is currently trading within a clearly defined ascending channel on the 15-minute chart. The price recently touched the lower boundary of the channel and is showing signs of a potential bullish bounce.This structure suggests that the pair may continue respecting the trend and head toward the upper boundary of the channel, offering a favorable risk-to-reward opportunity.The trade plan includes a long setup with stop-loss placed just below the channel support and a target near the upper resistance zone. Volume remains moderate, supporting gradual upward momentum.Technical Highlights:Pattern: Ascending ChannelKey Support: Lower trendlineEntry Zone: Near current supportTarget Zone: Around 106,500Stop-Loss: Below recent swing low (around 104,185)This is a technical chart idea based on price action and structure. Please manage your risk accordingly.active nowhold for 6 hours
UAE_USA_GOLD_TRADERS
XAUUSD – Inverse Head and Shoulders Breakout

An inverse head and shoulders pattern has formed on the 15-minute chart of XAUUSD. The left shoulder, head, and right shoulder are clearly marked, and a breakout above the neckline has occurred with strong bullish momentum.Price has retested the breakout zone and is showing signs of support above the neckline and trendline. Volume also confirms the move, with increased buying pressure during the breakout.This setup indicates a potential bullish continuation. The trade idea includes a favorable risk-to-reward ratio, with the target zone near 3390 and stop-loss placed just below the neckline support around 3330.Technical Highlights:Pattern: Inverse Head and ShouldersNeckline Breakout ConfirmedSupport Levels: 3303, 3330Resistance/Target Zone: 3390+Volume Confirmation: PresentThis is a technical analysis idea and not financial advice. Always manage your risk.its time to trade active nowhold for 4 hours
UAE_USA_GOLD_TRADERS
BTC/USD Potential Bullish Reversal – Falling Wedge Breakout Watc

Bitcoin is showing signs of a potential reversal on the 15-minute timeframe. A Falling Wedge pattern is forming, often seen as a possible early signal for upside continuation.📌 Technical Overview:Price is currently testing the wedge resistance.If price breaks out and retests the wedge, it could lead to a continuation toward the 108,995–109,199 zone.Strong horizontal support seen around 104,636.Bullish price action forming higher lows.📈 Breakout Confirmation:A clear breakout and retest of the descending trendline could initiate momentum toward the upper resistance zone.🟢 Target Area: 108,995–109,199🔴 Support Level: 104,636⚠️ Invalidation: Below 104,300 zone🔎 Always observe price action and volume confirmation before making decisions. Use proper risk management.trade active nowhold for 6 hours
UAE_USA_GOLD_TRADERS
Gold (XAU/USD) Bullish Reversal Setup – Inverse Head & Shoulder

Description (Safe for TradingView):Gold on the 15-minute chart is forming a classic Inverse Head and Shoulders pattern, signaling a potential trend reversal from bearish to bullish. The structure is well-formed with the Left Shoulder, Head, and Right Shoulder clearly visible.✅ Key Technical Highlights:Neckline breakout occurred around the 3303.165 level.Price is currently retesting the neckline as support.Volume confirms breakout strength.Potential for upward movement toward the 3340–3350 zone if support holds.🔵 Support Zone: 3302–3303🔴 Risk Management: Stop below recent swing low (near 3288)🟢 Target Zone: 3340+📊 Always follow your risk management rules. This is a potential opportunity, not financial advice.trade active nowhold for 8 hours
UAE_USA_GOLD_TRADERS
BTC/USD Testing Resistance Near Downtrend Line

Bitcoin is currently approaching a descending trendline and horizontal resistance zone around $109,148–$109,177 on the 15-minute chart. Price has shown a steady climb, but is now testing a key level that previously acted as a supply zone.If price fails to break and close above this level, a potential retracement toward the $107,437 area may follow. The setup displayed on the chart suggests a short-term risk-managed approach, with clearly defined zones for price reaction.Volume remains steady, and this could be a decision point for bulls and bears in the short term. Watching for confirmation either way.📌 For educational and charting purposes only.active timehold 7 hours
UAE_USA_GOLD_TRADERS
XAU/USD Breakout Opportunity Above Descending Trendline

Gold (XAU/USD) is showing a potential bullish breakout on the 15-minute chart. Price action has broken above a descending trendline, signaling a possible reversal from the recent downtrend. A strong bullish candle has closed above the trendline and horizontal resistance near the $3,302–$3,303 area, which may now act as a support.The setup shows a favorable risk-to-reward ratio with a long position targeting around $3,354, and a stop-loss placed just below the recent breakout zone at $3,288. This indicates a bullish bias as long as price holds above the broken trendline and horizontal support.Volume appears to be increasing, supporting the strength of the breakout.⚠️ This analysis is for educational purposes only and not financial advice.actve nowhold for 5 hours
UAE_USA_GOLD_TRADERS
GOLD Breakout Retest – Long Setup with Strong Risk-Reward

---📝 Description:Price has broken out of the descending trendline and is now retesting the breakout zone. A bullish reaction near the 3,285 support level indicates potential for a strong upside move. Entry is placed near the retest, with a tight stop loss and a high reward target around 3,360.This setup offers a great risk-to-reward ratio and aligns with classic breakout-retest price action.Technical Confluences:Breakout of descending trendlineRetest of horizontal support zoneBullish wick rejectionVolume spike confirmationAlways use proper risk management. This is not financial advice. 🔐trades active timehold for 4 hours
UAE_USA_GOLD_TRADERS
BTCUSD | Head and Shoulders Pattern on 15m Chart Suggesting Pote

Bitcoin (BTCUSD) on the 15-minute timeframe has formed a classic Head and Shoulders structure, a well-known pattern often associated with possible short-term trend reversals.Key Details:Pattern: Clear Left Shoulder, Head, and Right Shoulder formation.Neckline Level: Around 107,437 – currently acting as a crucial support zone.Trendline: Price has broken below a short-term rising trendline, confirming pattern completion.Volume Analysis: Volume increased during the formation of the head, hinting at a potential shift in sentiment.Note: A confirmed close below 107,400 may attract further downside movement. Conversely, holding above this level could lead to consolidation or recovery.This analysis is intended for educational purposes—please evaluate risk and confirm with your own strategy before taking any trade decisions.let's trade active nowhold for 5 hours
Disclaimer
Any content and materials included in Sahmeto's website and official communication channels are a compilation of personal opinions and analyses and are not binding. They do not constitute any recommendation for buying, selling, entering or exiting the stock market and cryptocurrency market. Also, all news and analyses included in the website and channels are merely republished information from official and unofficial domestic and foreign sources, and it is obvious that users of the said content are responsible for following up and ensuring the authenticity and accuracy of the materials. Therefore, while disclaiming responsibility, it is declared that the responsibility for any decision-making, action, and potential profit and loss in the capital market and cryptocurrency market lies with the trader.