
Ttrade-With-Logic
@t_Ttrade-With-Logic

What symbols does the trader recommend buying?
Purchase History
پیام های تریدر
Filter
Tesla (TSLA) -Bullish Reaccumulation Setup | Smart Money concept
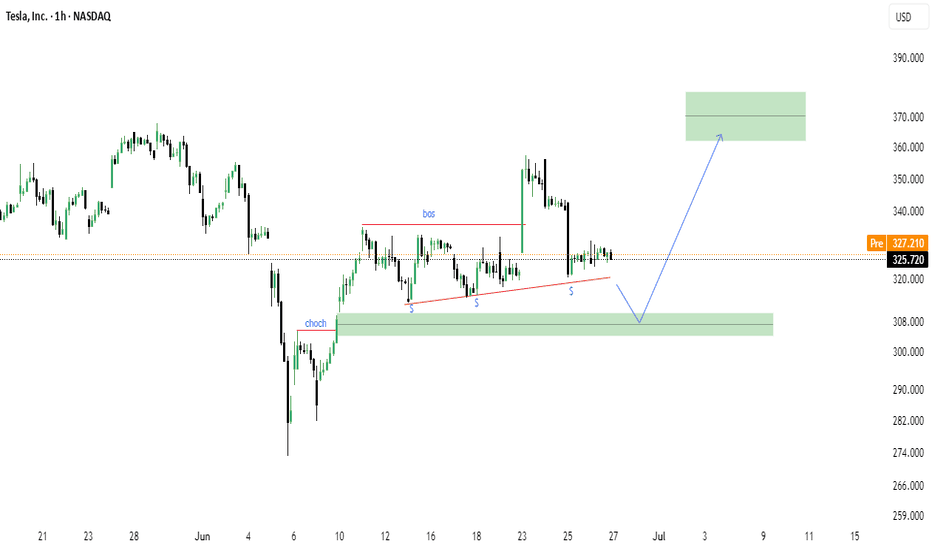
Tesla shows a clean CHoCH followed by BOS structure, indicating a potential bullish continuation. The market is forming equal lows into a demand zone (green box), suggesting a possible liquidity sweep before a move higher. Key Technical Points: CHoCH (Change of Character) confirmed on strong bullish impulse. BOS (Break of Structure) signals market intent to continue upward. Ascending triangle structure with multiple support tests (marked "S"). Anticipated sweep into demand zone: $308–$312 area. Potential upside target: $365–$375 supply zone. Bias: Bullish on confirmation of demand reaction. Disclaimer: This is not financial advice. Always do your own analysis before investing.
BTC/USD Rising Wedge Breakdown Ahead?
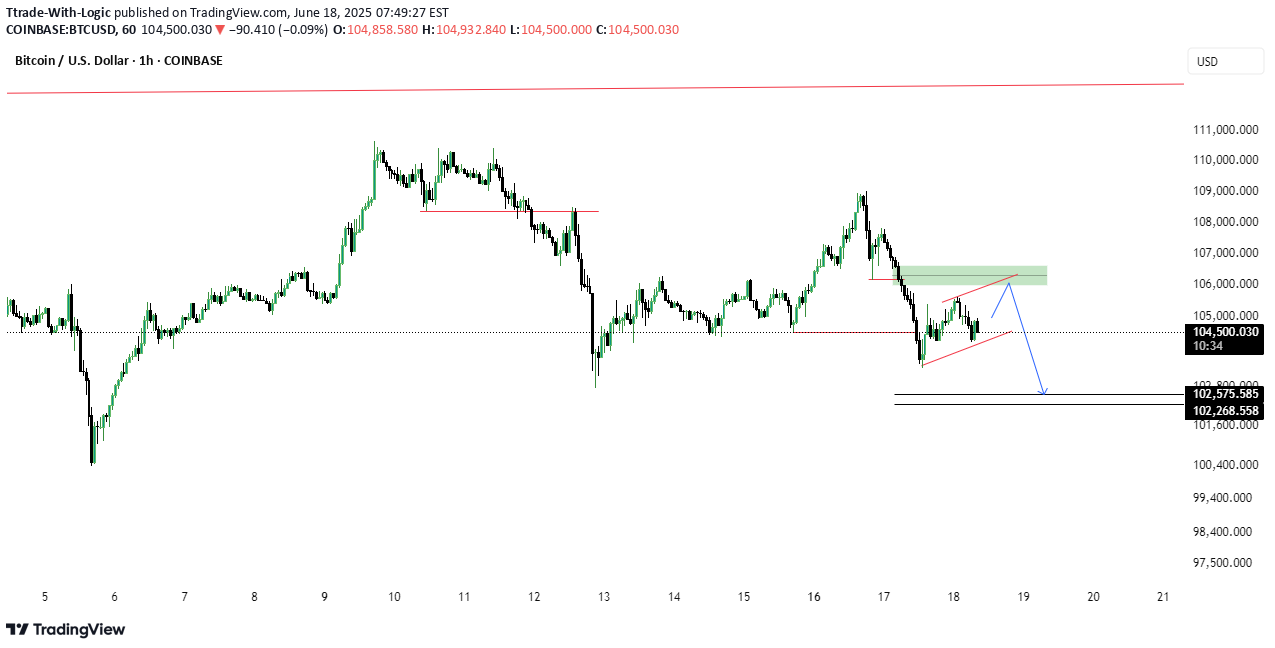
Bitcoin shows signs of a potential bearish reversal as price forms a rising wedge beneath a key supply zone. After a recent drop, price is retesting the 106k area (green zone), possibly setting up for continuation to the downside. 🔹 Rising wedge pattern near resistance 🔹 Bearish retest at previous support turned resistance 🔹 Potential drop targets: 102,575 and 102,268 🔹 Break below wedge support could accelerate the fall
NVIDIA (NVDA) – Ending Diagonal at the Top? 126 Next?
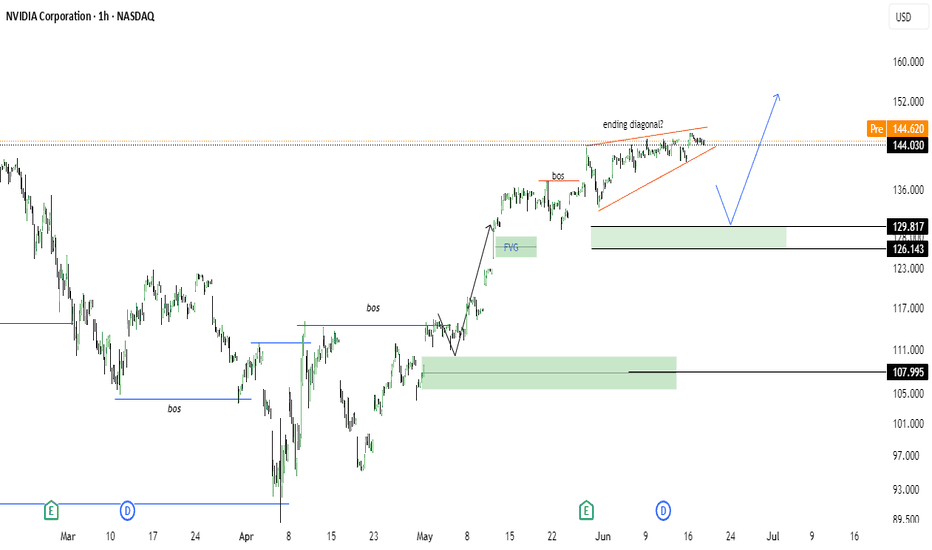
NVDA is currently trading inside a potential ending diagonal, often signaling a reversal or strong correction. With multiple Breaks of Structure (BoS) and a visible Fair Value Gap (FVG) left behind, this setup is aligning with Smart Money Concepts. 📉 Bearish Rejection Expected? Price might sweep liquidity and revisit the 126–129 demand zone, where strong unmitigated orders sit. If this zone holds, a bullish continuation toward 152+ is likely. 🔍 Key Highlights: ⚠️ Ending Diagonal pattern near local top 📊 Multiple BoS confirming internal structure shifts 📉 Unfilled Fair Value Gap (FVG) near 129 🟩 Strong demand zones at 129–126 and 108 🔄 Potential liquidity sweep before reversal 🧠 Smart money footprint visible 📅 Watch for price reaction around 129.8–126.1. 📈 Breakout above 145 with strength may invalidate the drop.
Tesla (TSLA) 1H Chart – Wyckoff Cycle in Action
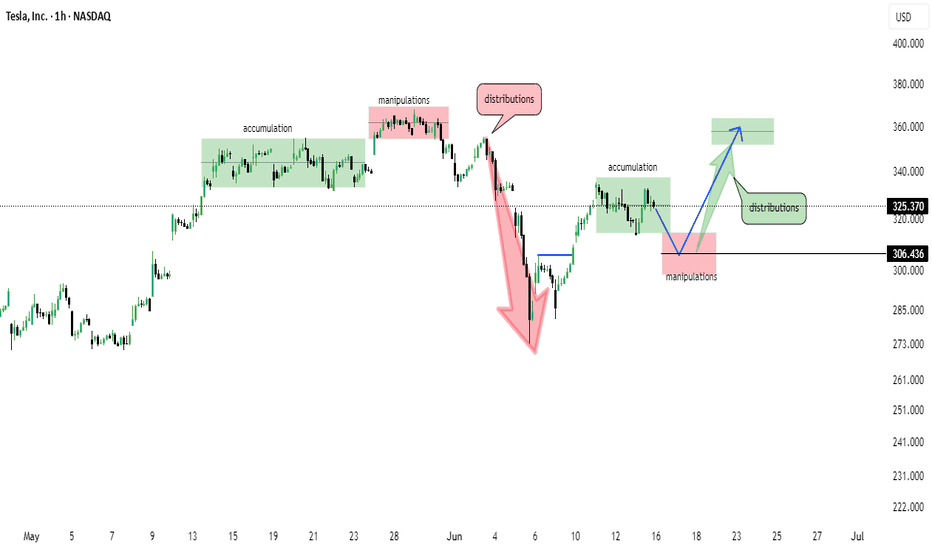
This chart reflects a textbook Wyckoff pattern unfolding on TSLA’s 1-hour timeframe: 🔹 Accumulation Phase observed early May 🔹 Followed by Manipulation & Distribution – classic trap before markdown 🔹 Sharp selloff led to another Accumulation zone around $305 🔹 Further manipulation wicks indicate smart money involvement 🔹 Now projecting a move towards $360–$370 distribution zone 📌 Structure breakdown: Smart Money Accumulation ➡️ Manipulation ➡️ Distribution Bullish momentum building from $306 support Eyes on reaction near the marked green distribution box 📦 📅 As of June 15, 2025 – chart aligns with Wyckoff theory and institutional behavior.
Gold (XAU/USD) 1H – Bullish Falling Wedge

🧠 **Technical Summary:** * **Pattern:** Falling wedge (bullish) * **Support Zone:** \$3,287 area (highlighted in green) * **Resistance Zones:** Two supply zones around \$3,340–\$3,360 and \$3,370–\$3,380 (marked in red) * **Current Price:** \~\$3,310 * **Projection:** Bounce from the lower wedge trendline or green support → consolidation → breakout to the upside --- ### 🔍 **Price Action Outlook:** * 📉 **Short-Term Bias:** Bearish until price tests the wedge bottom or hits demand near \$3,287 * 📈 **Medium-Term Bias:** Bullish if: * Price forms a double bottom or bullish structure near \$3,287 * Breaks out of wedge top with momentum * 🔄 **Invalidation:** Clean break below \$3,287 with no strong rejection would void the bullish wedge idea --- ### 📌 Trading Plan (based on chart): * **Watch for bullish reaction near \$3,287–\$3,300** * **Confirmation Entry:** After breakout and retest of wedge + break of supply (\~\$3,360) * **Targets:** \$3,400+ range * **Stop-loss:** Below \$3,280 swing low (conservative)
ETH at a Critical Decision Level – $2260

Ethereum is currently showing strong price action around the key decision level of $2260. This zone will likely determine the next major move: A breakout above could trigger a bullish continuation. A rejection here may send ETH down, possibly all the way toward $1000 in the long term. 📌 Stay tuned — we'll update you as the move unfolds. Keep in touch!
Bitcoin Wyckoff Distribution Complete – Markdown Phase Ahead?

This chart is a technical analysis of **Bitcoin (BTC/USD)** on the **4-hour timeframe** from Binance, illustrating **Wyckoff Market Cycle Phases** applied to recent price action. ### 🧠 Chart Description: The chart identifies and labels key **Wyckoff phases**: * **Accumulation (April)**: Price consolidates in a range after a downtrend. This phase marks strong hands accumulating Bitcoin from weak hands. * **Reaccumulation (late April to early May)**: A bullish continuation pattern where the price pauses temporarily before resuming the uptrend. * **Distribution (mid-May)**: The price enters another consolidation phase, but this time smart money begins offloading holdings at elevated prices to retail traders. ### 📉 Projected Move: * A breakdown below the current support is anticipated, leading to a **markdown phase**. * The red path suggests a significant decline, potentially toward the **\$85,000–\$90,000 range**, indicating bearish momentum. * After the markdown, **accumulation is expected to resume**, setting the stage for the next potential markup. ### 📊 Supporting Visual: On the right side, there's a reference schematic titled **“Market Phases” by Readtheticker.com**, which summarizes: * Accumulation → Markup → Distribution → Markdown → Accumulation cycle. * It also highlights buying/selling pressure dynamics and behavioral patterns at each phase. ---
XAUUSD Elliott Wave . Wave (5) Targeting $3,700 After Pullback!

The chart you’ve shared is a **2-hour Gold Spot (XAUUSD) analysis** using **Elliott Wave Theory**. Here's a clear breakdown of what’s happening: --- ### 🧠 **Technical Summary:** * **Larger Structure:** The chart shows a 5-wave Elliott Wave sequence. Waves (1) to (4) have already completed. * **Current Situation:** The market is likely in a subwave structure of wave (5), with a small 5-wave formation labeled in **red** within the final wave (5). * **Trend Channel:** The price broke out of the descending channel formed between waves (3) and (4), signaling a bullish breakout. * **Pullback Zone:** A minor correction is expected before the final push upward, targeting the **\$3,650–\$3,700** area. --- ### 🔍 **Key Observations:** * 📉 **Corrective Wave Complete:** The drop from (3) to (4) formed a falling wedge/channel — typical in wave 4 corrections. * 📈 **Impulse Wave Starting:** A new 5-wave upward impulse appears to be forming within wave (5). * 🧱 **Demand Zone Highlighted:** A retracement into the support zone (\~\$3,250–\$3,270) is anticipated before a rally. * 🎯 **Target Zone:** The final wave (5) is projected to hit between **\$3,650–\$3,700**, marked by the green target box. --- ### 📌 **Outlook:** * ✅ **Bullish Bias:** Long-term wave structure favors more upside. * ⚠️ **Short-term Dip Possible:** A drop toward the demand zone is expected before further rally. * 🕰️ **Timing:** Expect the final wave (5) to complete by early June, based on current structure. --- ### ⚠️ **Disclaimer:** This analysis is for educational purposes only. Always manage risk properly and consult your own analysis or financial advisor before trading. Let me know if you'd like a trading plan or want this chart translated into a Pine Script/EA.happening as we predicted
BTC BITCOIN Next move?

Here's a polished version of your update: --- **Hi everyone, back with a BTC update.** As you can see, the market is completing a **3-phase sequence**: **Accumulation → Reaccumulation → Distribution.** If today’s **daily candle closes bearish**, we could see a **move back down toward the \$70,000 area**, where **unfilled orders** are still waiting. Stay sharp and manage your risk.
Meta Platforms (META) 4H Outlook – May 2025
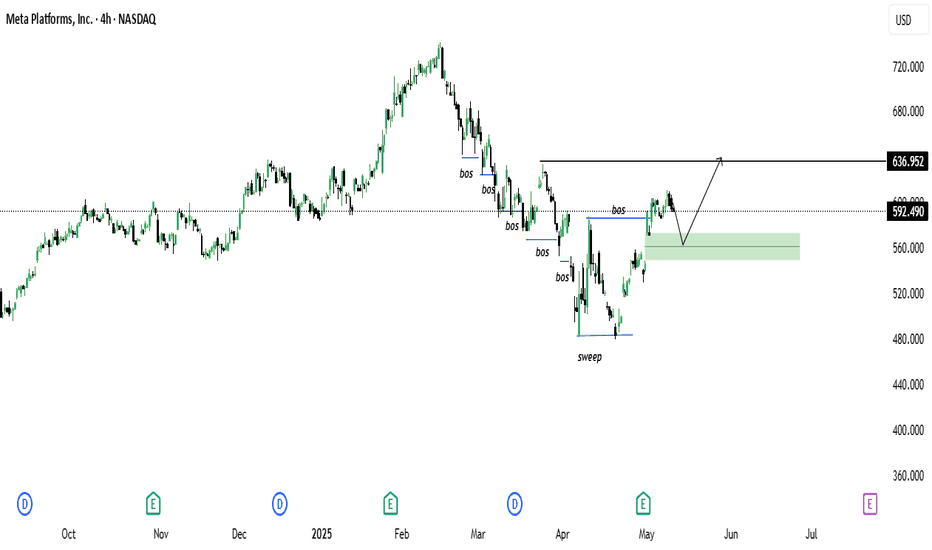
Following a liquidity sweep and several confirmed Breaks of Structure (BoS), META has shown a bullish market shift. Price is currently hovering near $592.49 after a strong rally. There is a clearly defined demand zone around the $555–$570 area (highlighted in green). If price retraces to this zone and holds, it could act as a launchpad for a continuation move toward the $636.95 target, aligned with a previous structural high and potential supply. The setup reflects strong smart money behavior—monitor price reaction at the demand zone for bullish confirmation before engaging.
Disclaimer
Any content and materials included in Sahmeto's website and official communication channels are a compilation of personal opinions and analyses and are not binding. They do not constitute any recommendation for buying, selling, entering or exiting the stock market and cryptocurrency market. Also, all news and analyses included in the website and channels are merely republished information from official and unofficial domestic and foreign sources, and it is obvious that users of the said content are responsible for following up and ensuring the authenticity and accuracy of the materials. Therefore, while disclaiming responsibility, it is declared that the responsibility for any decision-making, action, and potential profit and loss in the capital market and cryptocurrency market lies with the trader.