
Trendoscope
@t_Trendoscope

What symbols does the trader recommend buying?
Purchase History
پیام های تریدر
Filter
Trendoscope
HOW-TO: Auto Harmonic Screener - UltimateX
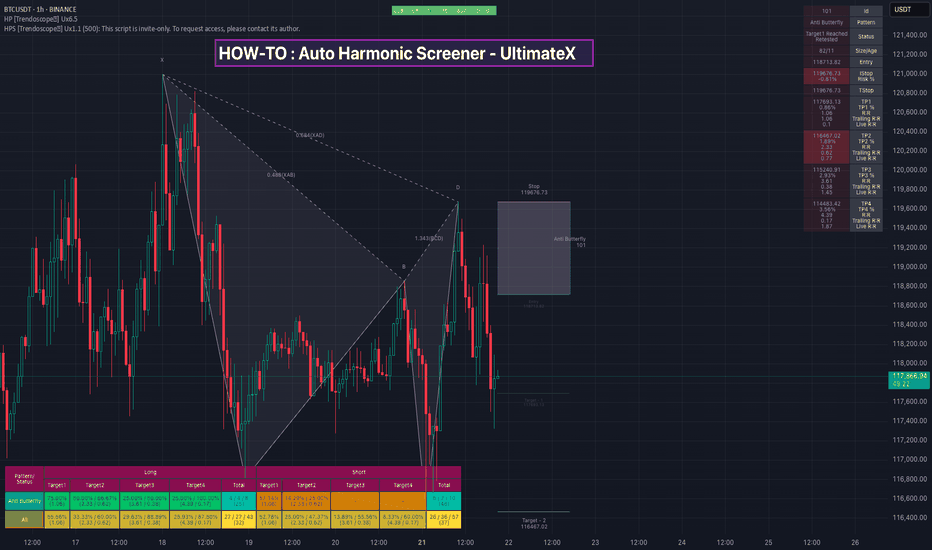
Hello Everyone, In this video, we have discussed on how to use our new Auto Harmonic Screener - UltimateX. We have covered the following topics. Difference between Auto Harmonic Screener - UltimateX (Current script) and Auto Harmonic Pattern - UltimateX and how to use both the scripts together Difference between Auto Harmonic Screener - UltimateX (Current script) and the existing screener Auto Harmonic Pattern - Screener which is built on request.security calls. We have discussed how the limitations of old script and how using the new script with Pine screener utility will help overcome those problems. We have gone through the indicator settings (which are almost similar to that of Auto Harmonic Pattern UltimateX Short demo on how to use the script with Pine Screener Also check our existing video on How to use the new Pine Screener Utility.
Trendoscope
Pine Screener - Powerful tool for building programmable screener
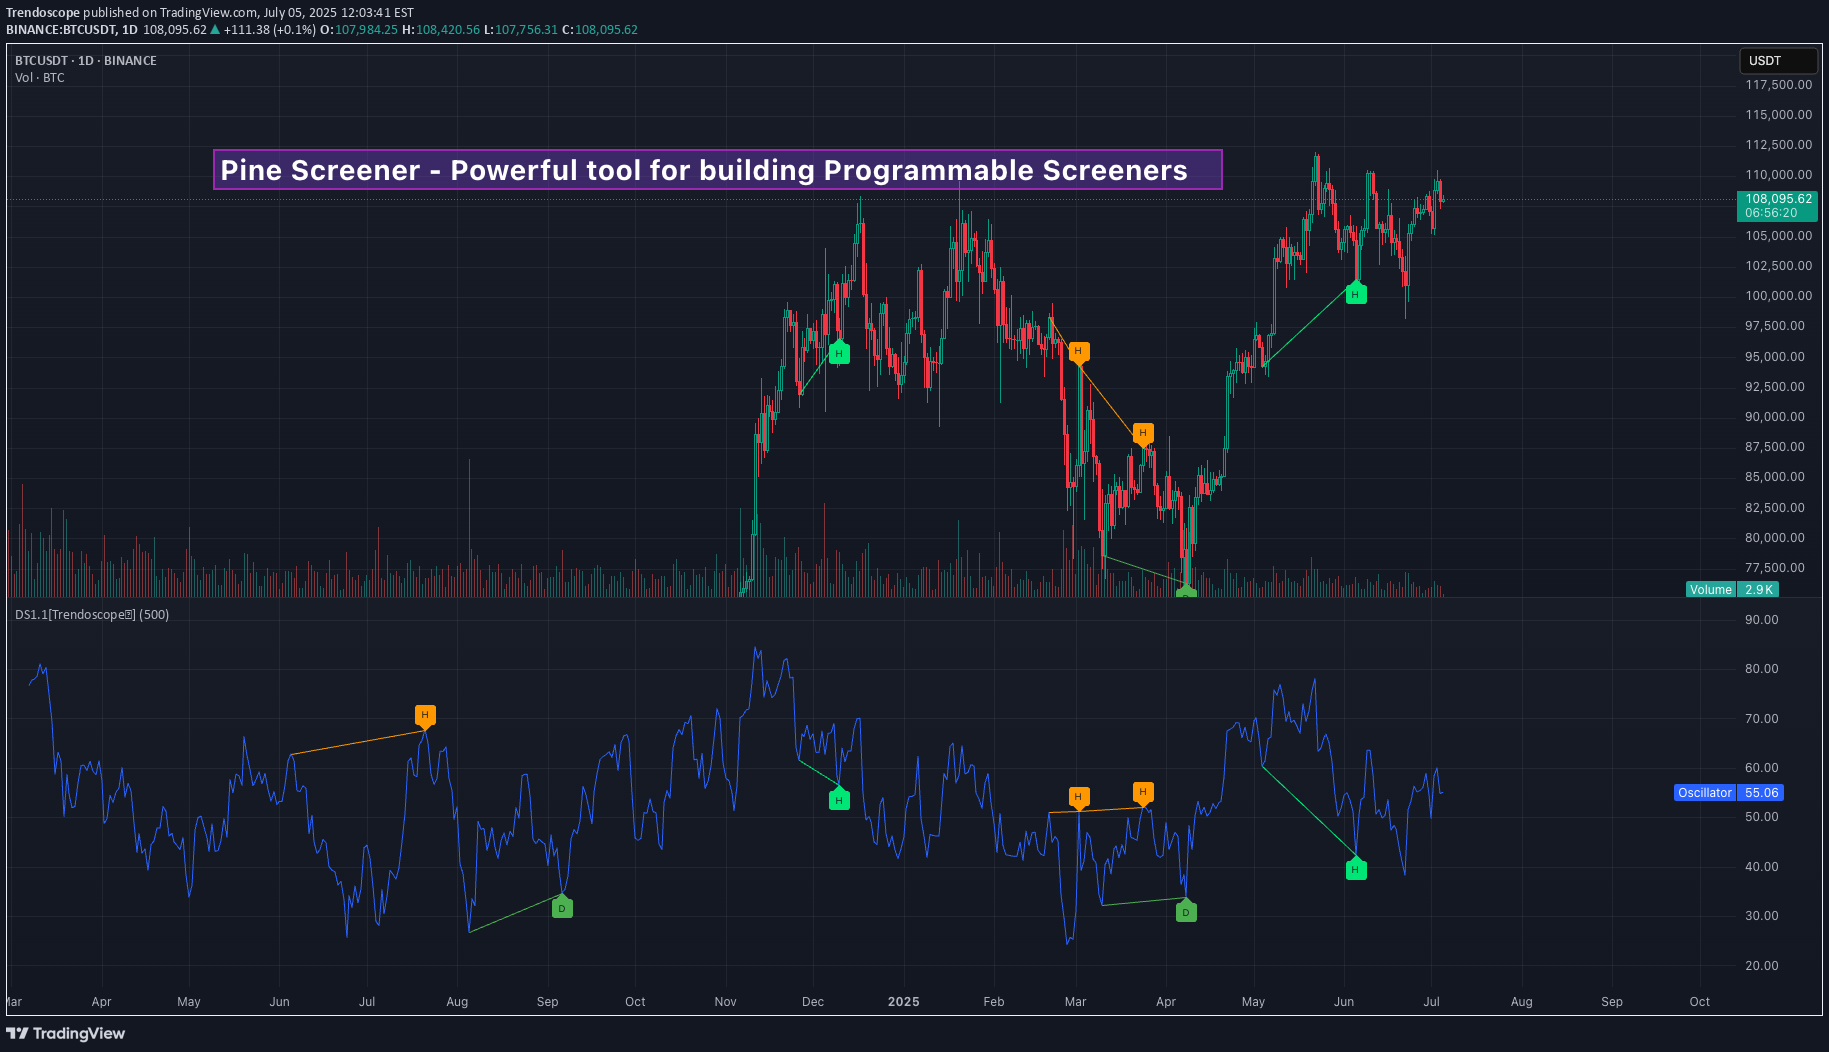
Hello Everyone, In this video, we have discussed on how to use pine screener utility of tradingview. We are making use of the indicator Divergence Screener for this demonstration and screen stocks undergoing bullish divergence. In a nutshell, here are the steps: 🎯 Use Stock Screener to build watchlist of less than 1000 symbols 🎯 Add the indicator you want to use in the pine screener to your favorites. 🎯 Pine screener can be accessed from the tradingview screener menu or you can simply click on the link tradingview.com/pine-screener/ 🎯 Add the watchlist and indicator to the pine screener and adjust the timeframe and indicator settings 🎯 Select the criteria to be scanned and press scan
Trendoscope
Position Sizing Strategies
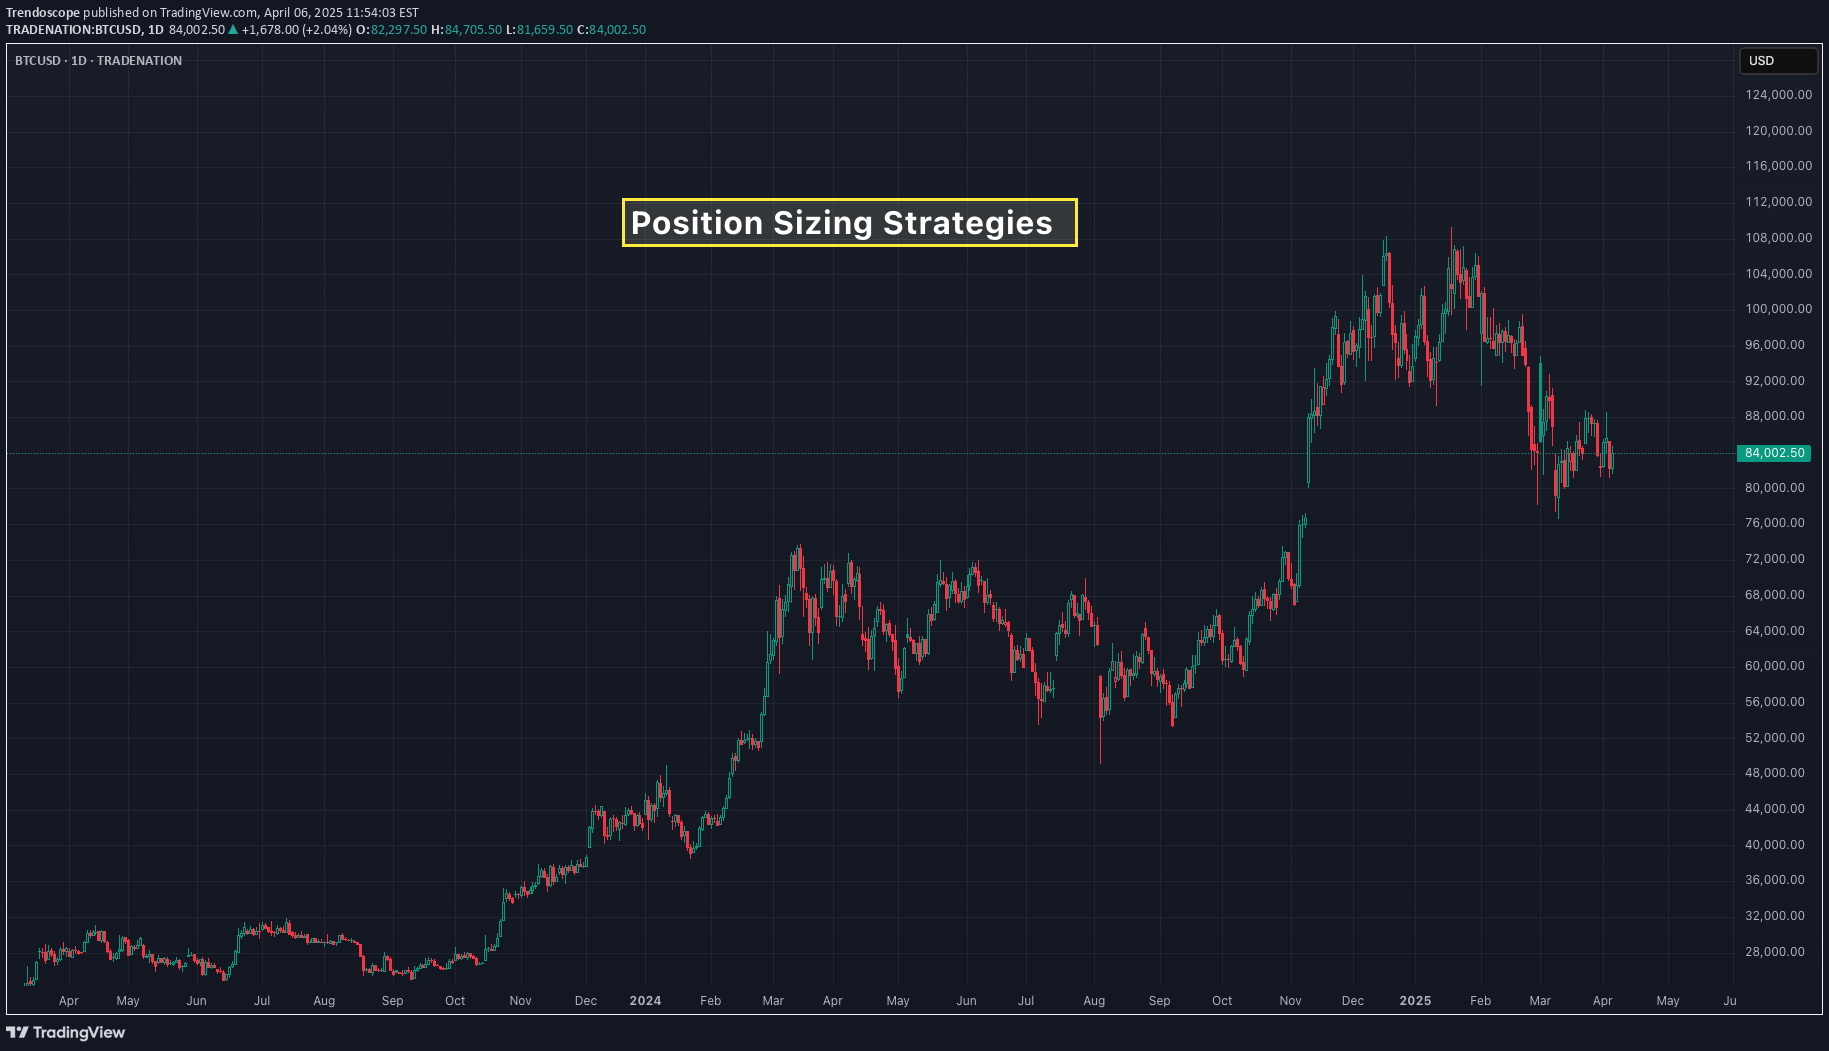
Position sizing is one of the most important aspects in risk management for traders. Proper position sizing helps manage the risk effectively by maximizing profits and limiting the losses. In this publication, we will explore popular position sizing strategies and how to implement them in pinescript strategies 🎲 Importance of Position Sizing in Trading Let's take an example to demonstrate the importance of position sizing. You have a very good strategy that gives you win on 70% of the times with risk reward of 1:1. If you start trading with this strategy with all your funds tied into a single trade, you have the risk of losing most of your fund in the first few trades and even with 70% win rate at later point of time, you may not be able to recoup the losses. In such scenarios, intelligent position sizing based on the events will help minimize the loss. In this tutorial, let us discuss some of those methods along with appropriate scenarios where that can be used. 🎲 Position Sizing Strategies Available in Tradingview Strategy Implementation 🎯 Fixed dollar amount position sizing In this method, trader allocate a fixed value of X per trade. Though this method is simple, there are few drawbacks Does not account for varying equity based on the trade outcomes Does not account for varying risk based on the volatility of the instrument 🎯 Fixed Percentage of Equity In this method, percent of equity is used as position size for every trade. This method is also simple and slightly better than the Fixed dollar amount position sizing. However, there is still a risk of not accounting for volatility of the instrument for position sizing. In tradingview strategies, you can find the position sizing settings in the properties section. In both cases, Pinescript code for the entry does not need to specify quantity explicitly, as they will be taken care by the framework. Pine Script® if(longEntry) strategy.entry('long', strategy.long) if(shortEntry) strategy.entry('short', strategy.short) 🎲 Advanced Position Sizing Strategies There are not directly supported in Tradingview/Pinescript - however, they can be programmed. 🎯 Fixed Fractional Method The Fixed Fractional Method is similar to the fixed percentage of equity method/fixed dollar amount positioning method, but it takes into account the amount of risk on each trade and calculate the position size on that basis. This method calculates position size based on the trader’s risk tolerance, factoring in stop-loss levels and account equity. Due to this, the trader can use any instrument and any timeframe with any volatility with fixed risk position. This means, the quantity of overall trade may vary, but the risk will remain constant. Example. Let's say you have 1000 USD with you and you want to trade BTCUSD with entry price of 100000 and stop price of 80000 and target of 120000. You want to risk only 5% of your capital for this trade. Calculation will be done as follows. Risk per trade = 5% of 1000 = 50 USD Risk per quantity = (entry price - stop price) = 20000 So, the quantity to be used for this trade is calculated by RiskQty = Risk Amount / Risk Per Quantity = 50 / 20000 = 0.0025 BTC To implement the similar logic in Pinescript strategy by using the strategy order quantity as risk, we can use the following code Pine Script® riskAmount = strategy.default_entry_qty(entryPrice)*entryPrice riskPerQty = math.abs(entryPrice-stopPrice) riskQty = riskAmount/riskPerQty With this, entry and exit conditions can be updated to as follows Pine Script® if(longEntry) strategy.entry('long', strategy.long, riskQty, stop=entryPrice) strategy.exit('ExitLong', 'long', stop=stopPrice, limit=targetPrice) if(shortEntry) strategy.entry('short', strategy.short, riskQty, stop=entryPrice) strategy.exit('ExitShort', 'short', stop=stopPrice, limit=targetPrice) Expand 1 line 🎯 Kelly Criterion Method The Kelly Criterion is a mathematical formula used to determine the optimal position size that maximizes the long-term growth of capital, considering both the probability of winning and the payoff ratio (risk-reward). It’s a more sophisticated method that balances risk and reward in an optimal way. Kelly Criterion method needs a consistent data on the expected win ratio. As and when the win ratio changes, the position sizing will adjust automatically. Formula is as follows f = W - L/R f: Fraction of your capital to bet. W : Win Ratio L : Loss Ratio (1-W) R : Risk Reward for the trade Let's say, you have a strategy that provides 60% win ratio with risk reward of 1.5, then the calculation of position size in terms of percent will be as follows f = 0.6 - 0.4/1.5 = 0.33 Pinescript equivalent of this calculation will be Pine Script® riskReward = 2 factor = 0.1 winPercent = strategy.wintrades/(strategy.wintrades+strategy.losstrades) kkPercent = winPercent - (1-winPercent)/riskReward tradeAmount = strategy.equity * kkPercent * factor tradeQty = tradeAmount/entryPrice Expand 1 line 🎲 High Risk Position Sizing Strategies These strategies are considered very high risk and high reward. These are also the strategies that need higher win ratio in order to work effectively. 🎯Martingale Strategy The Martingale method is a progressive betting strategy where the position size is doubled after every loss. The goal is to recover all previous losses with a single win. The basic idea is that after a loss, you double the size of the next trade to make back the lost money (and make a profit equal to the original bet size). How it Works: If you lose a trade, you increase your position size on the next trade. You keep doubling the position size until you win. Once you win, you return to the original position size and start the process again. To implement martingale in Pine strategy, we would need to calculate the last consecutive losses before placing the trade. It can be done via following code. Pine Script® var consecutiveLosses = 0 if(ta.change(strategy.closedtrades) > 0) lastProfit = strategy.closedtrades.profit(strategy.closedtrades-1) consecutiveLosses := lastProfit > 0? 0 : consecutiveLosses + 1 Quantity can be calculated using the number of consecutive losses Pine Script® qtyMultiplier = math.pow(2, consecutiveLosses) baseQty = 1 tradeQty = baseQty * qtyMultiplier 🎯Paroli System (also known as the Reverse Martingale) The Paroli System is similar to the Anti-Martingale strategy but with more defined limits on how much you increase your position after each win. It's a progressive betting system where you increase your position after a win, but once you've won a set number of times, you reset to the original bet size. How it Works: Start with an initial bet. After each win, increase your bet by a predetermined amount (often doubling it). After a set number of wins (e.g., 3 wins in a row), reset to the original position size. To implement inverse martingale or Paroli system through pinescript, we need to first calculate consecutive wins. Pine Script® var consecutiveWins = 0 var maxLimit = 3 if(ta.change(strategy.closedtrades) > 0) lastProfit = strategy.closedtrades.profit(strategy.closedtrades-1) consecutiveWins := lastProfit > 0? consecutiveWins + 1 : 0 if(consecutiveWins >= maxLimit) consecutiveWins := 0 Expand 2 lines The quantity is then calculated using a similar formula as that of Martingale, but using consecutiveWins Pine Script® qtyMultiplier = math.pow(2, consecutiveWins) baseQty = 1 tradeQty = baseQty * qtyMultiplier 🎯D'Alembert Strategy The D'Alembert strategy is a more conservative progression method than Martingale. You increase your bet by one unit after a loss and decrease it by one unit after a win. This is a slow, incremental approach compared to the rapid growth of the Martingale system. How it Works: Start with a base bet (e.g., $1). After each loss, increase your bet by 1 unit. After each win, decrease your bet by 1 unit (but never go below the base bet). In order to find the position size on pinescript strategy, we can use following code Pine Script® // Initial position initialposition = 1.0 var position = initialposition // Step to increase or decrease position step = 2 if(ta.change(strategy.closedtrades) > 0) lastProfit = strategy.closedtrades.profit(strategy.closedtrades-1) position := lastProfit > 0 ? math.max(initialposition, position-step) : position+step Expand 3 lines Conclusion Position sizing is a crucial part of trading strategy that directly impacts your ability to manage risk and achieve long-term profitability. By selecting the appropriate position sizing method, traders can ensure they are taking on an acceptable level of risk while maximizing their potential rewards. The key to success lies in understanding each strategy, testing it, and applying it consistently to align with your risk tolerance and trading objectives.
Trendoscope
Trading Converging Chart Patterns
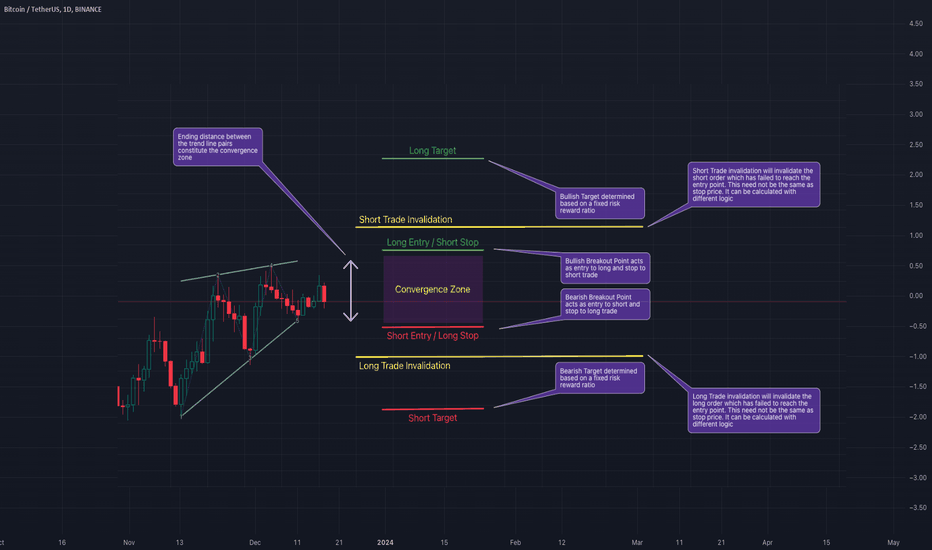
We discussed identification and classification of different chart patterns and chart pattern extensions in our previous posts. Algorithmic Identification of Chart Patterns Flag and Pennant Chart Patterns In this installment, we shift our focus towards the practical trading strategies applicable to a select group of these patterns. Acknowledging that a universal trading rule cannot apply to all patterns, we narrow our examination to those of the converging variety. We will specifically address the following converging patterns: Rising Wedge (Converging Type) Falling Wedge (Converging Type) Converging Triangle Rising Triangle (Converging Type) Falling Triangle (Converging Type) This selection will guide our discussion on how to approach these patterns from a trading perspective. 🎲 Historical Bias and General Perception Each pattern we've discussed carries a historical sentiment that is widely regarded as a guideline for trading. Before we delve into our specific trading strategies, it's crucial to understand these historical sentiments and the general market interpretations associated with them. 🟡 The Dynamics of Contracting Wedge Patterns Contracting Wedge patterns are typically indicative of the Elliott Wave Structure's diagonal waves, potentially marking either the beginning or conclusion of these waves. A contracting wedge within a leading diagonal may experience a brief retracement before the trend resumes. Conversely, if found in an ending diagonal, it could signal the termination of wave 5 or C, possibly hinting at a significant trend reversal. The prevailing view suggests that these patterns usually precede a short-term directional shift: Rising Wedges are seen as bearish signals, while Falling Wedges are interpreted as bullish. It's essential to consider the trend prior to the formation of these patterns, as it significantly aids in determining their context within the Elliott Wave cycles, specifically identifying them as part of waves 1, A, 5, or C. For an in-depth exploration, refer to our detailed analysis in Decoding Wedge Patterns 🎯 Rising Wedge (Converging Type) The Rising Wedge pattern, historically viewed with a bearish bias, suggests that a downward trend is more likely upon a breakout below its lower trend line. This perception positions the pattern as a signal for traders to consider bearish positions once the price breaks through this critical support. 🎯 Falling Wedge (Converging Type) The Falling Wedge pattern is traditionally seen through a bullish lens, indicating potential upward momentum when the price surpasses its upper trend line. This established viewpoint suggests initiating long positions as a strategic response to such a breakout, aligning with the pattern's optimistic forecast. 🟡 Contracting Triangle Patterns Contracting Triangles, encompassing Converging, Ascending, and Descending Triangles, are particularly noteworthy when they appear as part of the Elliott Wave's B or 2 waves. These patterns typically signal a continuation of the pre-existing trend that preceded the triangle's formation. This principle also underpins the Pennant Pattern, which emerges following an impulse wave, indicating a pause before the trend's resumption. 🎲 Alternate Way of Looking into Converging Patterns Main issue with historical perception are: There is no clear back testing data to prove whether the general perception is correct or more profitable. Elliott Waves concepts are very much subjective and can be often difficult for beginners and misleading even for experts. So, the alternative way is to treat all the converging patterns equally and devise a method to trade using a universal way. This allows us to back test our thesis and be definitive about the profitability of these patterns. Here are our simple steps to devise and test a converging pattern based strategy. Consider all converging patterns as bidirectional. Meaning, they can be traded on either side. Thus chose to trade based on the breakout. If the price beaks up, then trade long and if the price breaks down, then trade short. For each direction, define criteria for entry, stop, target prices and also an invalidation price at which the trade is ignored even without entry. Backtest and Forward test the strategy and collect data with respect to win ratio, risk reward and profit factor to understand the profitability of patterns and the methodology. Now, let's break it further down. 🟡 Defining The Pattern Trade Conditions Measure the ending distance between the trend line pairs and set breakout points above and beyond the convergence zone. 🎯 Entry Points - These can be formed on either side of the convergence zone. Adding a small buffer on top of the convergence zone is ideal for setting the entry points of converging patterns. Formula for Entry can be: Pine Script® Long Entry Price = Top + (Top - Bottom) X Entry Ratio Short Entry Price = Bottom - (Top-Bottom) X Entry Ratio Whereas Top refers to the upper side of the convergence zone and bottom refers to the lower side of the convergence zone. Entry Ratio is the buffer ratio to apply on top of the convergence zone to get entry points. 🎯 Stop Price - Long entry can act as stop for short orders and the short entry can act as stop price for long orders. However, this is not mandatory and different logic for stops can be applied for both sides. Formula for Stop Can be Pine Script® Long Stop Price = Bottom - (Top - Bottom) X Stop Ratio Short Stop Price = Top + (Top - Bottom) X Stop Ratio 🎯 Target Price - It is always good to set targets based on desired risk reward ratio. That means, the target should always depend on the distance between entry and stop price. The general formula for Target can be: Pine Script® Target Price = Entry + (Entry-Stop) X Risk Reward 🎯 Invalidation Price - Invalidation price is a level where the trade direction for a particular pattern needs to be ignored or invalidated. This price need to be beyond stop price. In general, trade is closed when a pattern hits invalidation price. Formula for Invalidation price is the same as that of Stop Price, but Invalidation Ratio is more than that of Stop Ratio Pine Script® Long Invalidation Price = Bottom - (Top - Bottom) X Invalidation Ratio Short Invalidation Price = Top + (Top - Bottom) X Invalidation Ratio 🟡 Back Test and Forward Test and Measure the Profit Factor It is important to perform sufficient testing to understand the profitability of the strategy before using them on the live trades. Use multiple timeframes and symbols to perform a series of back tests and forward tests, and collect as much data as possible on the historical outcomes of the strategy. Profit Factor of the strategy can be calculated by using a simple formula Pine Script® Profit Factor = (Wins/Losses) X Risk Reward 🟡 Use Filters and Different Combinations Filters will help us in filtering out noise and trade only the selective patterns. The filters can include a simple logic such as trade long only if price is above 200 SMA and trade short only if price is below 200 SMA. Or it can be as complex as looking into the divergence signals or other complex variables.
Trendoscope
Flag and Pennant Chart Patterns
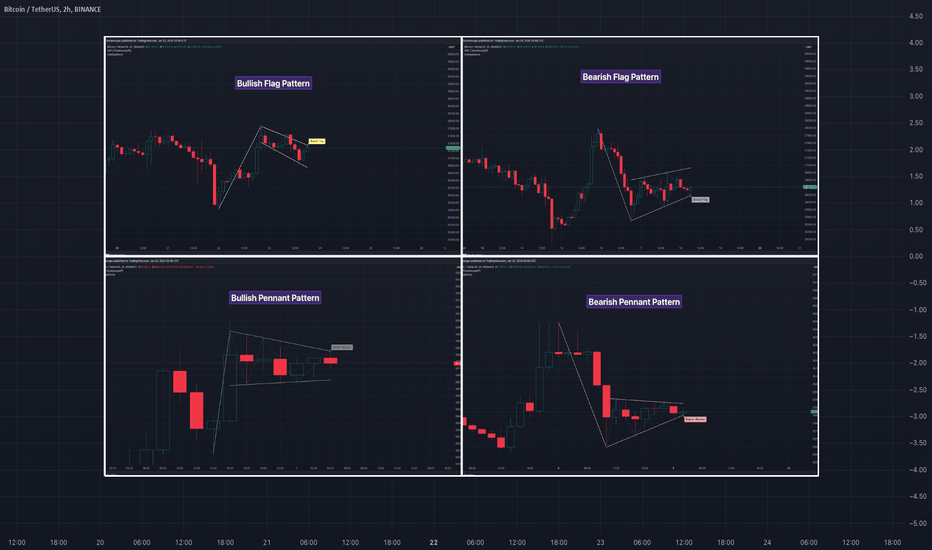
🎲 An extension to Chart Patterns based on Trend Line Pairs - Flags and Pennants After exploring Algorithmic Identification and Classification of Chart Patterns , we now delve into extensions of these patterns, focusing on Flag and Pennant Chart Patterns. These patterns evolve from basic trend line pair-based structures, often influenced by preceding market impulses. 🎲 Identification rules for the Extension Patterns 🎯 Identify the existence of Base Chart Patterns Before identifying the flag and pennant patterns, we first need to identify the existence of following base trend line pair based converging or parallel patterns. Ascending Channel Descending Channel Rising Wedge (Contracting) Falling Wedge (Contracting) Converging Triangle Descending Triangle (Contracting) Ascending Triangle (Contracting) 🎯 Identifying Extension Patterns. The key to pinpointing these patterns lies in spotting a strong impulsive wave – akin to a flagpole – preceding a base pattern. This setup suggests potential for an extension pattern: A Bullish Flag emerges from a positive impulse followed by a descending channel or a falling wedge A Bearish Flag appears after a negative impulse leading to an ascending channel or a rising wedge. A Bullish Pennant is indicated by a positive thrust preceding a converging triangle or ascending triangle. A Bearish Pennant follows a negative impulse and a converging or descending triangle. 🎲 Pattern Classifications and Characteristics 🎯 Bullish Flag Pattern Characteristics of Bullish Flag Pattern are as follows Starts with a positive impulse wave Immediately followed by either a short descending channel or a falling wedge Here is an example of Bullish Flag Pattern 🎯 Bearish Flag Pattern Characteristics of Bearish Flag Pattern are as follows Starts with a negative impulse wave Immediately followed by either a short ascending channel or a rising wedge Here is an example of Bearish Flag Pattern 🎯 Bullish Pennant Pattern Characteristics of Bullish Pennant Pattern are as follows Starts with a positive impulse wave Immediately followed by either a converging triangle or ascending triangle pattern. Here is an example of Bullish Pennant Pattern 🎯 Bearish Pennant Pattern Characteristics of Bearish Pennant Pattern are as follows Starts with a negative impulse wave Immediately followed by either a converging triangle or a descending converging triangle pattern. Here is an example of Bearish Pennant Pattern 🎲 Trading Extension Patterns In a strong market trend, it's common to see temporary periods of consolidation, forming patterns that either converge or range, often counter to the ongoing trend direction. Such pauses may lay the groundwork for the continuation of the trend post-breakout. The assumption that the trend will resume shapes the underlying bias of Flag and Pennant patterns It's important, however, not to base decisions solely on past trends. Conducting personal back testing is crucial to ascertain the most effective entry and exit strategies for these patterns. Remember, the behavior of these patterns can vary significantly with the volatility of the asset and the specific timeframe being analyzed. Approach the interpretation of these patterns with prudence, considering that market dynamics are subject to a wide array of influencing factors that might deviate from expected outcomes. For investors and traders, it's essential to engage in thorough back testing, establishing entry points, stop-loss orders, and target goals that align with your individual trading style and risk appetite. This step is key to assessing the viability of these patterns in line with your personal trading strategies and goals. It's fairly common to witness a breakout followed by a swift price reversal after these patterns have formed. Additionally, there's room for innovation in trading by going against the bias if the breakout occurs in the opposite direction, specially when the trend before the formation of the pattern is in against the pattern bias. 🎲 Cheat Sheet
Trendoscope
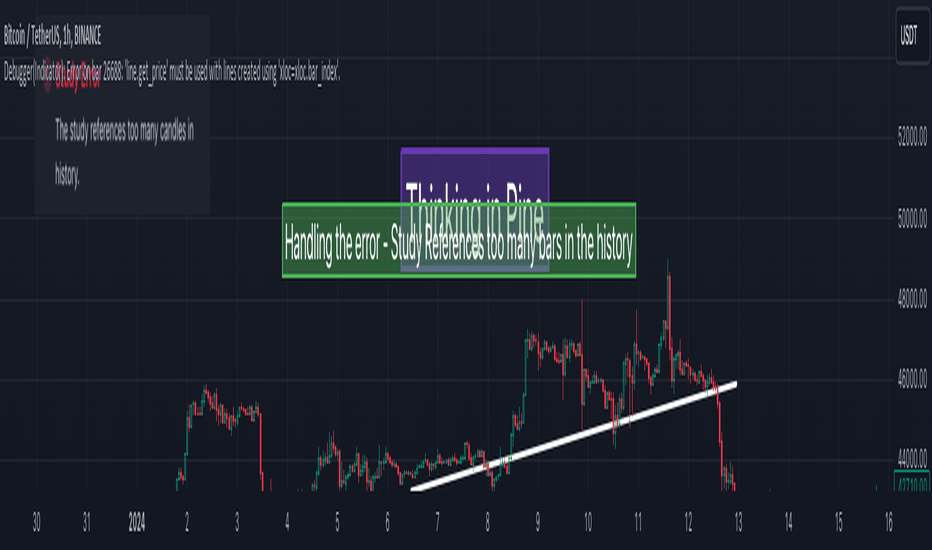
Thinking in Pine - Study References Too Many Bars In the History
Welcome to
"Thinking in Pine"
short video series on the topics of Pine Script.
Today's topic is handling the error -
"The study references too many candles in the history"
and other bar_index related issues.
If you are not familiar with Pine Script time series concepts, please go through our previous videos.
Thinking in Pine - Time Series
Thinking in Pine - Special Cases of Time Series
🎲 Points Discussed
When do we get the error "Study references too many candles in the history" and how to overcome this issue.
bar_index limitations with drawing objects on the chart.
🎯 Example Program - Historical Reference Alternative Implementation
Pine Script®
// When we are trying to refer to history more than or equal to 10000 bars older
// float value = close[10000]
// plot(value)
// Alternative implementation
var values = array.new
Trendoscope
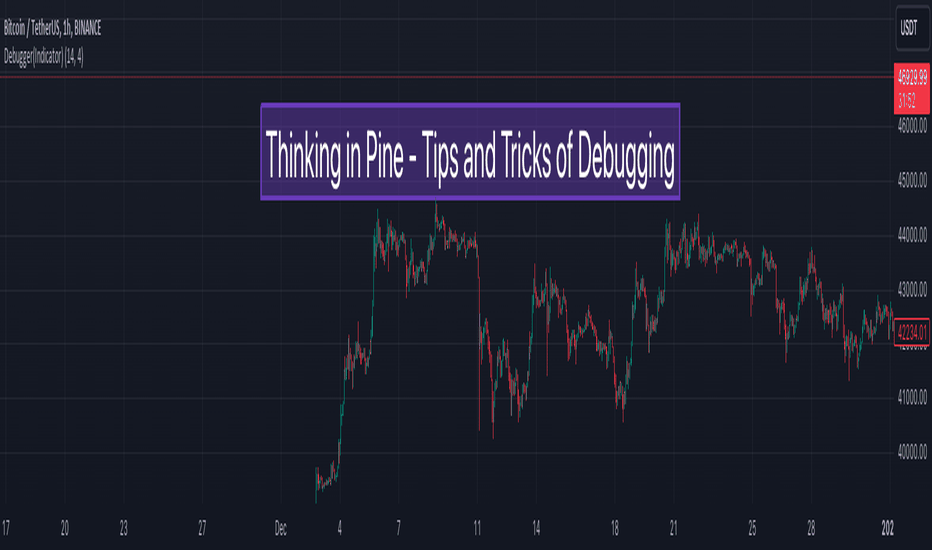
Thinking in Pine - Tricks and Tips of Debugging
Welcome to
"Thinking in Pine"
short video series on the topics of Pine Script.
Today's discussion point is debugging and tools that Pine script provide us to debug our programs.
🎲 Points Discussed
Debugging using `plot` for numerical series values.
Using Pine Logs to debug for cases where `plot` is not suitable
🎯 Example Program - Debugging using plot
Pine Script®
length = input.int(14, 'Length')
multiplier = input.float(4, 'Multiplier')
var dir = 1
var stopDistance = ta.atr(length) * multiplier
// Remove var to fix the first issue
// stopDistance = ta.atr(length) * multiplier
buyStopCurrent = close-stopDistance
sellStopCurrent = close + stopDistance
var buyStop = buyStopCurrent
var sellStop = sellStopCurrent
buyStop := dir > 0? math.max(buyStop, buyStopCurrent) : buyStopCurrent
sellStop := dir < 0? math.min(sellStop, sellStopCurrent) : sellStopCurrent
// Use nz to overcome na issues with math.max/ math.min
// buyStop := dir > 0? math.max(nz(buyStop, buyStopCurrent), buyStopCurrent) : buyStopCurrent
// sellStop := dir < 0? math.min(nz(sellStop, sellStopCurrent), sellStopCurrent) : sellStopCurrent
dir := dir == 1 and close < buyStop? -1 : dir == -1 and close > sellStop ? 1 : dir
// Plot statements used for debugging. display is set to display.data_window as the debugging plots do not need to appear on the charts
plot(stopDistance, 'Stop Distance', color.purple, display = display.data_window)
plot(buyStopCurrent, 'buyStopCurrent', color.red, display = display.data_window)
plot(sellStopCurrent, 'sellStopCurrent', color.green, display = display.data_window)
plot(buyStop, 'buyStop', color.red, display = display.data_window)
plot(sellStop, 'sellStop', color.green, display = display.data_window)
plot(dir, 'Direction', color.white, display = display.data_window)
plot(dir > 0? buyStop : sellStop, 'Supertrend', dir > 0? color.red : color.green)
Expand 26 lines
🎯 Example Program - Pine Logs
Pine Script®
sum = 0
arr = array.new
Trendoscope
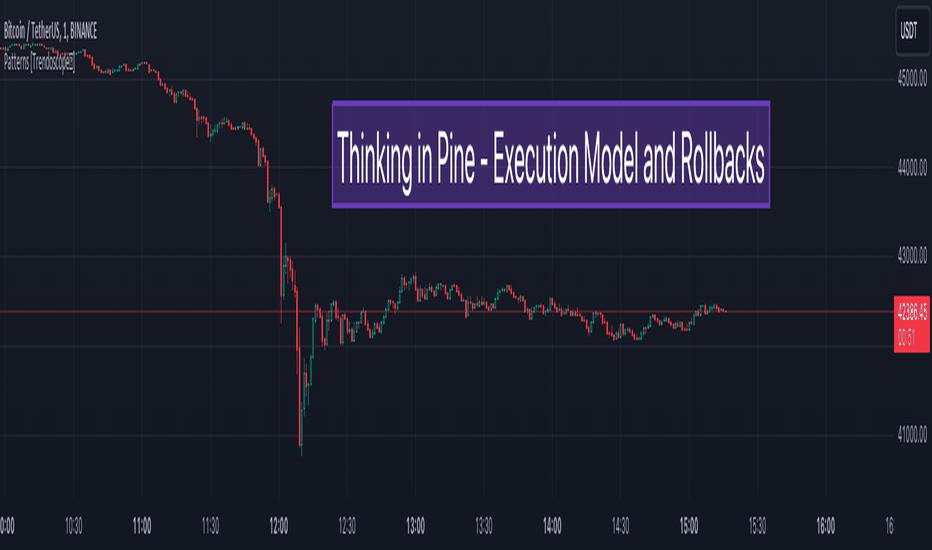
Thinking in Pine - Execution Model and Rollback on Realtime Bars
Hello All,
Welcome to another session of "Thinking in Pine" - short video tutorials on Pine Script.
Before continuing with this video, if you are not familiar with var, varip and regular variables, please watch our previous video -
"Thinking in Pine - var, varip and regular variables"
🎲 Today's discussion points
How var, varip and regular variable modification code works with historical and real time bar updates.
Rollback concept of var variables
🎯 Example Program Used
Pine Script®
// The statements execute on every tick
count = 0.0
count+=1
varip varipcount = 0 //executes only once on the first bar
varipcount+=1
// Reset counter on every bar
// if(barstate.isconfirmed)
// varipcount:=0
// Rollbacks and assigns on every tick
var varcount = 0.0 //executes only once on the first bar
varcount+=1
// varcount:=varcount[1] -- Rollback
// varcount := varcount + 1 -- execute again
plot(varipcount, 'Varip Count')
plot(varcount, 'Var Count')
plot(count, 'Çount')
arrRegular = array.new
Trendoscope
Thinking in Pine - Functions Containing Var Variables
Hello everyone, welcome back to "Thinking in Pine" short video tutorials. In this video, we have discussed special cases of using var variables inside function definitions. If you are not familiar with var variables, please take a step back and watch our earlier video - "Thinking in Pine - var, varip and regular variables" 🎲 Summary Using var within a function scope and how it behaves with multiple invocations. Using the functions containing var variable definitions within a loop. 🎯 Example Program Used Pine Script® increment()=> var i = 0 i+=1 var1 = increment() var2 = increment() var3 = increment() // The code above is equivalent to // var i1 = 0 // i1+=1 // var1 = i1 // var i2 = 0 // i2+=1 // var2 = i2 // var i3 = 0 // i3+=1 // var3 = i3 plot(var1, "Counter 1", color=color.blue) plot(var2, "Counter 2", color=color.red) plot(var3, "Counter 3", color=color.purple) arr = array.from(var1, var2, var3) for i=1 to 3 arr.push(increment()) // The code above is equivalent to // var i4 = 0 // i4+=1 // arr.push(i4) if(bar_index == 4) log.info('Value of array containing incremental values : {0}', arr) Expand 30 lines 🎲 References Pine Script® User Manual - Variable declarations Pine Script® Reference Manual - var
Trendoscope
Thinking in Pine - Time Series Special Cases
Hello Everyone,
Welcome back to
"Thinking in Pine"
short video series. In this session, we have discussed few special cases of time series variables and using historical operator within local scope.
If you have not watched our previous video -
"Thinking in Pine - Time Series"
, request you to do that before continuing this video.
🎲 Summary of our today's discussion
How historical operator works for variables defined inside an conditional block
How historical operator works for variables defined in a loop.
🎯 Example Program Used
Pine Script®
// Time series for variables within a condition
varip showLogInLoop = true
if(bar_index%3 == 0)
specialBarIndex = bar_index
if(bar_index > last_bar_index-3 and showLogInLoop)
log.info('Current and Previous special bar index are : {0} and {1}', specialBarIndex, specialBarIndex[1])
showLogInLoop := false
// Time series of variables within a loop
arrayOfX = array.new
Disclaimer
Any content and materials included in Sahmeto's website and official communication channels are a compilation of personal opinions and analyses and are not binding. They do not constitute any recommendation for buying, selling, entering or exiting the stock market and cryptocurrency market. Also, all news and analyses included in the website and channels are merely republished information from official and unofficial domestic and foreign sources, and it is obvious that users of the said content are responsible for following up and ensuring the authenticity and accuracy of the materials. Therefore, while disclaiming responsibility, it is declared that the responsibility for any decision-making, action, and potential profit and loss in the capital market and cryptocurrency market lies with the trader.