
Trading_Paradise
@t_Trading_Paradise

What symbols does the trader recommend buying?
Purchase History
پیام های تریدر
Filter
Trading_Paradise
BNB Short Setup: Bear Market Start Confirmation?
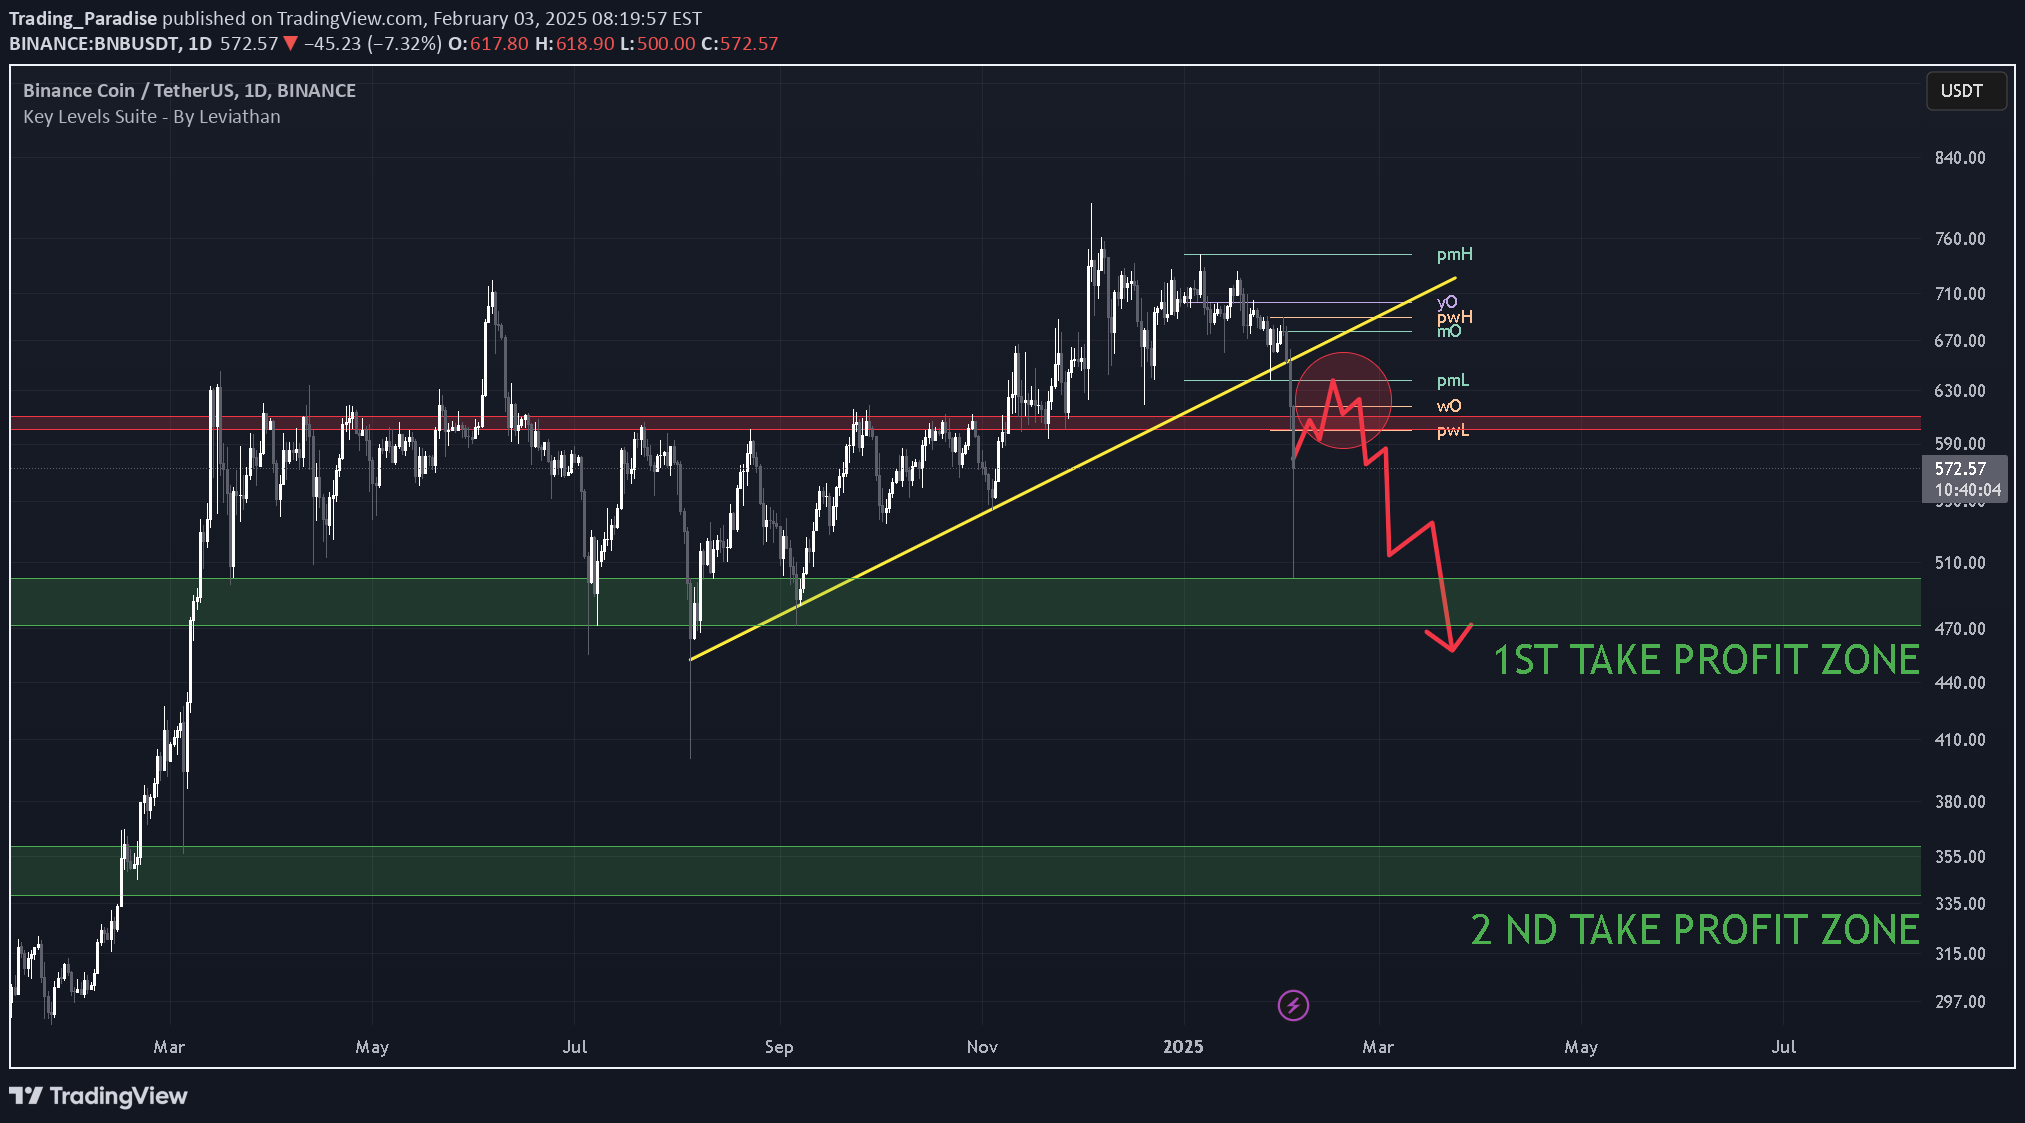
1) Macro Overview (USDT Dominance): - We’ve just broken above 4.38% on USDT Dominance, a key resistance level. - As long as USDT Dominance remains above 4.38%, it suggests a potential start to a broader bear market. - A drop back below 4.38% and the Yearly Open would invalidate this bearish scenario. 2) BNB Technicals: - BNB’s chart structure looks weak and appears to have topped. - I’m watching the $600 – $640 zone (confluence with the previous Monthly Low) as a potential area for short entries. - Overall momentum suggests fading any rallies into that zone. 3) Trade Idea: - Short BNB on any push between $600 – $640. - Take profits into the green boxes. - Tight risk management is crucial; a strong reclaim above this range could invalidate the short setup. As always, manage your risk carefully, this is just my personal view, not financial advice. Good luck and happy trading!
Trading_Paradise
Potential Long Position on $GALA

Current Indicators: Weekly Support: We are currently above the weekly support level at $0.03474. Yellow Diagonal Support Trendline: The price is holding above the yellow diagonal support trendline. Accumulation Zone: We've had 52 days of price accumulation, with the price bouncing within a range. Momentum Indicator: The "Squeeze Momentum TD - A Revisited Version of the TTM Squeeze" is currently dark green, indicating a mildly bullish sentiment. Overall Trend: We are in an overall uptrend. What's Missing for Confirmation: Break Above Diagonal Yellow Resistance Trendline: We need to see a break above this key resistance level. Break Above Key Resistance at $0.04971: Clearing this resistance would further confirm a bullish trend. Target Price (TP) Zone: TP Zone: $0.09 area Conclusion: If we break above both the diagonal yellow resistance trendline and the key resistance at $0.04971, this presents a very good long opportunity. Keep an eye on these levels for confirmation.
Trading_Paradise
Altcoin Alert: UMA Potential Breakout

Overview: The recent surge in Bitcoin could soon translate into buying pressure for altcoins. Let's focus on UMA using the 1D chart. Bull Flag Formation: UMA is currently forming a clear bull flag pattern, indicating a potential breakout. If it materializes, we could witness an explosive 186% move. Although it might seem far-fetched, such occurrences are not uncommon in the crypto space. Market Cap and Ranking: UMA boasts a modest market cap of $492M and holds the 190th rank among all coins. Given its market cap, it has the potential to swiftly climb the rankings with a breakout. Indicator Insight: Keep an eye on the "Squeeze Momentum TD" indicator on the chart. This free tool helps identify bullish or bearish momentum. Currently, the indicator is transitioning from light red to dark red, suggesting that bearish momentum might be losing steam. For confirmation, we'd ideally want to see a breakout accompanied by dark or light green on the indicator. Trade Strategy: While there's no trigger yet, it's crucial to monitor the price closely for any breakout signals. Once a breakout occurs with confirmation from the indicator, it could present a lucrative long trade opportunity. Stay tuned for updates as the situation develops!
Trading_Paradise
Long Opportunity on TWT - Technical Analysis Breakdown

Hello traders! 👋 Let's dive into a technical analysis of Trust Wallet Token (TWT). Chart Analysis: TWT 14 October 2023, reclaimed a crucial 1-week level at $1.0342 (green line). This led to an impressive impulsive move, reaching highs of $1.70 to $1.80, creating liquidity and notable inefficiency in the market. Despite a subsequent retracement, the price action has been respecting a yellow diagonal uptrend line. A small bull flag pattern has formed, with the price breaking above. Currently, we are trading above the previous resistance zone marked by the violet box. Trade Opportunity: I believe it's a favorable moment to consider a long position, given the bullish indications. The risk-reward ratio for this trade is 1:5, indicating a potentially lucrative setup. However, it's crucial to remain vigilant and consider switching to a short position if a daily candle closes below the yellow diagonal, with confirmation below the trendline. Conclusion: In summary, TWT presents a compelling long opportunity, but traders should closely monitor the yellow diagonal trendline for potential shifts in market sentiment. As always, remember to manage risk appropriately and stay updated with real-time market developments. Disclaimer: This is not financial advice. Always conduct your research and consider your risk tolerance before making trading decisions.
Trading_Paradise
SAND/USDT Key Support Reclaimed & Potential for Upside Movement

Hello Traders, Introduction: The crypto market is a fertile ground for traders who know where to look. Today, our focus is on the SAND/USDT Perpetual pair on Bybit, specifically on its 1d chart. An interesting long setup seems to be developing. Body: Key Support Reclaimed: The price recently reclaimed a significant support level at $0.3805. This development often suggests a potentially bullish price action in the making. POC Level: The Point of Control (POC) from January 1, 2023, to today stands at $0.52. This key level can act as a magnet for price action, possibly pulling the price towards it. Liquidity at $0.48: There's considerable liquidity in the $0.48 area, where a previous support breakdown led to a substantial drop. The price might rally to this level to fill this inefficiency. Bullish Stoch RSI: The Stoch RSI has crossed upwards and is above the 20 level, indicating rising bullish momentum. Stable RSI: The RSI currently stands at 40, with no noticeable divergences. This stability suggests that, for now, the current price level is holding. Trade Setup: With these factors in mind, I've decided to take a long position on SAND/USDT. My invalidation point for this trade is a close of a 1d candle below $0.3805, which would suggest a breakdown below our reclaimed support. Take Profit Targets: TP1: The first take profit target is set at $0.48. This level represents the area of high liquidity, which can act as a resistance level. TP2: The second take profit target is the POC level of $0.52. This level has historically attracted price action and could potentially do so again. Conclusion: While this setup seems promising, remember that trading carries inherent risks, and it's crucial to have proper risk management in place. Always be prepared for any scenario, and never invest more than what you can afford to lose.
Trading_Paradise
FTM/USDT 1D Analysis - Key Support and Potential Reversal

FTM/USDT 1D Analysis - Key Support and Potential Reversal Hello Traders, FTM/USDT has been on a strong downtrend on the daily chart, but there are potential bullish signs emerging as we approach some key levels: Strong Support Level: The price is nearing a significant support level at $0.2907. This level has acted as a reliable foundation in the past and might once again provide a strong bounce for the price. Untapped Liquidity: There's a potential untapped liquidity zone around $0.3053. As the price moves towards this area, we might see some increased buying pressure. Historical Downtrend and Bullish Divergences: In the past, FTM/USDT experienced a similar downtrend period for 92 days, which was filled with numerous bullish divergences before a reversal. Currently, we've been in a strong downtrend for about 42 days, and similarly, we're seeing many bullish divergences. Given these factors, I'm planning to take a long position at $0.29. My exit strategy involves two take-profit targets: Take Profit 1: $0.3496 Take Profit 2: $0.3892 Remember, this is my personal analysis and not financial advice. Always do your own research and manage your risk appropriately. Happy trading! Note: This analysis is for informational purposes only and should not be construed as financial advice. Always conduct your own research before making investment decisions.
Disclaimer
Any content and materials included in Sahmeto's website and official communication channels are a compilation of personal opinions and analyses and are not binding. They do not constitute any recommendation for buying, selling, entering or exiting the stock market and cryptocurrency market. Also, all news and analyses included in the website and channels are merely republished information from official and unofficial domestic and foreign sources, and it is obvious that users of the said content are responsible for following up and ensuring the authenticity and accuracy of the materials. Therefore, while disclaiming responsibility, it is declared that the responsibility for any decision-making, action, and potential profit and loss in the capital market and cryptocurrency market lies with the trader.