
TradingHub_FX_crypto
@t_TradingHub_FX_crypto

What symbols does the trader recommend buying?
Purchase History
پیام های تریدر
Filter
TradingHub_FX_crypto
BTC Sell Idea
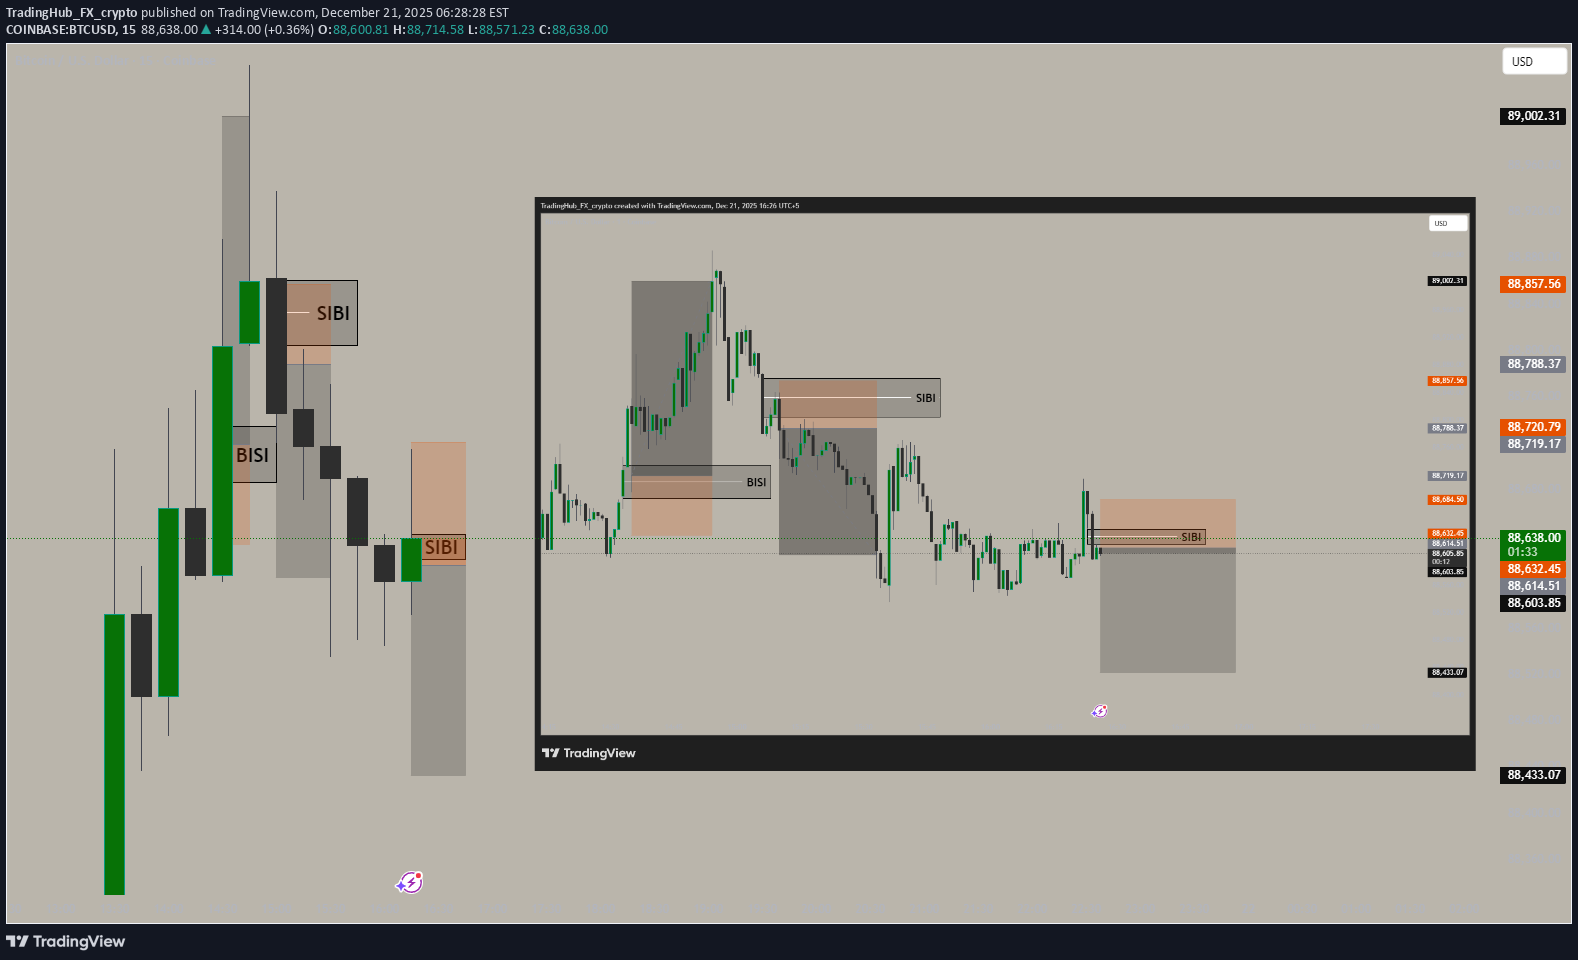
its only based on 1 minute time frame based on sell side imbalance
TradingHub_FX_crypto
XAUUSD BUY BRick Stoploss
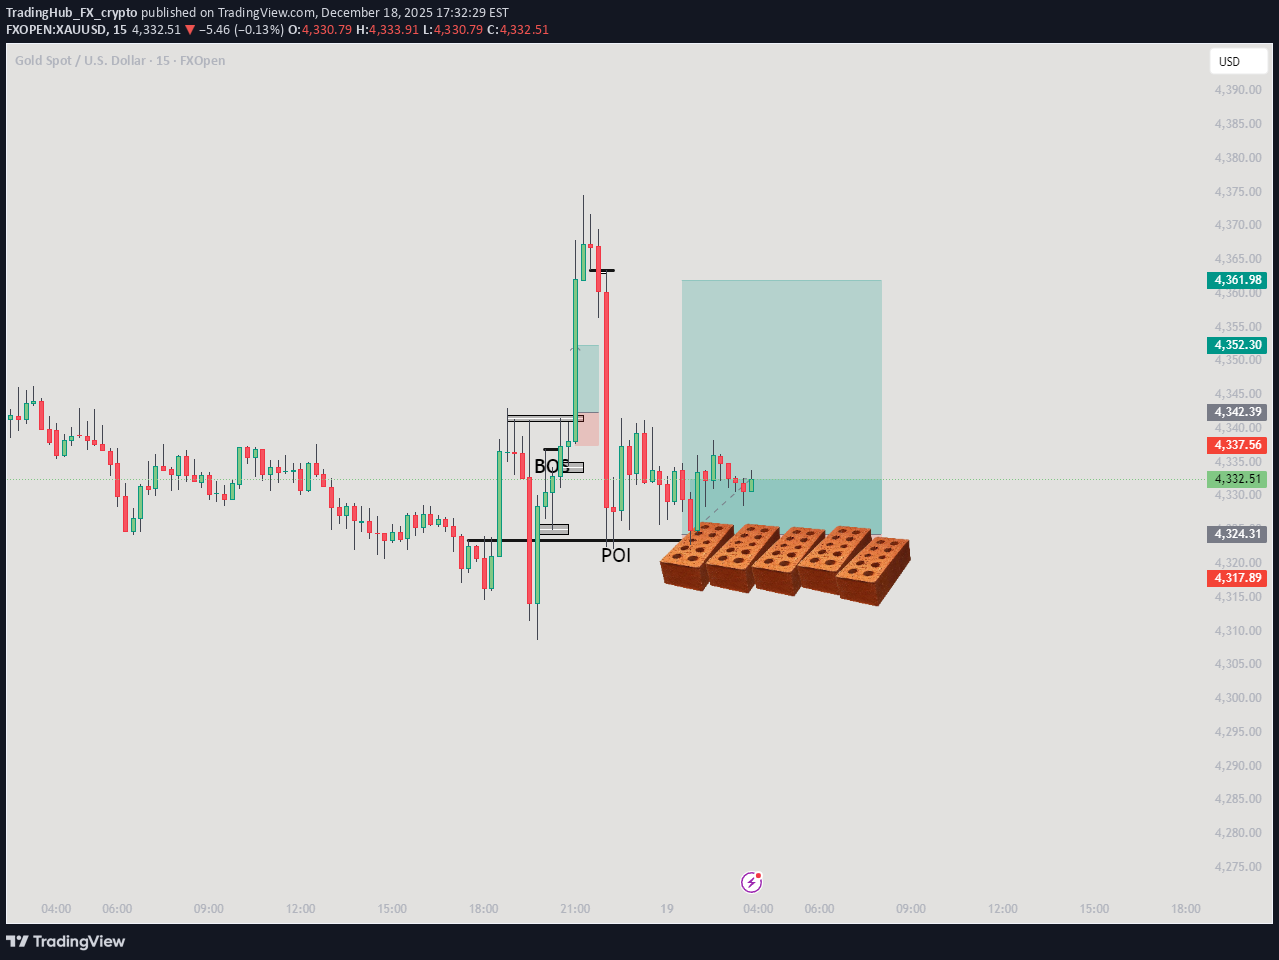
its a special brick SL trade that doesnt allow the price to come down for fun purpose
TradingHub_FX_crypto
How to trade Gold like Pro
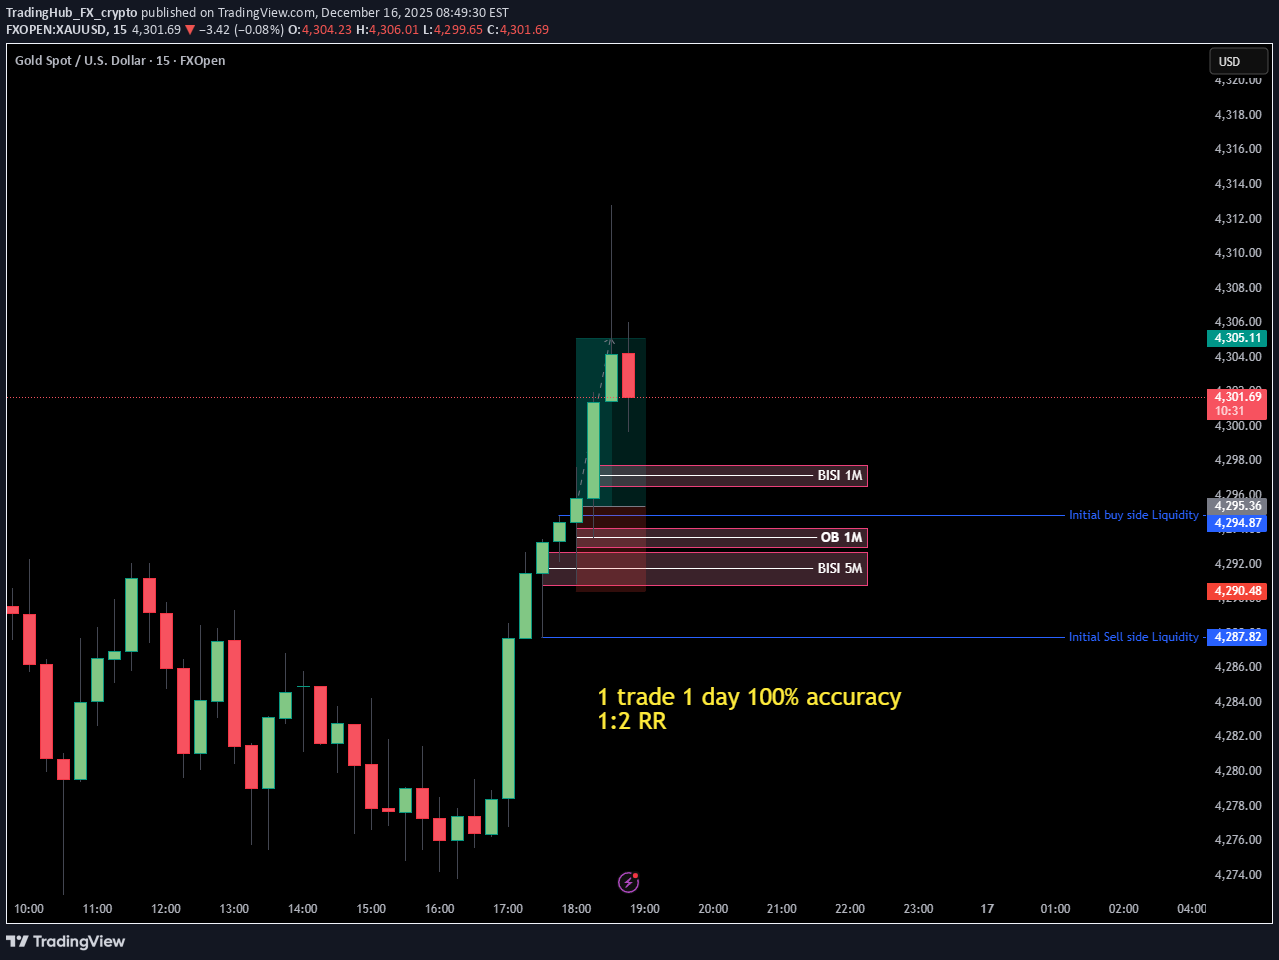
trade a 15 min candle full of volume find reasons and take trade on 1 min Time frame for Best accuracy
TradingHub_FX_crypto
Prediction for btc For next Liquidity Swipes
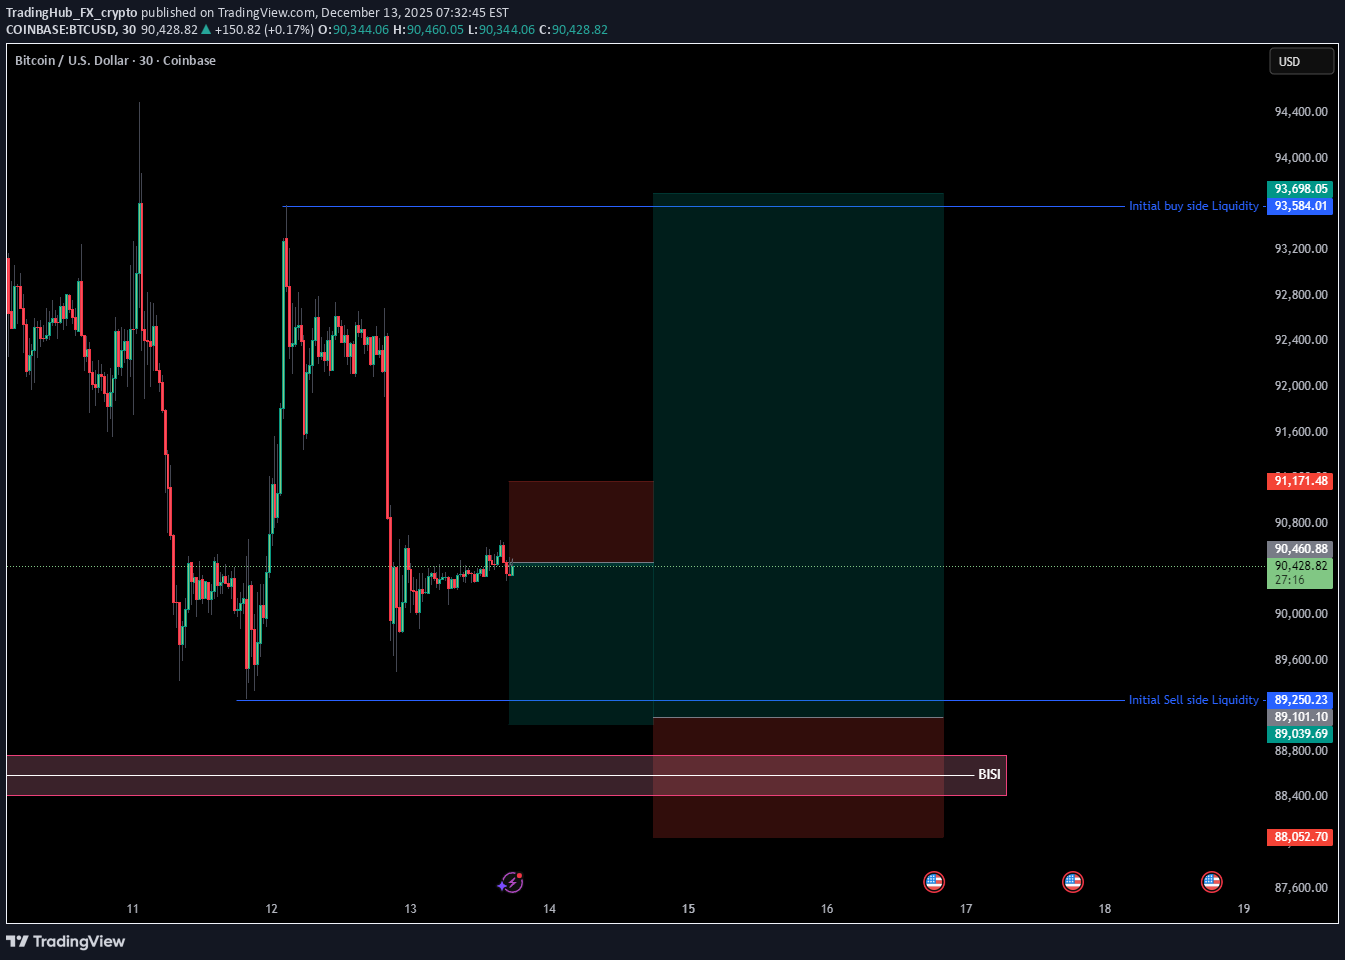
1) What “Liquidity Swipes / Liquidity Sweeps” Mean in BTC Context In trading terminology, a liquidity sweep occurs when price temporarily breaches a cluster of orders (stop‑losses or limit orders) at key technical levels and triggers them, often before reversing or continuing in trend. These are not new fundamentals but rather order‑flow events that cause short‑term volatility spikes. Quadcode Why it matters for BTC: Major liquidity sweeps are typically seen near psychological round numbers, prior multi‑week highs/lows, or major support/resistance zones. They can generate false breakouts and look like trend changes, but often represent liquidity exhaustion by large participants. onesafe.io Note: Liquidity sweeps themselves aren’t predictive of long‑term direction by default; their interpretation depends on whether price rejects back inside the range (bearish continuation) or accepts beyond the level (bullish trend). Equiti Default 2) Near‑Term BTC Price Expectations (Late 2025 – Early 2026) Analyst forecasts and on‑chain/technical indicators suggest broad consensus around a mild to moderate uptrend, but with wide uncertainty ranges: Conservative / Technical‑Driven View Some technical models project BTC holding around current levels with modest growth into 2026 (examples show moderate annual increases of 5–10%). Kraken Short‑term ranges near liquidity sweep zones (like $90K–$100K) may persist if volatility prevails. Bullish Institutional‑Flow View A number of analysts, especially those incorporating spot ETF flows, reduced circulating supply, and post‑halving dynamics, forecast continued upward pressure into early 2026. Key potential levels frequently mentioned are: $110,000 to $130,000+ by mid‑2026 if institutional flows resume. CoinDCX Mixed Macro and Revised Analyst Targets Standard Chartered revised its 2026 Bitcoin target to around $150,000, citing reliance on ETF inflows rather than corporate treasury buying. Business Insider Fundstrat and other bullish forecasters have suggested forecasts as high as $200,000–$250,000+ by year‑end 2026 under strong ETF demand assumptions. finance.yahoo.com Key takeaway: Consensus ranges for year‑end 2026 span $100K to $250K+, reflecting differing models and assumptions. 3) How Liquidity Events Relate to Price Predictions Key Influences During Liquidity Swipes: Liquidity sweeps can act as inflection points—triggering large collections of stops which may either accelerate an upward trend (if accepted) or signal temporary sell‑offs before resuming a broader trend. Equiti Default Near major technical levels (e.g., round‑number support/resistance, or previous swing highs), sweeps could amplify volatility, especially with low macro liquidity. Quadcode Implication for Forecasts: A sweep through a key resistance (e.g., above recent highs) followed by acceptance could propel BTC toward higher analyst targets. Conversely, repeated sweeps with rejection may keep BTC range‑bound or trigger deeper consolidation before resuming trend. Thus, liquidity events are not standalone price predictors but confirmation mechanisms within a larger trend framework. 4) Macro & Liquidity Backdrop BTC’s price trajectory is also influenced by external liquidity conditions: Broad risk asset liquidity (Fed policy direction, interest rate expectations) affects BTC volatility and risk appetite. Recent guidance suggests uncertainty around the pace of easing into 2026, which could both tighten and widen BTC trading ranges. MEXC Low liquidity periods tend to magnify liquidity sweeps and sharp intra‑day moves. 5) Summary Outlook (Forecast Bands) Time PeriodScenarioRough BTC Forecast Late 2025Post‑liquidity consolidation~$90K–$110K Early 2026ETF‑driven flows resume~$110K–$130K Year‑End 2026 (Moderate)Mixed macro~$120K–$150K Year‑End 2026 (Bullish)Strong institutional flows~$180K–$250K+ These are ranges based on existing analyst forecasts and technical projections (not financial advice) and assume major liquidity and macro drivers remain active through next year. Business Insider +1 6) Practical Considerations Liquidity sweeps in BTC are most relevant on shorter time frames; use them with broader trend analysis and volume context. Macro conditions and ETF flows will likely be dominant drivers in 2026 rather than liquidity sweeps alone.First trade TP hit second activefirst hit TP 2nd hits sl as it was an extra manipulation
TradingHub_FX_crypto
taking a trade on gold if it respects the bISI and the order blo
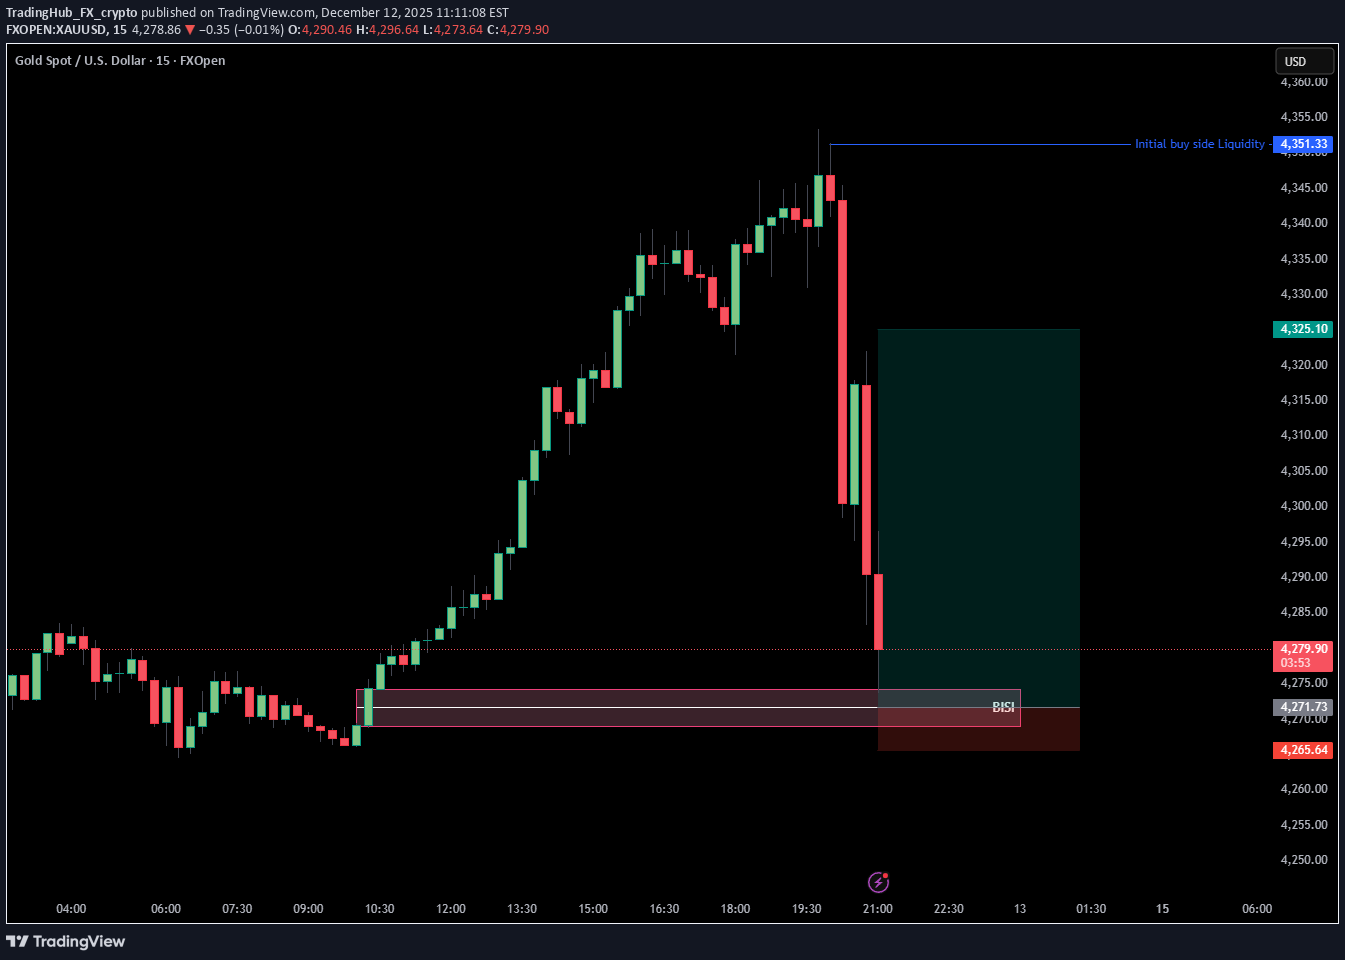
1. Understand the Concepts: BISI (Break of Structure, Internal Structure, and Institutional Order Flow): Break of Structure (BOS): This refers to a change in market direction. For example, when a market makes a new high or low, signaling a change in trend. Internal Structure: This involves analyzing market structure within a trend. For example, the market might make higher highs and higher lows in an uptrend or lower highs and lower lows in a downtrend. Institutional Order Flow: This focuses on understanding the movement that big institutions are likely creating in the market. You look for patterns of accumulation or distribution where price is likely to reverse based on institutional buying and selling. Order Block: An order block is a price area where institutions have placed large buy or sell orders, causing a significant market move. These are often seen as areas where price might reverse or continue after a pullback. 2. Setting Up the Trade: Step 1: Identify the Break of Structure (BOS) Check if the market has broken a significant structure point (either a high or low), indicating a possible trend reversal or continuation. For gold, look for recent highs and lows that have been breached. Step 2: Locate Internal Structure In the context of an uptrend, gold might make higher highs and higher lows. In the context of a downtrend, look for lower highs and lower lows. Identify areas where the price has been consolidating or retracing within the trend, as these are important spots for potential breakouts. Step 3: Check for Institutional Order Flow Look for areas on the chart where there has been a significant move, followed by consolidation. This is often indicative of institutional order flow. An order block could be seen as a consolidation zone, followed by a large price movement away from it. If price retraces back to this area, it might act as support (in an uptrend) or resistance (in a downtrend). Step 4: Look for the Order Block Identify key order blocks. These are typically found at major turning points in the market or after a strong price move. If price retraces back to the order block area, and it aligns with the BISI criteria, it could provide a potential entry point. 3. Confirming the Trade: Once you've identified a BOS, an internal structure in alignment with the trend, and a valid order block, you can look for a confirmation to enter the trade. Candlestick patterns or volume analysis could provide additional confirmation, such as a bullish engulfing or a pin bar at the order block. If you're trading a reversal, look for signs of exhaustion (such as divergence) at the order block area. 4. Trade Execution and Management: Entry: Enter the trade when price respects the order block and confirms the break of structure. Stop Loss: Place your stop loss slightly below (in case of an uptrend) or above (in case of a downtrend) the order block area, depending on your risk tolerance. Take Profit: Set your take profit at a logical target, such as the next swing high/low, a key level of support/resistance, or a risk-to-reward ratio that suits your strategy.respected the SIBI to we are in the trade nowTP hits good profits
TradingHub_FX_crypto
ETH USD SELL NOW 3182
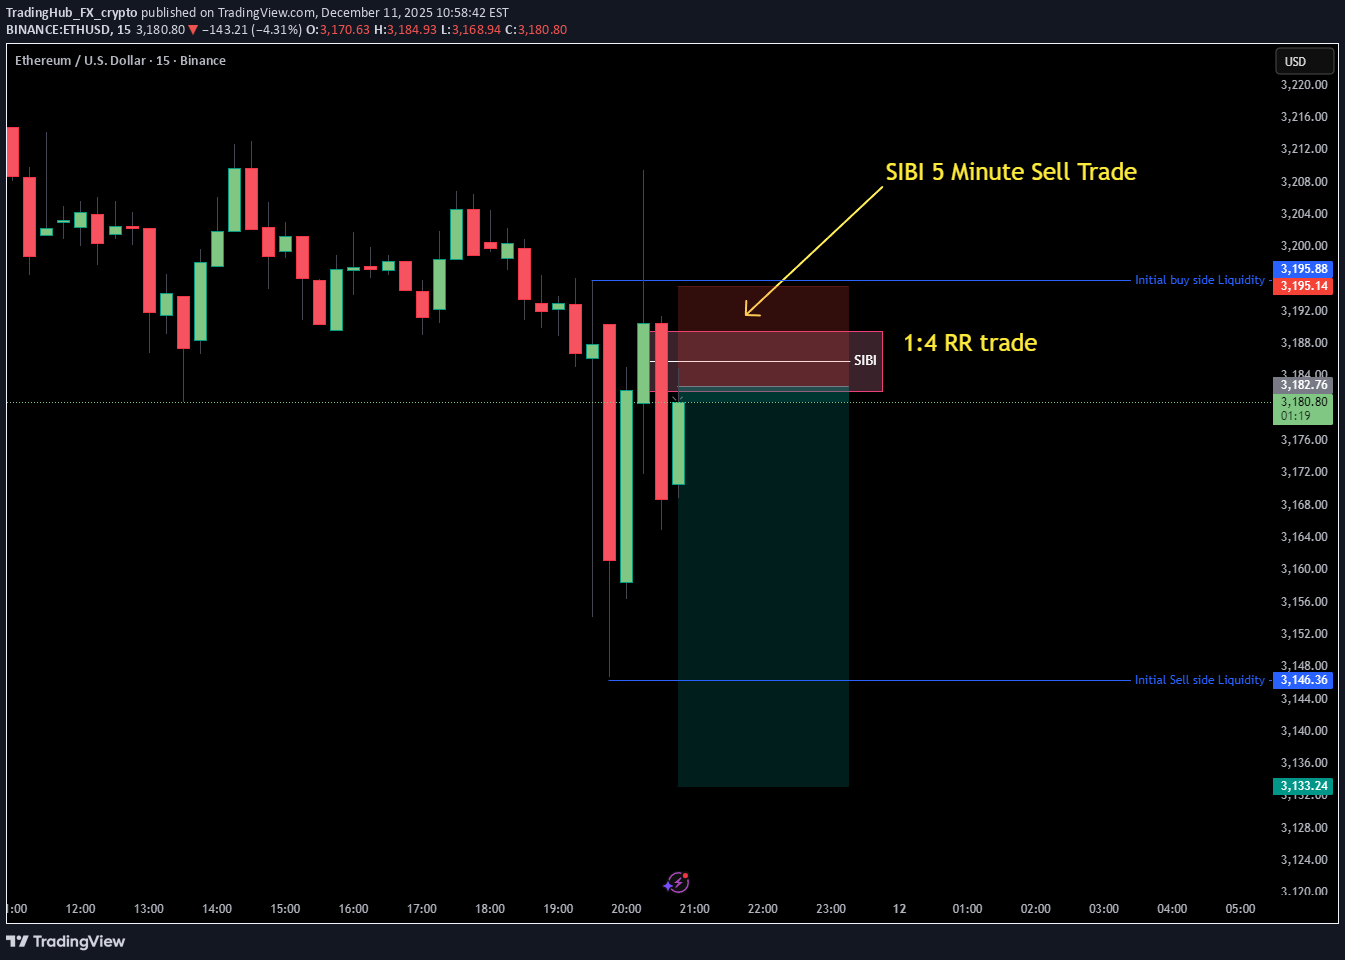
posting the sell trade based on sell side imbalance and buy side ineffiencicy ETH USD SELL NOW 3182 Sl and TP are 1:4 RRalready in !:2 RR profit closing half and moving Sl to entryHits Break even
TradingHub_FX_crypto
هدف ۱۱۵ هزار دلاری بیت کوین: سیگنال نهایی صعود پارابولیک!
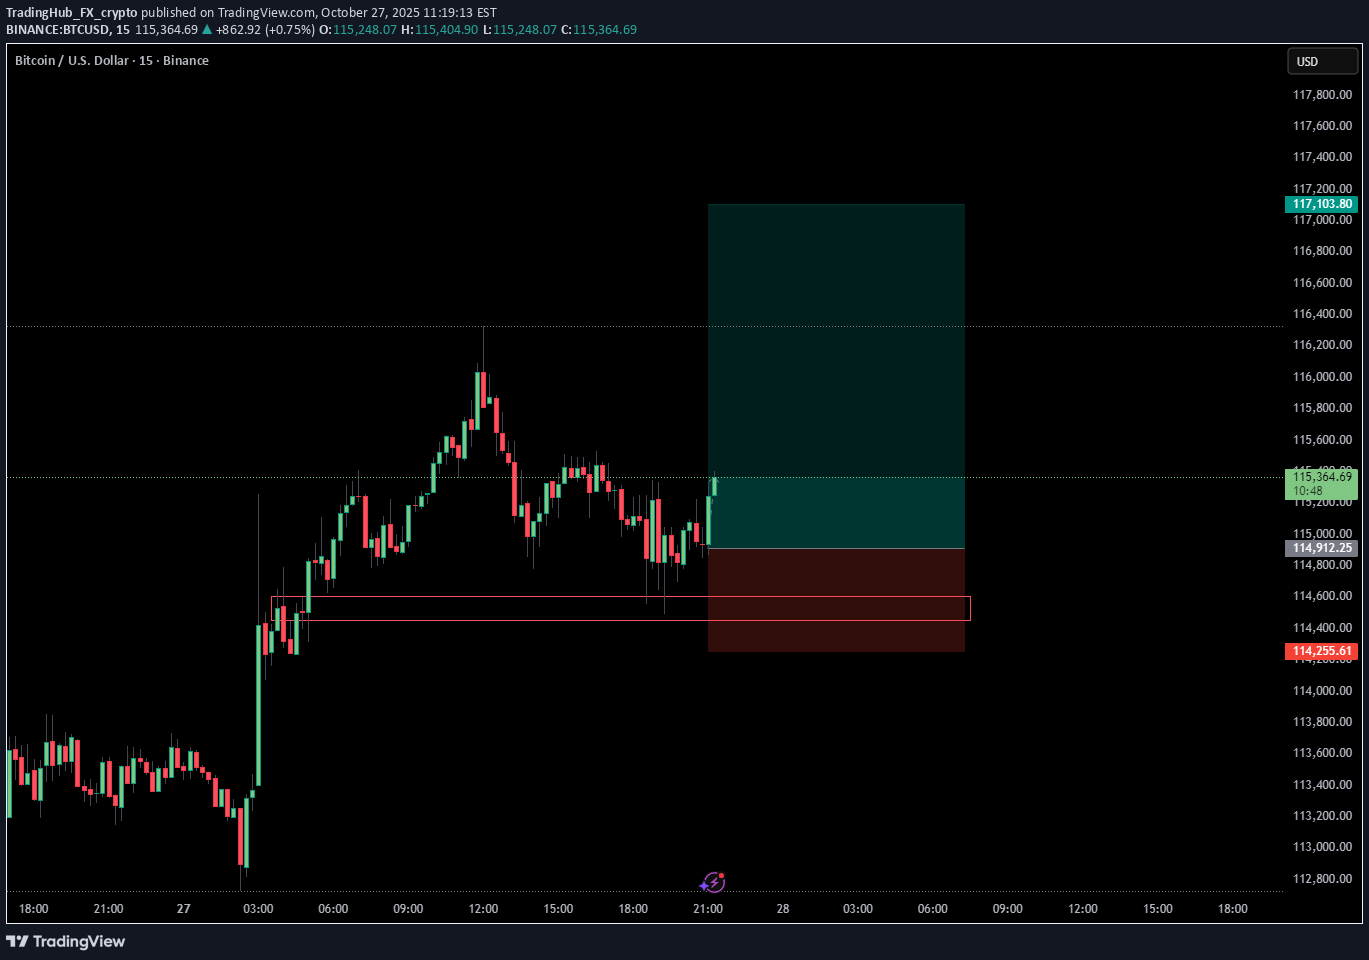
The Logic Behind $115,200: This analysis pinpoints the critical multi-year resistance/supply zone at $115,200. A confirmed close above this level is the ultimate trigger for the next parabolic leg up in the Bitcoin cycle. Our proprietary [Your Indicator Name] provides a filtered, no-noise signal specifically for this major breakout level. Key Features: * Precision Entry: Alerts only on the confirmed breach of the 115,200 supply * Risk Management: Includes projected Take Profit 1 & 2 targets * Filtered Noise: Uses [Mention your key concept, e.g., Volume-Weighted Moving Average] to validate the move Action: Set your alerts and prepare for liftoff! The market structure dictates that this level is make-or-break for a new All-Time High pursuit.
TradingHub_FX_crypto
قیمت طلا در ۴۰۸۵: آیا زمان خرید است یا فروش؟ (تحلیل کلیدی حمایت/مقاومت)
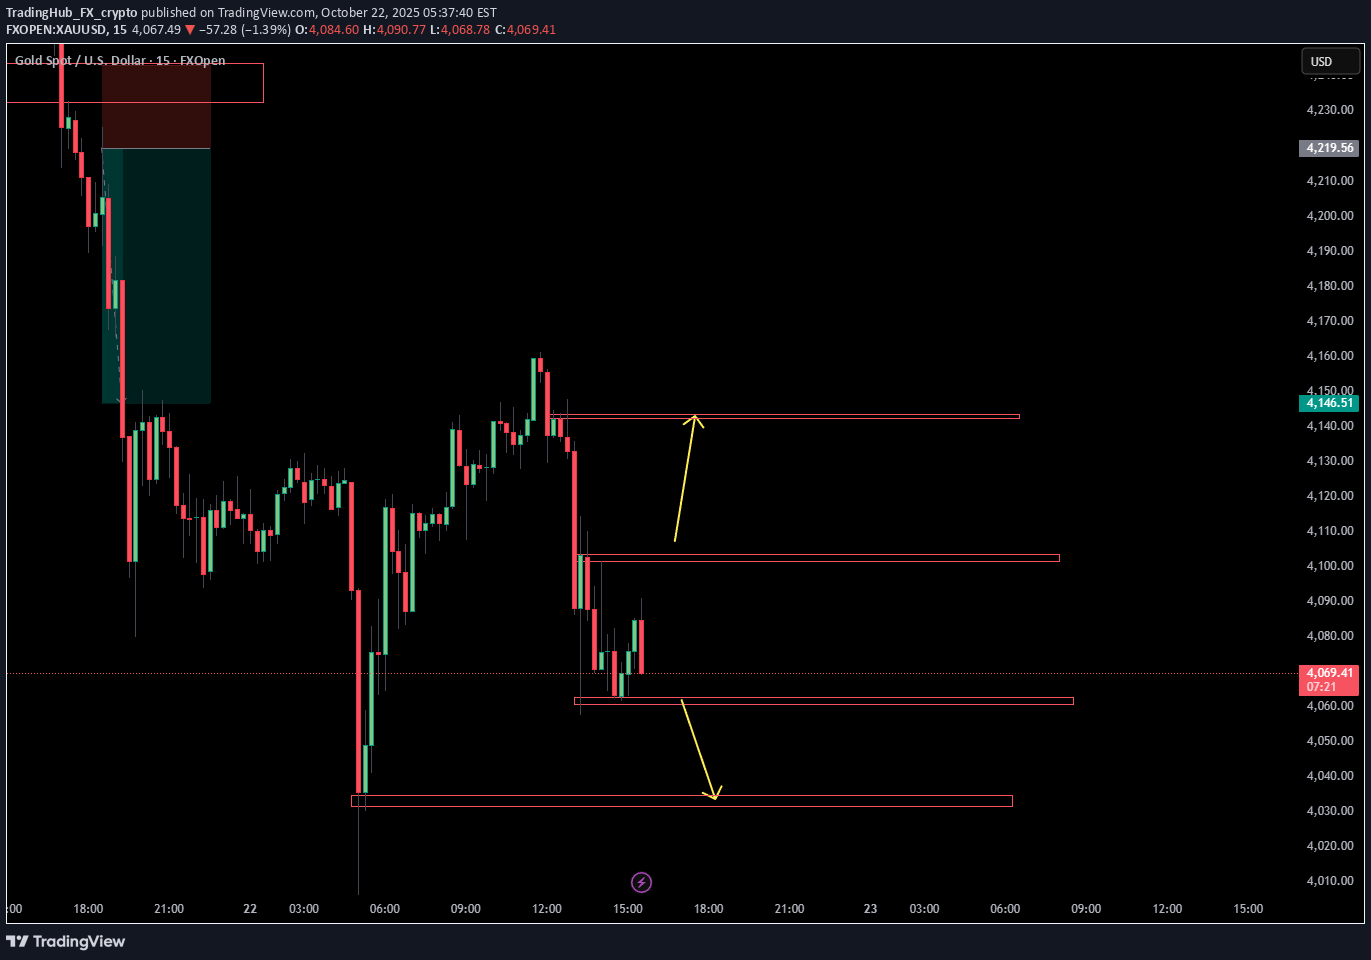
Based on recent trading ideas for Gold on TradingView, the price level around 4085 is often cited as a key technical level: Support/Buy Zone: Many analyses view the area around $4085 - $4090 as a critical support level or a demand zone. If the price drops to this level and shows signs of reversing (like a bullish candlestick pattern), it's often seen as a good opportunity to BUY (go long), expecting the price to rebound. Invalidation/Sell Trigger: Conversely, if the price breaks clearly and holds below $4085 (or the nearby support zone), it is often considered an invalidation point for the bullish view. This breakout below support would typically signal a shift to a bearish bias, leading traders to consider SELL (go short) positions with targets at lower levels. Decision Zone: In some cases, $4085 is part of a larger "Decision Zone" (e.g., $4085–$4125), where the market's reaction dictates the next short-term trend. In summary, a "4085 gold buys or sells" TradingView idea is likely suggesting: BUY (Long) if the price holds above or bounces from $4085. SELL (Short) if the price breaks and closes convincingly below $4085.was a sell and made profits
TradingHub_FX_crypto
خرید طلا (XAUUSD) در 3888: سیگنال صعودی قوی و اهداف سود!
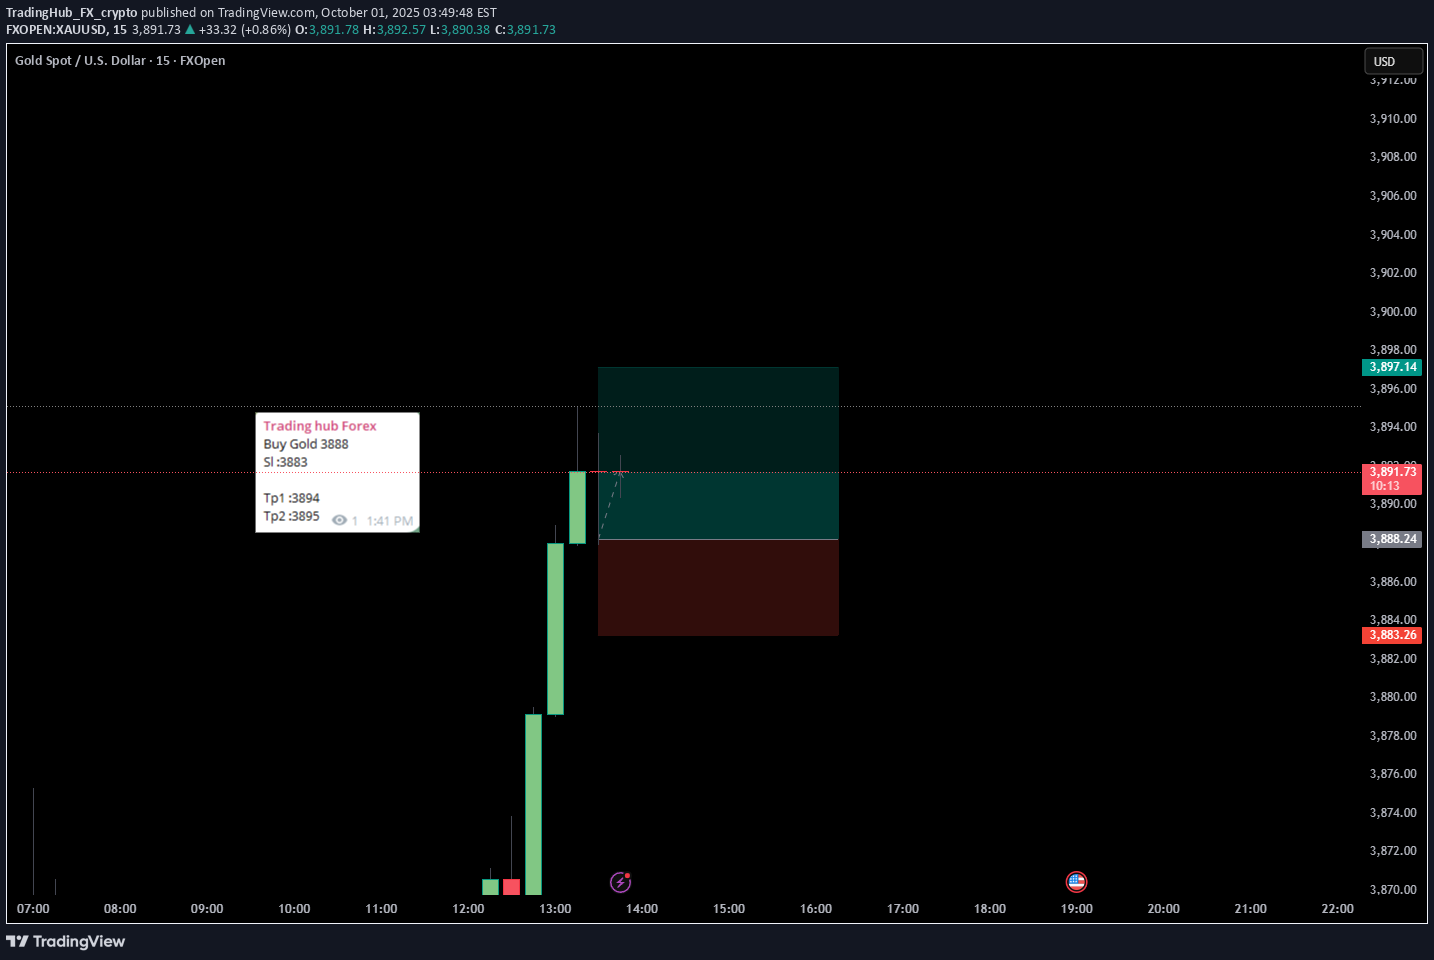
Position: Long (Buy) Market: XAUUSD (Gold) Analysis: [Describe the core reason for the trade. For example, "Gold is showing strong bullish momentum after a breakout from a key resistance level." or "Price is bouncing off a major support zone, indicating a potential reversal."] Entry, Stop Loss, and Take Profit: Entry: Buy at $3888 Stop Loss (SL): $3883 Take Profit 1 (TP1): $3894 Take Profit 2 (TP2): $3895 Technical Rationale: [Key Analysis Point 1]: [Explain why you chose the entry point. Example: "The $3888 level served as a critical resistance, and the recent breakout signals a strong shift in market sentiment. The retest of this level as support is a classic confirmation signal."] [Key Analysis Point 2]: [Explain your Stop Loss. Example: "The stop loss is placed below the recent swing low at $3883 to protect against a false breakout and ensure a favorable risk-to-reward ratio."] [Key Analysis Point 3]: [Explain your Take Profit targets. Example: "Our first take profit target, TP1 at $3894, is a conservative target based on the previous high, while TP2 at $3895 is a more ambitious target based on Fibonacci extensions or the next significant resistance level."] Risk Management: Always use a proper risk management strategy. This is not financial advice. The risk-to-reward ratio for this trade is approximately [Calculate and state the R:R ratio]. Disclaimer: This analysis is for educational purposes only and should not be considered financial advice. Trading involves risk. Always do your own research and analysis before entering a trade. Note: You can also add more details to your rationale, such as specific indicators you used (e.g., RSI, MACD), candlestick patterns you observed (e.g., hammer, engulfing), or fundamental factors (e.g., news releases, economic data) that support your trade.
TradingHub_FX_crypto
XAUUSD sell 3815
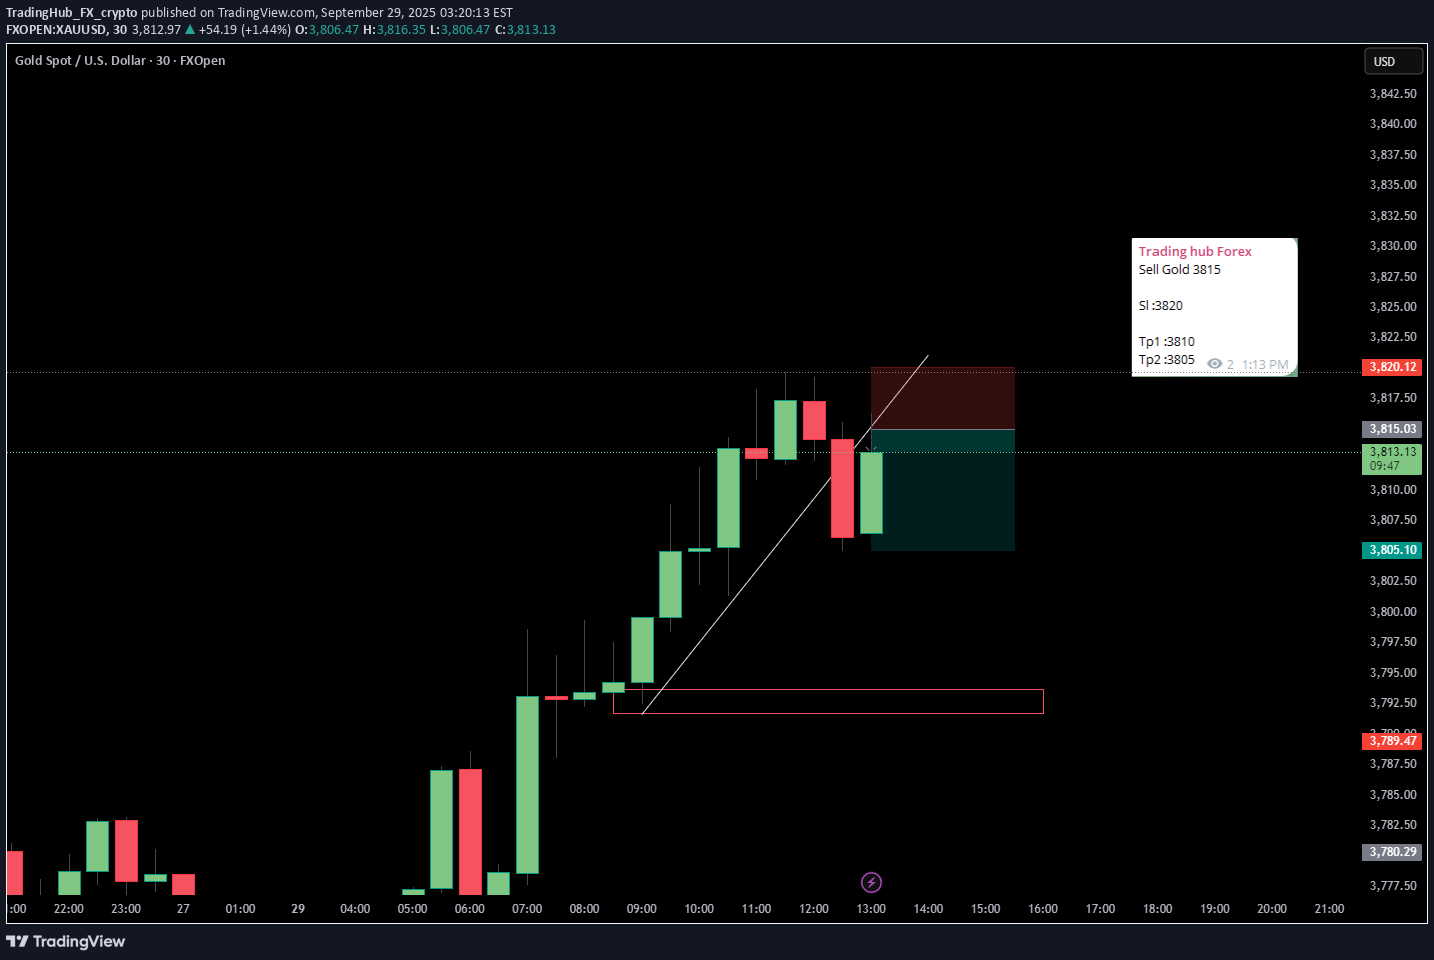
🔻 XAUUSD Short Setup – Entry: 3815 Gold is testing resistance at 3815, offering a clean short opportunity for intraday traders. Key bearish signals: - 🔸 Price rejection at minor supply zone - 🔸 Lower high structure on 1H chart - 🔸 Bearish momentum building with fading volume - 🔸 DXY strength pressuring gold downside 📉 Trade Plan: - Entry: 3815 - Stop Loss: 3820 - Take Profit 1: 3810 - Take Profit 2: 3805 Risk/reward ratio: 1:1 to 1:2 – ideal for scalpers and short-term momentum traders. Monitor macro news and USD strength for volatility cues.Running 70 pips in profit lets goo
Disclaimer
Any content and materials included in Sahmeto's website and official communication channels are a compilation of personal opinions and analyses and are not binding. They do not constitute any recommendation for buying, selling, entering or exiting the stock market and cryptocurrency market. Also, all news and analyses included in the website and channels are merely republished information from official and unofficial domestic and foreign sources, and it is obvious that users of the said content are responsible for following up and ensuring the authenticity and accuracy of the materials. Therefore, while disclaiming responsibility, it is declared that the responsibility for any decision-making, action, and potential profit and loss in the capital market and cryptocurrency market lies with the trader.