
TradingForecast_Signals
@t_TradingForecast_Signals
What symbols does the trader recommend buying?
Purchase History
پیام های تریدر
Filter
Signal Type

TradingForecast_Signals
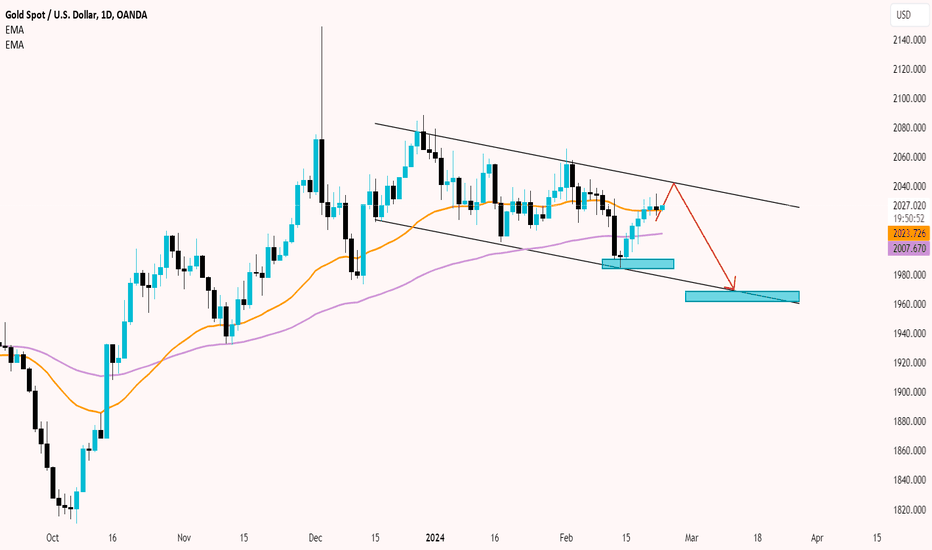
Dear friends, today gold continues to move below the resistance level of $2033, following a downward trend. In particular, the inflation data for January, with consumer prices and wholesale prices rising faster than expected, has made the US Federal Reserve more difficult in making a decision to loosen monetary policy. Gold may continue to trade sideways in the short term, and the market is awaiting the release of the Personal Consumption Expenditures (PCE) report next week, followed by the Federal Reserve Chairman Jerome Powell's testimony at Congress in early March.

TradingForecast_Signals
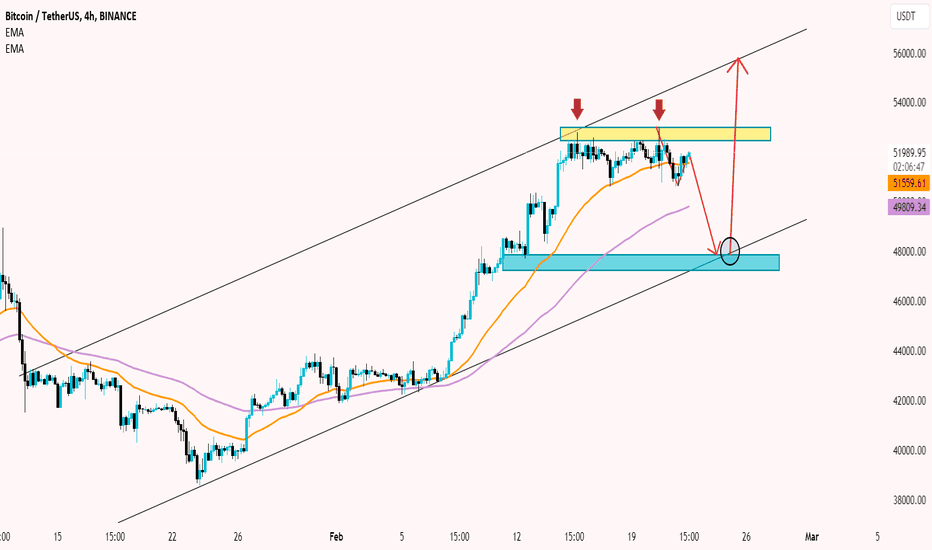
The BTCUSDT is once again trading below the resistance level of $52,000, mainly moving sideways around the price level of $51,866, highlighting a 0.03% increase for the day. From the 4-hour chart, we observe that this coin has exhibited a double top pattern, and if it breaks below the support level of $50,600, the ultimate profit target that the market could aim for is at $43,000. The strategy is to buy when the price declines in the short term, as long as the support level of $43,000 is maintained for BTC.

TradingForecast_Signals
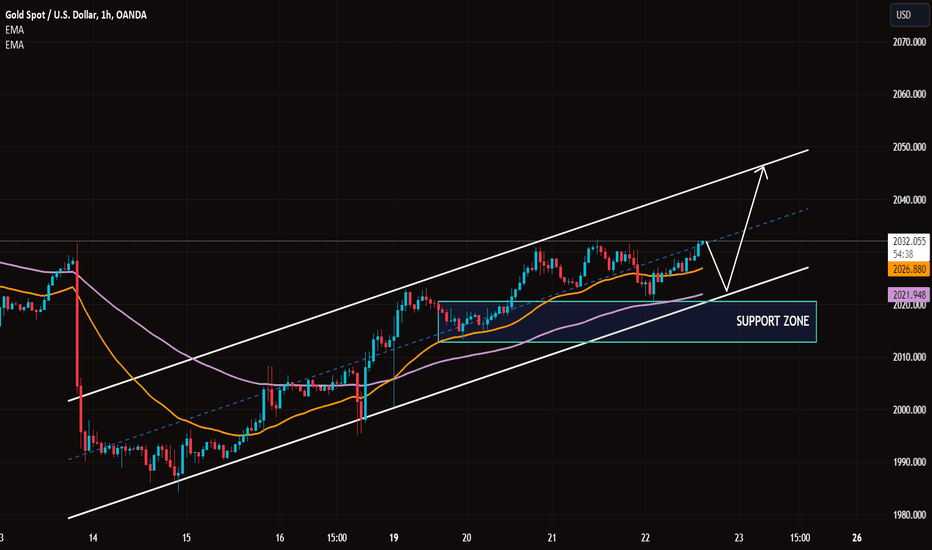
Dear friends, what do you think about the next trend in Gold? Today, the price of gold has regained momentum, rising nearly $2,030 at the start of Thursday after a brief pause in its recovery on Wednesday. The market's risk-accepting environment is playing a role as a resistance to the US Dollar, despite the hawkish tone of the January meeting minutes from the US Federal Reserve. Furthermore, recent price action suggests that gold is holding above the support level, with upward momentum supported around 2015 and 2020. On the other hand, technical indicators such as the EMA 34 and 89 continue to consider a potential buying position. Trading with the trend is always safe and effective.

TradingForecast_Signals
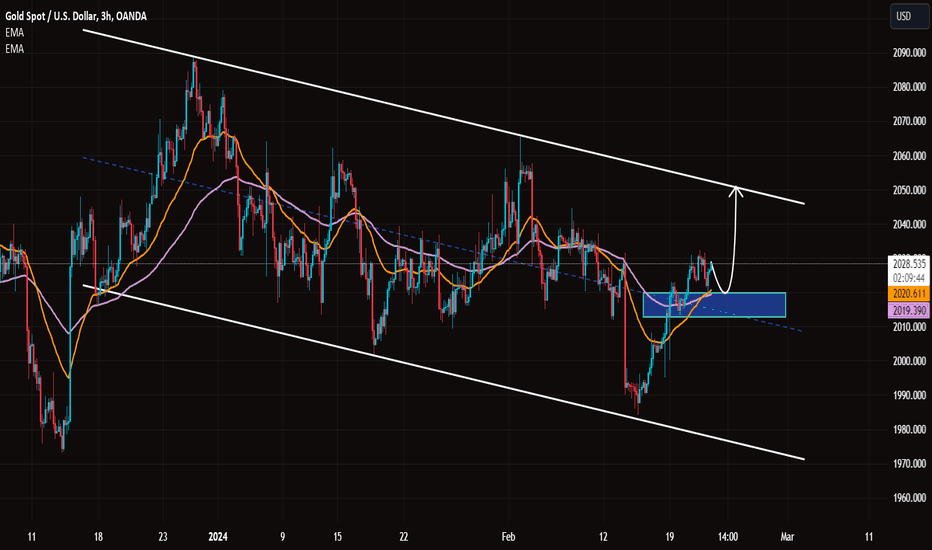
Today, gold is trending upwards in the discounted zone. So what reasons could push the price of gold higher in this environment? Currently, the price is trading around $2026 with little change compared to yesterday's trading session, highlighting a 0.05% increase for the day. On the other hand, the Federal Reserve released the minutes of their January meeting, reassuring market participants that the Fed is in no hurry to cut interest rates in the near future. Given the current picture, it would not be surprising if the previous breakout zone is soon retested before any short-term price momentum occurs.

TradingForecast_Signals
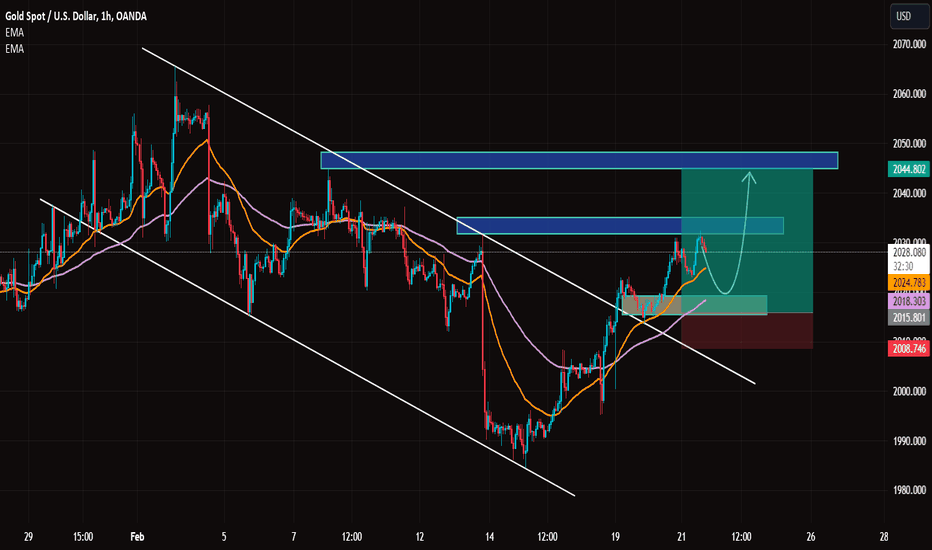
Dear friend, what do you think about the trend of Gold? Today, the price of gold is at its highest level in many days, reaching $2,030 before the Fed's minutes. The US dollar remains weak against the interest rate of the US Treasury, despite the gloomy risk sentiment. My target after a slight decline in the gold price towards the support level of $2019 (which coincides with the convergence of EMA 34 and 89) will be an increase with a target of $2031, followed by a breakthrough and reaching the final target of $2044. What are your thoughts? Good luck with your trading!

TradingForecast_Signals
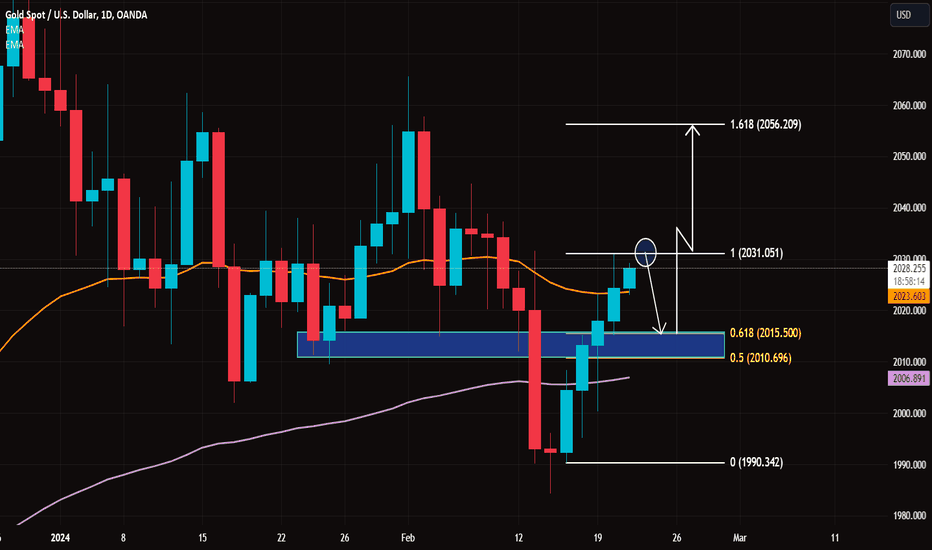
Dear friends, Today, gold ended the trading session with a significant price increase. This precious metal is currently trading at $2027, highlighting a 0.18% increase for the day. You may wonder why the price has risen so sharply. Regarding international market information: The US dollar is influenced by increasing speculation that the Federal Reserve (Fed) will maintain high interest rates for a longer period. Therefore, the potential for gold price increases could be generated from a depreciation of the USD if Fed officials are hesitant to cut interest rates. Outcome: This precious metal will be driven by strong demand from central banks and economic downturns. From this, it can be argued that it has the potential to reach new record levels by the end of 2024. Regarding technical analysis and gold price predictions in the near future: The exponential moving average (EMA) continues to support an upward trend. It has surpassed the price resistance levels around $2015 and $2010, indicating that in the short term, it may soon retrace to this breakout zone before resuming its upward movement. Currently, gold is operating near the $2030 price resistance level, with $2040 being a psychological level. Breaking above this resistance level will open up opportunities for price increases in this precious metal.

TradingForecast_Signals
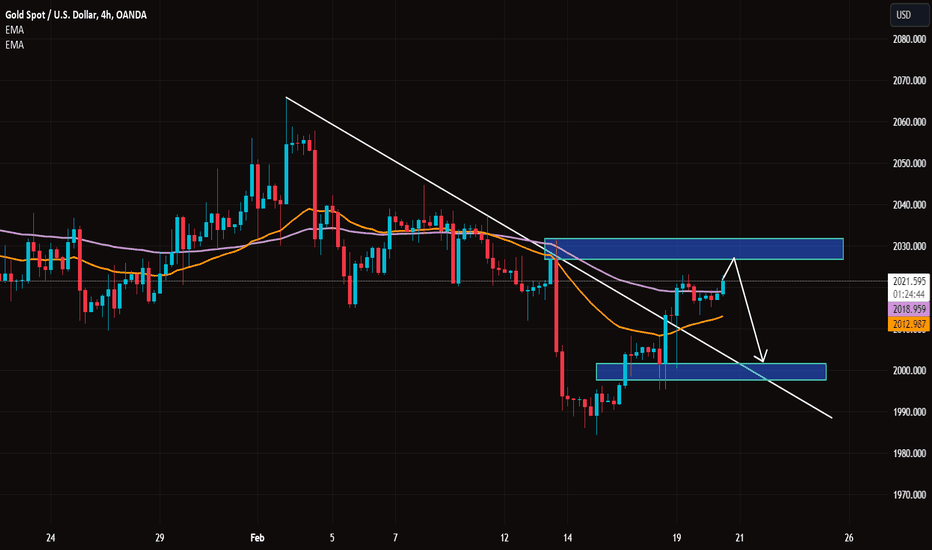
Gold prices fell slightly on Tuesday after pausing a three-day winning streak, easing to near $2,020 an ounce during Asian trading hours. The non-ferrous metal's price has been challenged by a strengthening US dollar (USD), possibly due to higher US bond yields. This rise in bond yields has put downward pressure on prices for non-yielding assets such as Gold.

TradingForecast_Signals
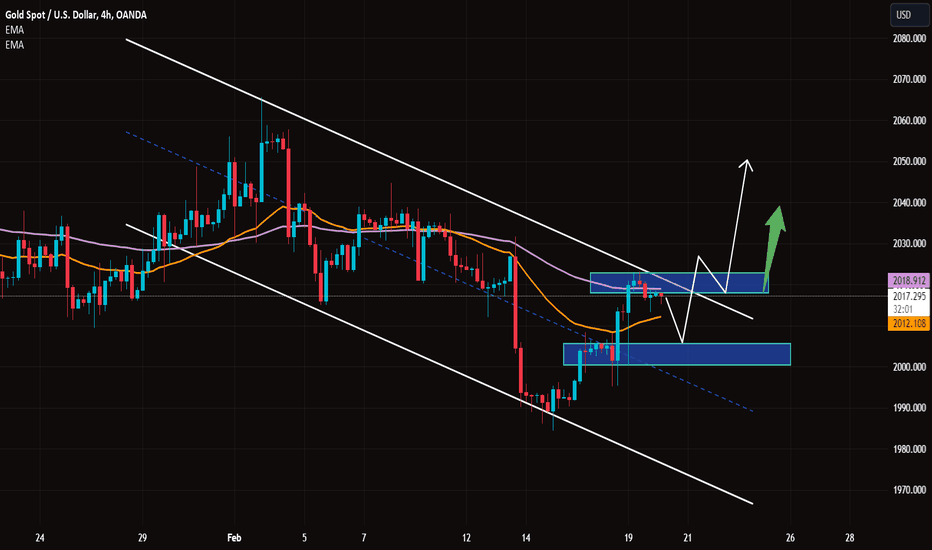
Hello everyone. To start off today's trading session, the price of gold is still within a downward trend, trading around $2016 at the time of writing, with no significant fluctuations compared to yesterday's trading session. Gold prices are benefiting from the decline of the US dollar and the escalating tensions in the Middle East. In the short term, the gold market may see an increase in prices as the Chinese market reopens and traders anticipate higher gold prices in the near future.

TradingForecast_Signals
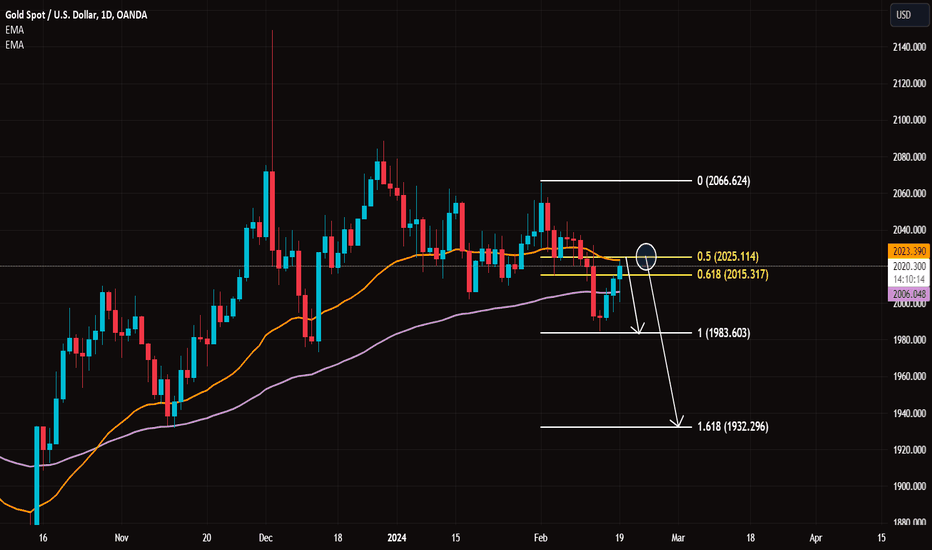
Welcome to a new week of promising and productive trading! Looking back at the previous week, gold demonstrated its strength by trading predominantly in the green. It was an impressive move from the bullish side, as they not only successfully defended the key support level at $1985 but also pushed the price of gold higher from this point onwards. However, the price of gold will react to various economic reports until there is clear information regarding a potential interest rate cut by the Fed. Based on the current picture, it is likely that gold will retrace back to the key support level of $1983 once again. On the other hand, if a breakthrough occurs and surpasses this support level, it will quickly move towards the final Fibonacci key resistance of $1932, indicating expectations of a recovery starting from there.

TradingForecast_Signals
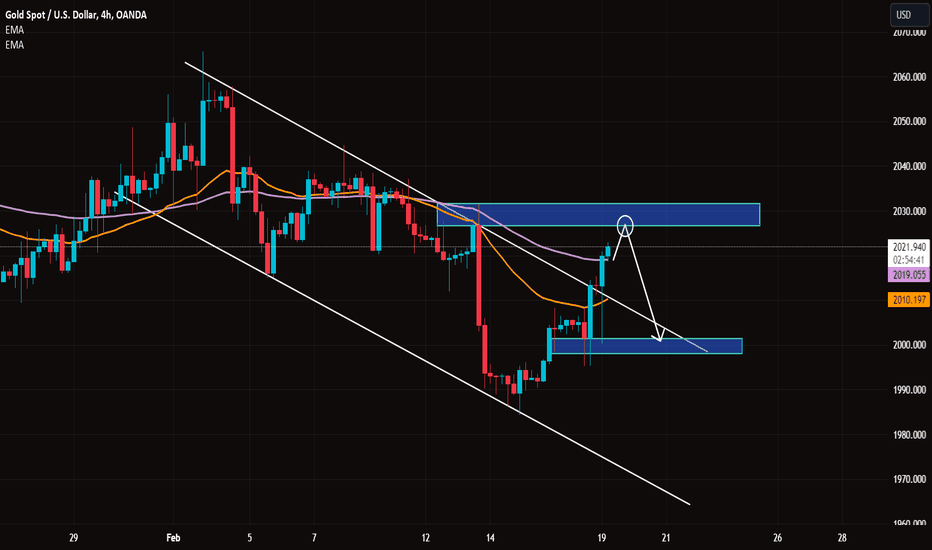
Dear readers, at the beginning of the new trading week, gold has clearly broken out of its previous downward trend channel. Currently, the price of gold is trading at $2022, marking a 0.44% increase for the day. However, many analysts are predicting a short-term decline in the price of gold. On another note, after the monetary policy meeting and comments from Fed Chairman Powell, it seems likely that the Fed will maintain a "higher rates for longer" stance. As a result, the possibility of a rate cut in March has been ruled out. Powell believes that the meeting minutes could pose a risk to gold as they may reveal or reinforce the hawkish stance that the Fed is pursuing, thereby strengthening the downward momentum of gold.
Disclaimer
Any content and materials included in Sahmeto's website and official communication channels are a compilation of personal opinions and analyses and are not binding. They do not constitute any recommendation for buying, selling, entering or exiting the stock market and cryptocurrency market. Also, all news and analyses included in the website and channels are merely republished information from official and unofficial domestic and foreign sources, and it is obvious that users of the said content are responsible for following up and ensuring the authenticity and accuracy of the materials. Therefore, while disclaiming responsibility, it is declared that the responsibility for any decision-making, action, and potential profit and loss in the capital market and cryptocurrency market lies with the trader.