TradingChimp503
@t_TradingChimp503
What symbols does the trader recommend buying?
Purchase History
پیام های تریدر
Filter
Signal Type

TradingChimp503
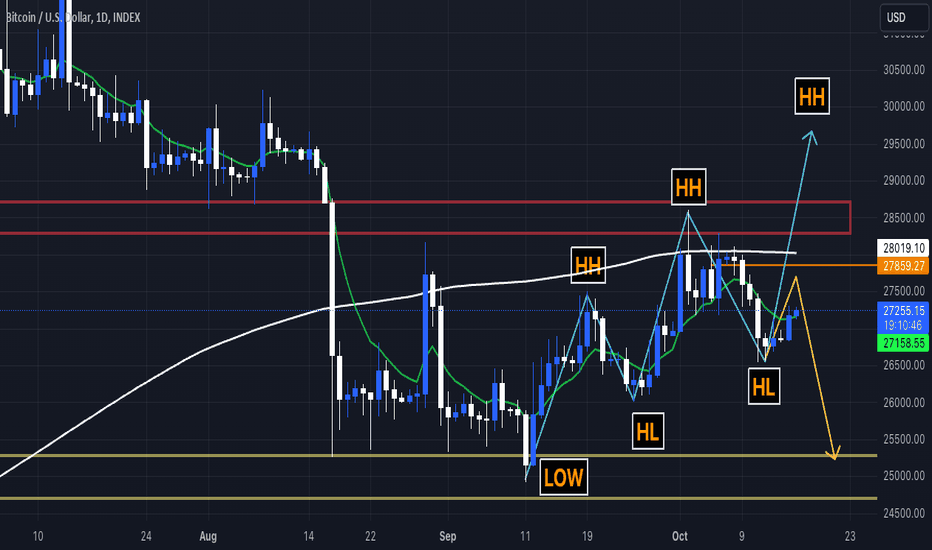
MA200 Resistance Challenge and Decline: Starting from the 9th of October, the price of Bitcoin began to decline after encountering resistance at the MA200. This marked a significant challenge as Bitcoin struggled to break and close above the MA200 during the period from October 1st through October 9th. Hopeful Spring: Despite the MA200 resistance, there's a glimmer of hope in the recent price action. On September 11th, we experienced a significant drop, briefly falling below $25,000. However, in a notable spring-like move, the price swiftly rebounded back above the $25,000 level. This marked a critical low and a strong spring, an essential concept in technical analysis. Higher Highs and Lows: Bitcoin then embarked on an upward trajectory, making a higher high above the MA200. The price pulled back but established another higher low at $26,500, showcasing its upward momentum. Two Possible Scenarios: The current situation presents two distinct scenarios: Bullish Scenario: The price respects this higher low and manages to break above the MA200 and the $28,000 resistance, forming a higher high. This would be a bullish sign. Bearish Scenario: However, there's also a bearish possibility. The price structure resembles a potential head and shoulders pattern. An MA200 rejection or a drop below the previous shoulder's level at $27,500 could trigger a decline, testing support at either $26,000 or even $25,000.

TradingChimp503
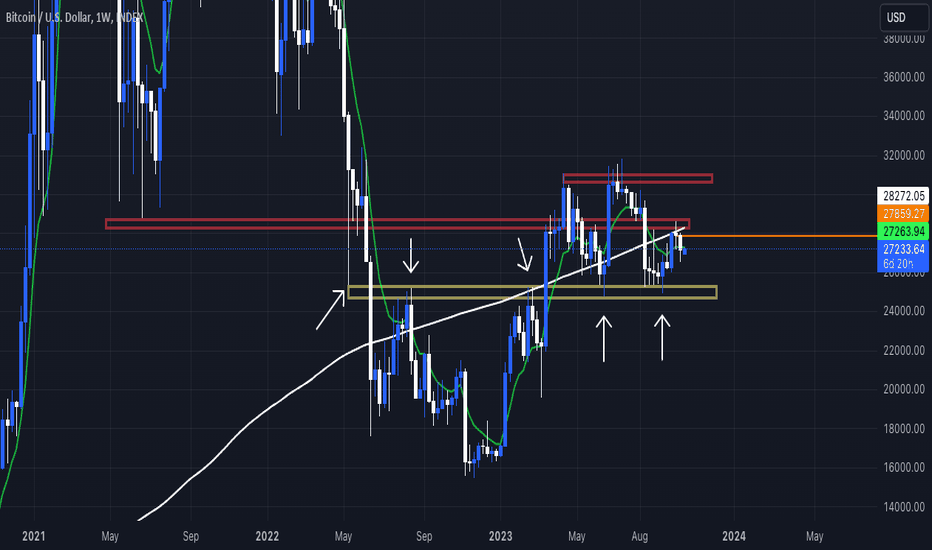
**Bitcoin Weekly Chart Observations:** Support: 💪 Strong key support at $25,000, a level frequently tested as both support and resistance. Resistance: 🛑 The primary resistance factor is currently the MA200, situated at approximately $28,300 on the weekly chart. MA200: 📉 We've observed a failure to close above the MA200 last week, leading to continued trading below it. This is a crucial resistance that needs to be overcome. EMA8: 🚀 Our shorter timeframe indicator, the EMA8, presents a challenge. We closed below it in the previous two weeks, emphasizing the importance of regaining momentum and trading above it. A goal for this week is to close above the EMA8, around $27,500. Bollinger Bands: 🌀 The weekly Bollinger Bands don't provide extensive guidance as we remain below the MA20. A potential breakthrough above the MA20 would likely lead to closing above the MA200, a critical milestone. "Please remember that this content is shared for informational purposes only and should not be considered financial advice. It's essential for everyone to conduct their research (DYOR) before making any investment decisions, especially given the inherent volatility of the cryptocurrency market." 🚀💰 #Cryptocurrency #Bitcoin #DYOR

TradingChimp503
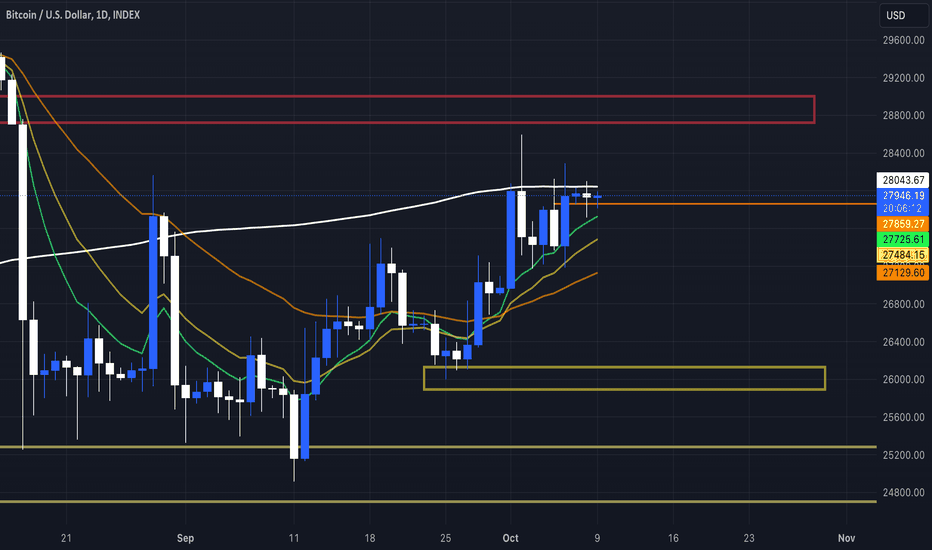
Current Price: 💲 $27,900 Local Resistance: 💪💲 $28,000 Key Support: 🛡️💲 $26,000 Moving Averages: 📊 Weekly MA200: Bitcoin continues to struggle below the MA200 at $28,000, making it a crucial resistance level. Daily MA200: This aligns with the Weekly MA200, emphasizing the importance of closing above it, especially before considering a move toward $30,000. Exponential Moving Averages (EMA): 📈 Weekly EMA 8, 14, & 34: These indicators are tightening, and a close above $27,500 is essential to prevent a downturn. Bollinger Bands (BB): 🌀 Weekly BB: MA20 and MA200 act as resistance. Contraction is observed, and a potential expansion might be on the horizon. Daily BB: The upper band and MA200 are currently in confluence, creating resistance. Key Areas to Watch: 👀 Resistance: 💪💲 $28,000 (Determined by MA200) Support: 🛡️💲 $26,000 (Identified as the most recent higher low) Conclusion: Bitcoin faces significant resistance at $28,000, particularly from the MA200 on both daily and weekly charts. This resistance level is crucial in the analysis. While there's cautious optimism due to the strong support at $25,000, there's also wariness regarding the persistent challenge posed by the MA200 resistance. It's essential to prepare for various breakout scenarios and monitor developments closely. Risk Disclaimer: This content is provided for informational purposes only and should not be considered financial advice. It is crucial for everyone to conduct their research (DYOR) before investing their money, as cryptocurrencies are known for their volatility and the potential for substantial losses.

TradingChimp503
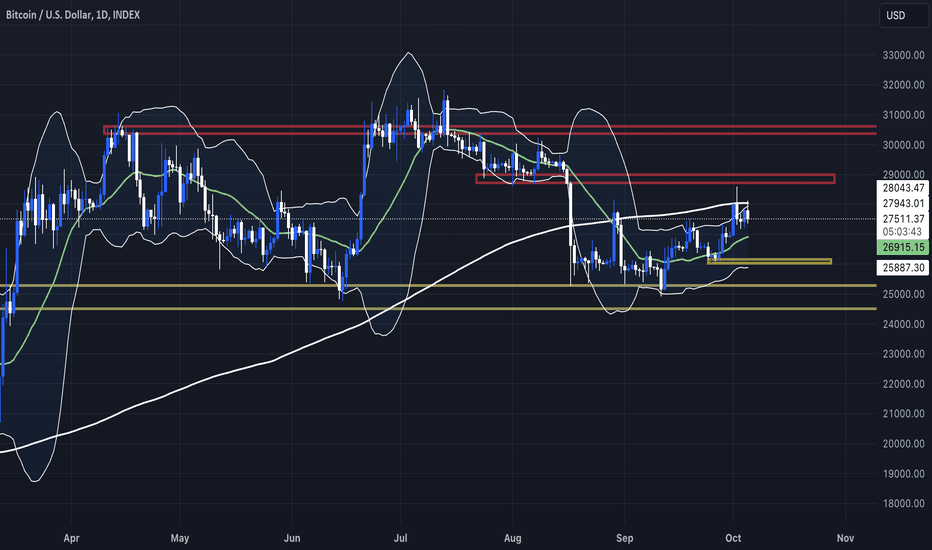
BTC/USD Index Oct 5, 2023 Current Price: 💲 27,489 Local Resistance: 💪💲 29,000 Key Support: 🛡️💲 26,000 Moving Averages: 📊 Weekly MA200: After briefly recovering, we've seen the MA200 serve as resistance for the past 7 weeks. To regain bullish momentum, we need to close above $28K. Daily MA200: It aligns with the Weekly MA200. Breaking above this moving average is crucial before considering a move toward $30K. Exponential Moving Averages (EMA): 📈 Weekly EMA 8, 14, & 34: These indicators are tightly grouped and leveling out after rejection at $31K. It's imperative to maintain a close above $27.5K to prevent a downturn. Daily EMA 8, 14, & 34: Over the past week, we've been oscillating between EMA 8 and MA 200. Bulls are eyeing a break above MA 200, aiming for a close above $28K. Bollinger Bands (BB): 🌀 Weekly BB: Both MA20 and MA200 are acting as resistance after BTC bounced from the lower Bollinger band. While the bands may constrict further, we observe reduced volatility. Daily BB: The upper band and MA200 are in confluence, creating resistance. Key Areas to Watch: 👀 Resistance: 💪💲 $28,000 Support: 🛡️💲 26,000 Conclusion: Significant resistance lies at $28K, including the daily and weekly MA200, upper Bollinger band, and a key horizontal area. Achieving daily candle closures above $28K is essential to entertain the possibility of reaching 31K before the year ends. Risk Disclaimer: This content is provided for informational purposes only and should not be considered financial advice. It is crucial for everyone to conduct their research (DYOR) before investing their money, as cryptocurrencies are known for their volatility and the potential for substantial losses.

TradingChimp503
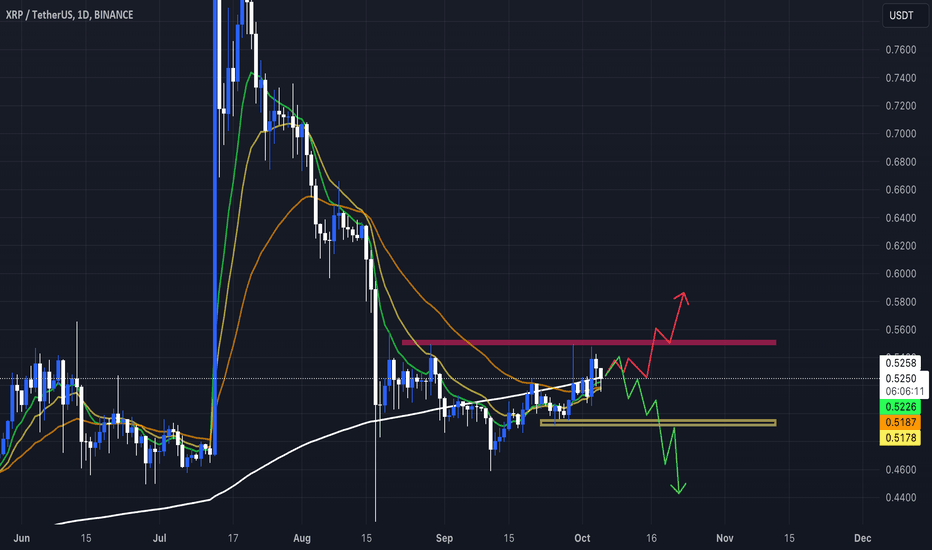
XRP/USDT Binance Weekly Analysis by TradingChimp503 📈 Current Price: 💲0.5237 Local Resistance: 💪💲0.55 (based on candle wicks for the current week and previous week) Key Support: 🛡️💲0.49 (important for psychological support and the previous week's low) Moving Averages: 📊 Weekly MA200: The price hasn't closed above it in the last 5 weeks, and last week it closed right at the MA200's underside. A close above the MA200 is needed for bullish momentum. 🐃 Daily MA200: The daily closing needs to be above 💲0.5260 to mark the third day above MA200. A higher close is desired for strong momentum. 🚀 Exponential Moving Averages (EMA): 📈 Weekly EMA 8, 14, & 34: Currently sideways, but the daily EMA is indicating a bullish crossover. Closing above resistance is crucial for upward momentum. 📈 Bollinger Bands (BB): 🌀 Weekly BB: At MA20 support after a rejection at the top Bollinger. Holding this support is vital for another attempt at the top band. 📈 Daily BB: Still relatively tight and approaching the upper Bollinger. Anything above 💲0.54 is above the upper BB. 🚀 Key Areas to Watch: 👀 Resistance: 💪💲0.55 Support: 🛡️💲0.49

TradingChimp503
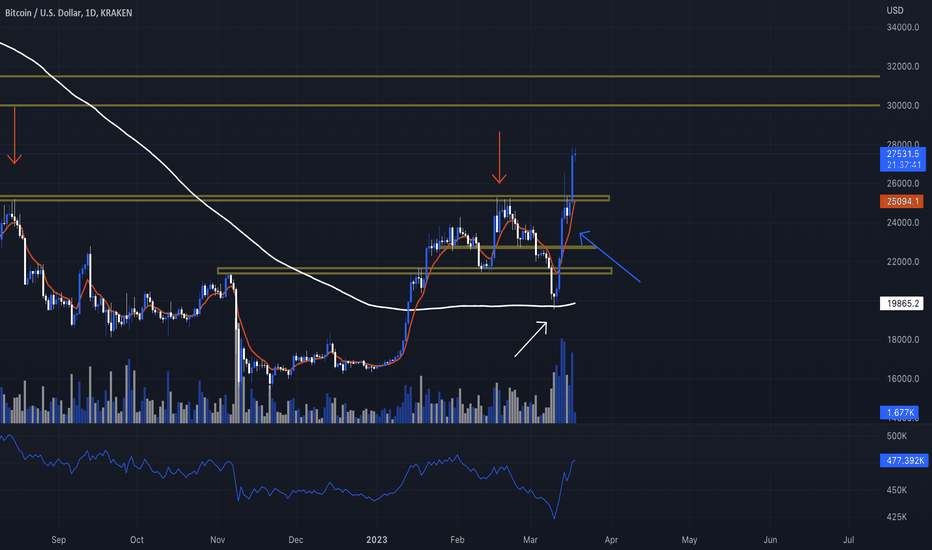
As we've cleared and closed with good volume above resistance at $27,450. So now its important to identify our next levels of interest. BTC must hold $25,500 as support, this is key in many ways. 1) To keep up the stair-step concept and keep up the momentum. 2) Re-validate $25.500 as a long term key level for BTC 3)To push whales and institutions to buy higher 4) we want BTC to respect EMA8 support as that means lots of steam. EMA8 is above $25.500 As of now, I will follow my trade using a manual trail stop order.

TradingChimp503
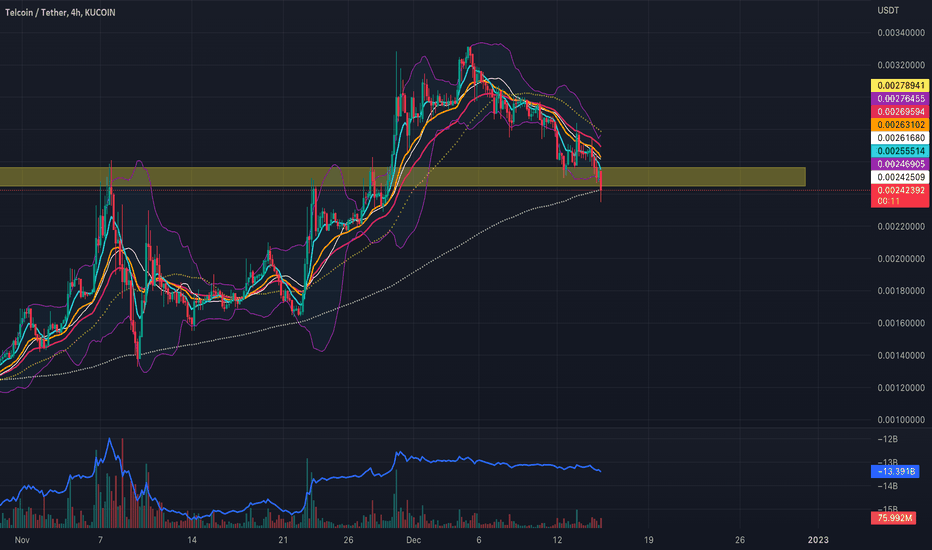
TEL/USDT reclaimed the MA200 at the beginning of November.. It has made a series of higher highs and is not possibly looking to set a higher low

TradingChimp503

TradingChimp503

TradingChimp503
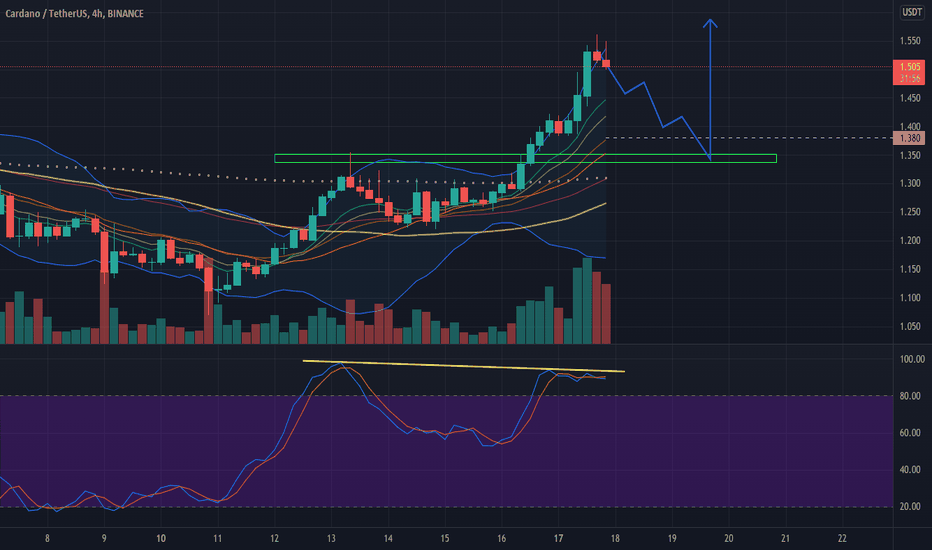
Very key level $1.50 Extremely wide bollinger bands. Price at the top band Inverted hammer, with a second one forming recent 40%+ move bearish divergence pretty high volume on inverted hammers Looking to go long at the test of $1.30 - $1.35 zone
Disclaimer
Any content and materials included in Sahmeto's website and official communication channels are a compilation of personal opinions and analyses and are not binding. They do not constitute any recommendation for buying, selling, entering or exiting the stock market and cryptocurrency market. Also, all news and analyses included in the website and channels are merely republished information from official and unofficial domestic and foreign sources, and it is obvious that users of the said content are responsible for following up and ensuring the authenticity and accuracy of the materials. Therefore, while disclaiming responsibility, it is declared that the responsibility for any decision-making, action, and potential profit and loss in the capital market and cryptocurrency market lies with the trader.
