
TraderTilki
@t_TraderTilki
What symbols does the trader recommend buying?
Purchase History
پیام های تریدر
Filter
Signal Type

TraderTilki
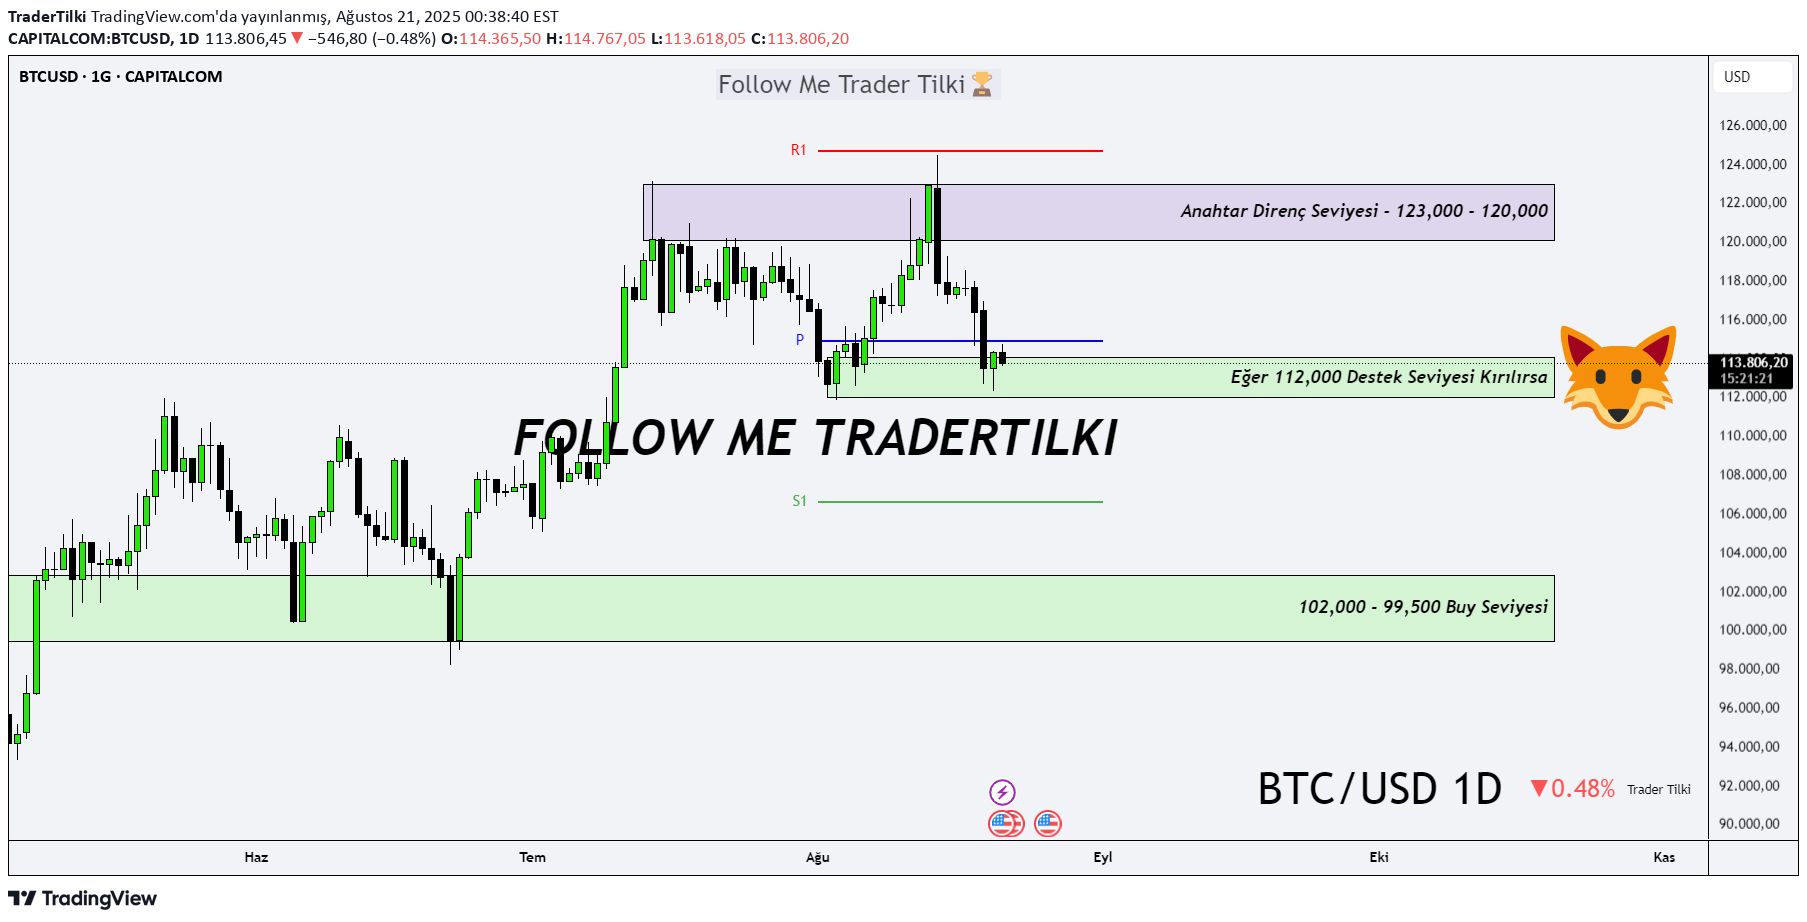
My friends good morning, I have prepared a new Bitcoin analysis for you. 🔹 I am behind my long -term targets ** 127,000 - 137,000 - 146,000 **. I have shared these goals with you within the scope of 1 week analysis. 🔍 Now let's return to 1 -day graphic structure: Bitcoin What does it say to us in the daily graph right now? 📉 If ** If the 112,000 level breaks down, the price will be able to enter a correction process up to the levels of the price ** 102,000 ** and even ** 99,500 **. After this correction, I expect strong purchases to come from the ** 102,000 or 99,500 ** levels. 📈 Then there is a critical resistance zone that should be considered: ** There is a significant resistance structure between 123,000 - 120,000 **. 💬 But I think this region will be broken. Because we are in a rising trend **. ** The trend is our friend ** - Never forget it. Every likes, my biggest source of motivation to share these analyzes with you. Thank you to everyone who supported 🙏

TraderTilki
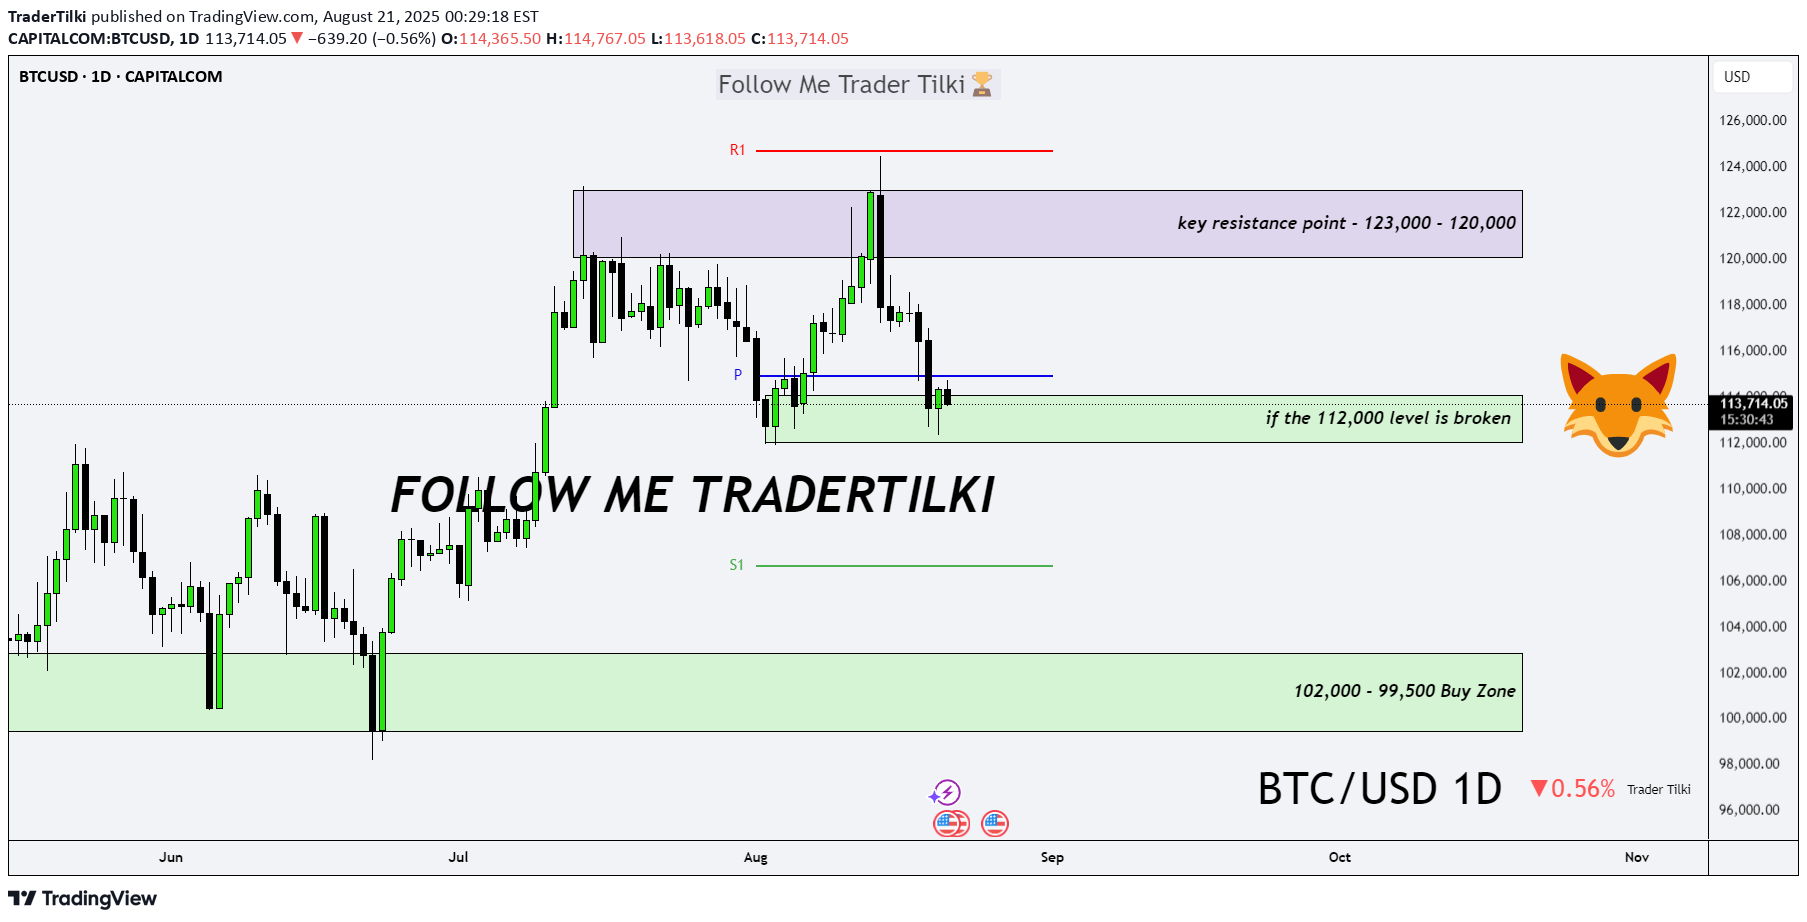
Good morning, Guys, I’ve prepared a fresh Bitcoin analysis for you. 🔹 First off, I stand firmly behind my long-term targets of **127,000 – 137,000 – 146,000**. I previously shared these levels with you in a weekly analysis. 🔍 Now let’s shift to the 1-day chart: What is Bitcoin telling us right now? 📉 If the **112,000 level breaks downward**, we could enter a correction phase toward **102,000** or even **99,500**. I expect strong buying interest to return from those zones. 📈 After that, we’re facing a key resistance structure between **123,000 – 120,000**. But I believe this zone will also be broken—because we’re in an **uptrend**, and… 💬 **The trend is our friend. Never forget that.**Every single like you send is my biggest source of motivation to keep sharing these insights. Huge thanks to everyone supporting me 🙏Hey guys; "Bitcoin just gave a solid bounce off my $112,000 support level. We’ve already seen a push up to $116,600 from that zone. But here’s the key: in 5 hours and 45 minutes, we’ve got a candle close coming up—and it needs to land in a strong spot. Never forget, candle closes are everything in this game. Big thanks to everyone showing love with the likes. We’re a family here—don’t ever forget that. Much love to you all."

TraderTilki
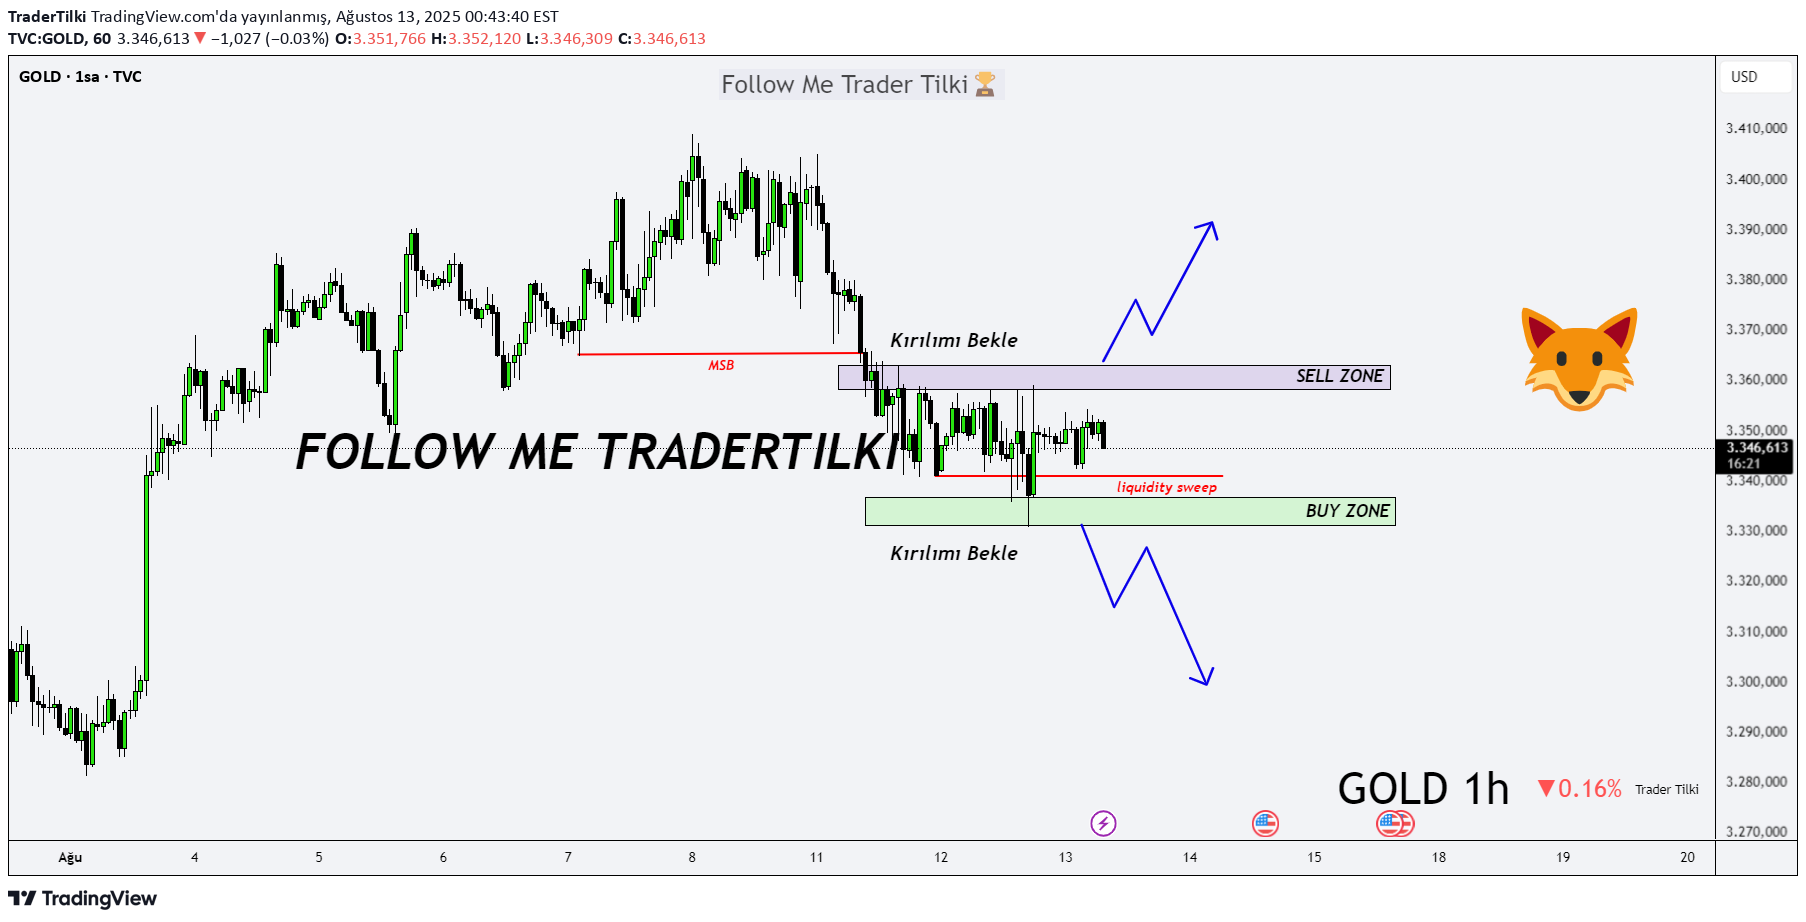
My friends good morning, Gold is currently following a horizontal course. Let me tell you: If the gold goes above the 3363 level and closes the candle, its target will have 3380 or 3390 levels. If gold performs this frustration with a candle closing below 3330, its target will be 3310 or 3300. Currently gold is stuck; Bulls and bears are fighting a great war among themselves. Let's see who will win, who will put the last point in this race, we will see together. My friends, every appreciation from you is my biggest source of motivation in sharing analysis. I would like to thank everyone who liked it.

TraderTilki
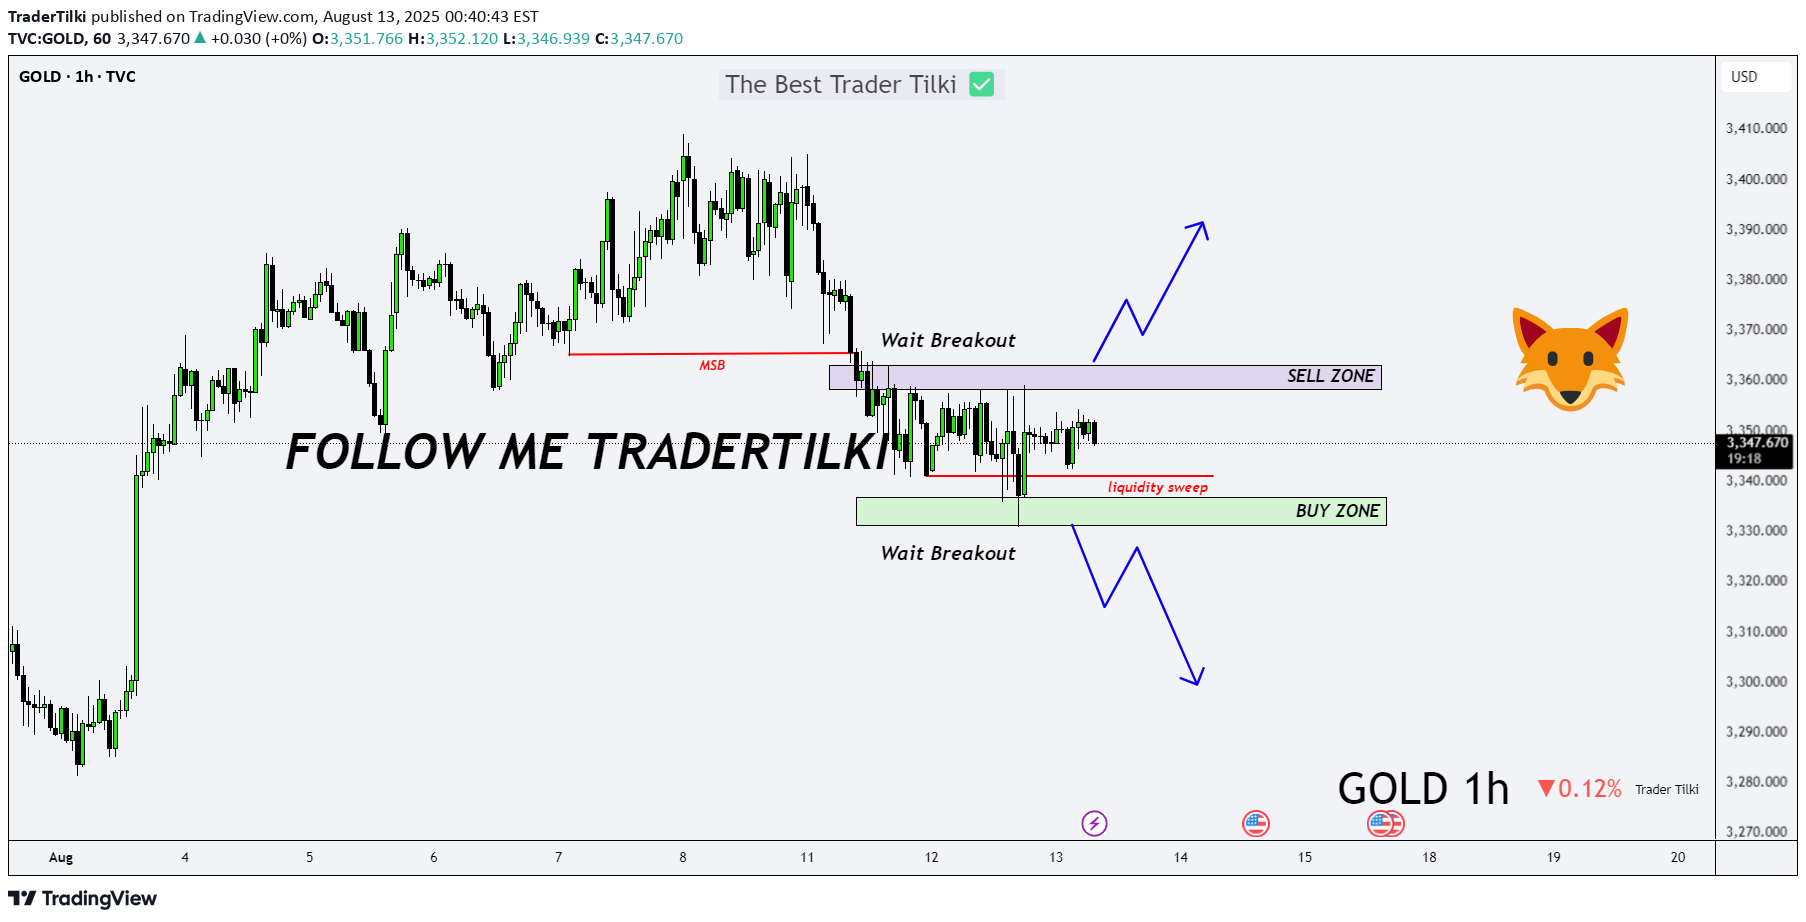
Good morning, my friends, Gold is currently moving sideways. Let me tell you this: if gold breaks above the 3363 level and closes a candle there, the next target will be 3380 or even 3390. However, if gold breaks below 3330 with a candle close, then the target will shift to 3310 or 3300. Right now, gold is in a tight squeeze — bulls and bears are battling it out. Let’s see who wins and who puts the final stamp on this move. We’ll all witness it together. My friends, every single like you send is my biggest source of motivation to keep sharing these analyses. Thank you so much to everyone who supports me with a like.Gold tends to break hard in one direction when it’s this compressed. Whether that move is up or down—only the whales truly know. We can make educated guesses, sure, but the ones steering this market are the big banks and central banks. The key is to trade *with* them—not against them. Buy when they buy, sell when they sell. That’s how we keep our profits high and our losses low. Only then can we call ourselves successful. Much respect and love. 💛There’s been a bullish breakout in gold. It’s not exactly the kind of move I was hoping for, but it looks like the first level it’ll test now is around 3374.I successfully reached my target of 3374.From a fundamental standpoint, U.S. data came in stronger than expected. In light of this development, downside pressure on gold may increase. If XAUUSD drops below the 3340 level, it will likely attempt to test the 3320 level.📉 Gold Update – Technical Meets Fundamental Hey Guys, in my last update I said: “If gold dips below 3340, it’ll likely want to test the 3320 level.” Well, today it tapped 3323. Another solid call, another win. Grateful as always—praise be to the Almighty. And remember: this game isn’t just about lines and levels. Fundamentals matter just as much.✅ 3310 Target Achieved — Power of Discipline! My friends, remember what I said? “If we see a candle close below 3330, my target is 3310 and 3300.” Today, 3310 was hit. Precise, patient, and perfectly executed. 📌 Every like you send fuels my discipline. Thank you to everyone who supports me. 💬 If you have a coach who knows how to guide with clarity, this game becomes child’s play. This isn’t luck — it’s the reward of sticking to the plan.

TraderTilki
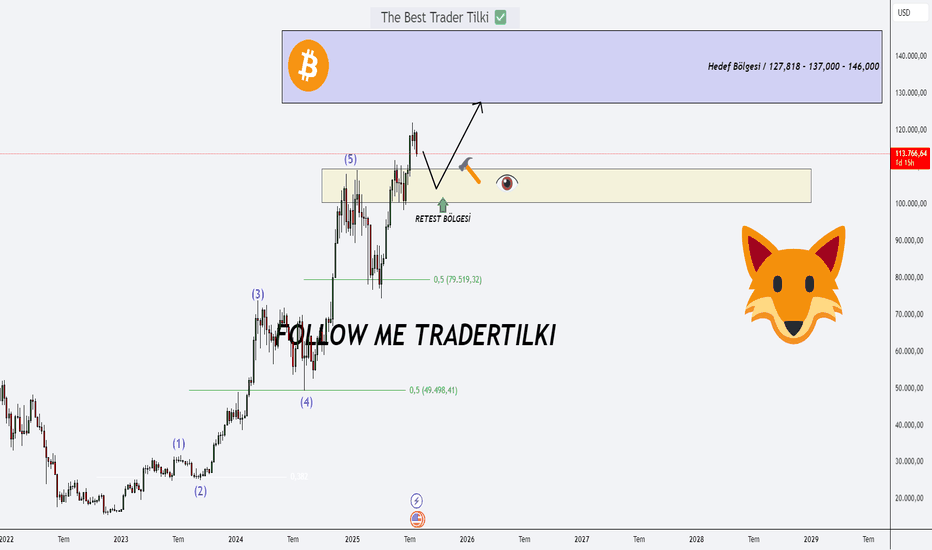
Dear friends, Hello Previously, Bitcoin He could not break the range of 112,331 - 105,344 for a long time. But these levels are now exceeded. What does this mean? This range, which used to be resistance in the past, will now serve as a support. According to this, my long -term target levels in Bitcoin compared to my 1 -week trade model: 127,818 - 137,000 - 146,000. Since this is a one -week trade model, it may take time for him to achieve goals. Even if the price is withdrawn to 105 thousand and 105,000 levels with 112 thousand, I expect that reaction purchases will come from this region. I will continue to transfer updates with you regularly about this Bitcoin analysis. I sincerely thank everyone who supported my analysis. Your support is my biggest source of motivation to produce content. I love you. Good thing you exist.

TraderTilki
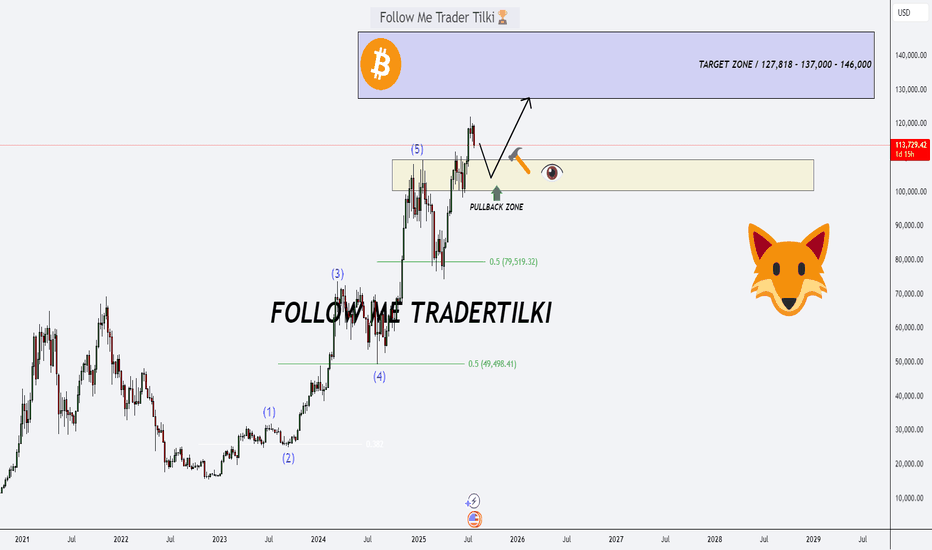
Hey Dear Friends, Until recently, Bitcoin had been stuck in a range between 112,331 and 105,344 for quite some time. But that range has now been clearly broken. So, what does this mean? This zone, which used to act as resistance, is now expected to flip and act as support. According to my weekly trading model, the long-term target levels I’m tracking for Bitcoin are: 127,818 – 137,000 – 146,000. Since this is a weekly setup, it might take a while for these targets to play out. Even if we see pullbacks to the 112K, 105K, or even 100K levels, I expect to see strong buying pressure from that zone. I’ll keep sharing regular updates as this setup develops. To everyone who’s been supporting and appreciating my work—thank you, truly. Your encouragement means the world to me and keeps me motivated to keep showing up. Much love to all of you—I’m grateful we’re in this journey together.Good morning, my friends ☀️ When I first shared my Bitcoin analysis, the price was dropping. But I told you clearly: 112,000 – 105,000, even down to 100,000 were strong buying zones. And just as predicted, buyers stepped in right at 112,000, and now we’ve climbed all the way to 123,000 dollars. Another solid analysis in the books—grateful to God for the clarity. Now I’m patiently waiting for my next target at 127,000. 📈 My friends, it’s your likes that keep these analyses coming. Your support is my biggest motivation to keep sharing. Huge thanks to everyone who’s been showing love 🙏 Here’s to many more successful calls together! 🚀📢 Today, the U.S. PPI (Producer Price Index) data will be released. This is a highly significant macroeconomic indicator for the markets. 📊 Friends, I don’t rely solely on technical lines. I combine both technical and fundamental analysis in my approach—meaning I pay close attention to news releases, economic data, and price behavior together.Big players who move the market really keep an eye on U.S. economic news, especially when it comes to the dollar.

TraderTilki
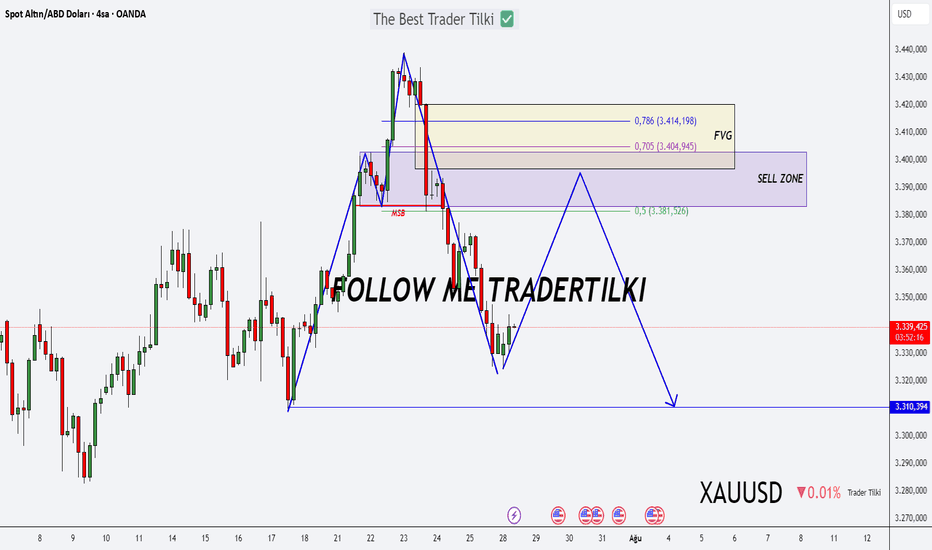
My friends, good morning 🌞 I have prepared gold analysis for you. I am waiting for a decline underneath; I expect that this decline will start at the levels of 3,383–3.420. When the correction starts in this tape, my target will be the 3.310 level. Gold is moving in a long -time rising trend. When I come to the levels I mentioned, I expect such a correction and I plan to open a Sell process in these regions. I recommend you to determine your stop level according to your own margin. My friends, every appreciation from you, my biggest source of motivation to share these analyzes with you. Thank you to everyone who supported. If the break occurs, a decrease to the level of 3278 can be expected. Wait for the breakdown to take place. Since breaking: +4.815 Pip. It's not a coincidence, the noise is not at all. Strategy + patience = domination. Followers are now enjoyable, others? He's just watching history. #Xauusd #Forex #trader

TraderTilki
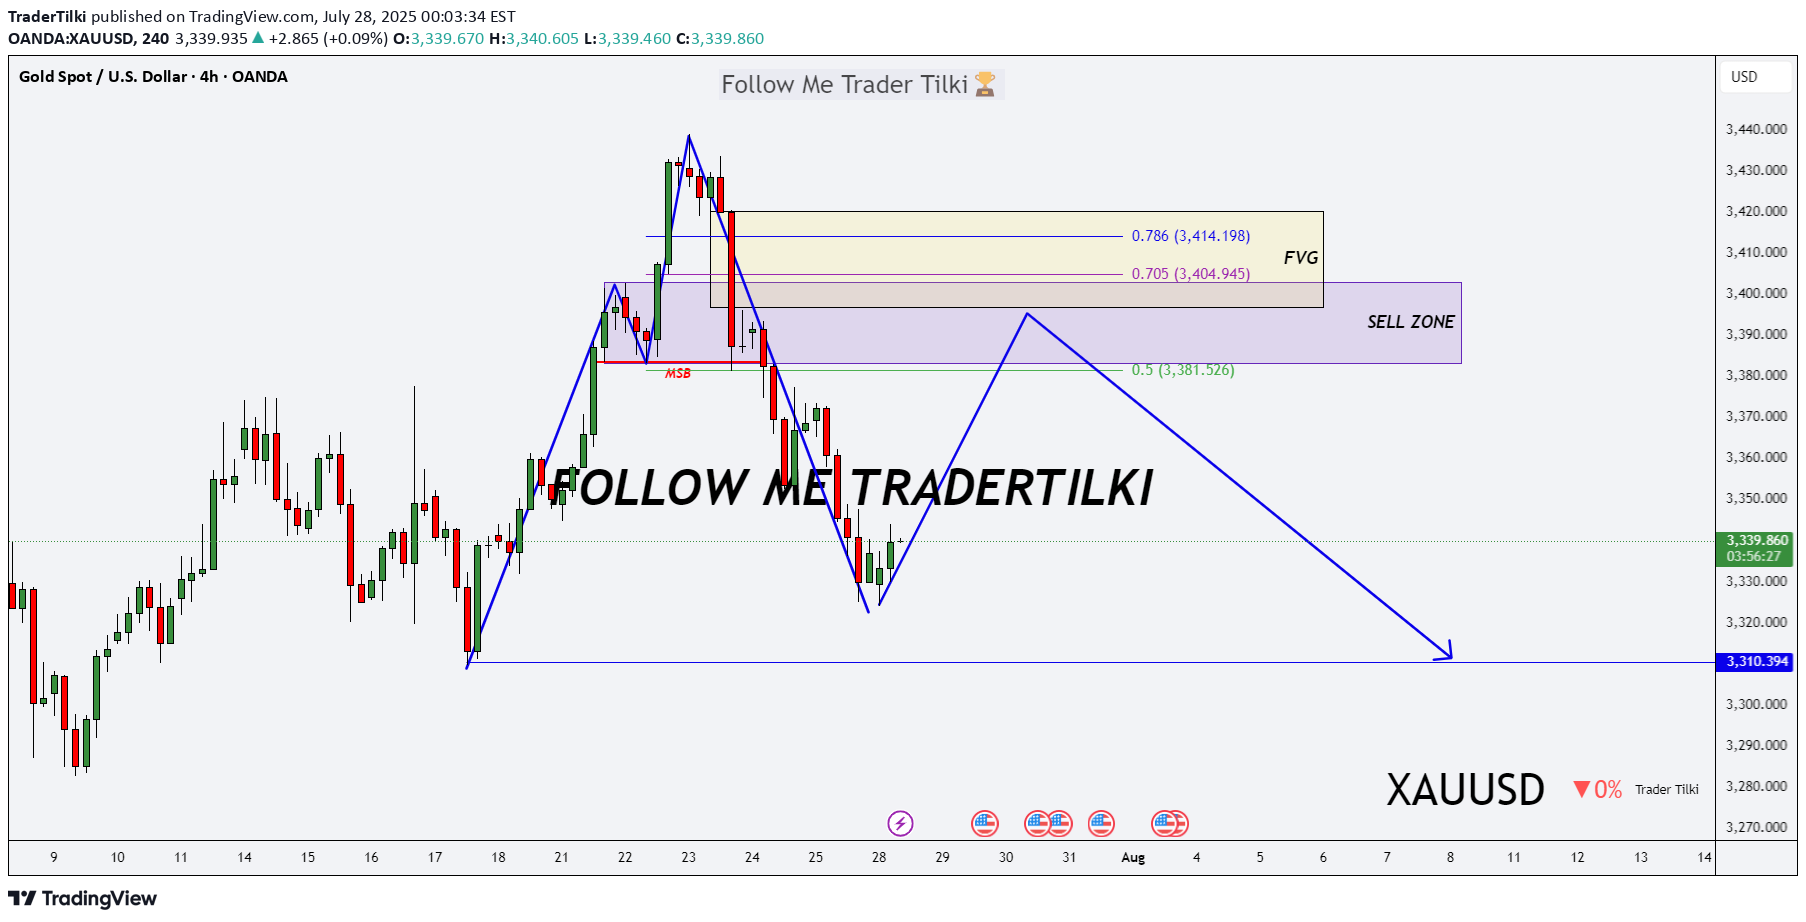
Good morning, my friends 🌞 Here’s today’s gold analysis. I'm expecting a decline in gold prices, specifically from the 3,383–3,420 level. Once a correction starts around that zone, my target will be 3,310. Gold has been riding a strong uptrend, and if we reach those levels, I’ll be expecting a pullback and opening a sell position accordingly. Please set your stop loss based on your personal margin preferences. Your likes and support are my biggest motivation for continuing to share these analyses. Thank you to everyone showing appreciation 🙏Good morning. If a breakdown occurs, gold could drop as low as 3278. Wait for confirmation of the break.💥 Gold smashed my 3278 target—precision trading at its finest. Since the breakout: +4,815 pips. No flukes. No noise. Strategy + patience = domination. The ones who followed are smiling. The rest? Just watching history. #XAUUSD #Forex #SignalByTraderTilki #GoldGang

TraderTilki
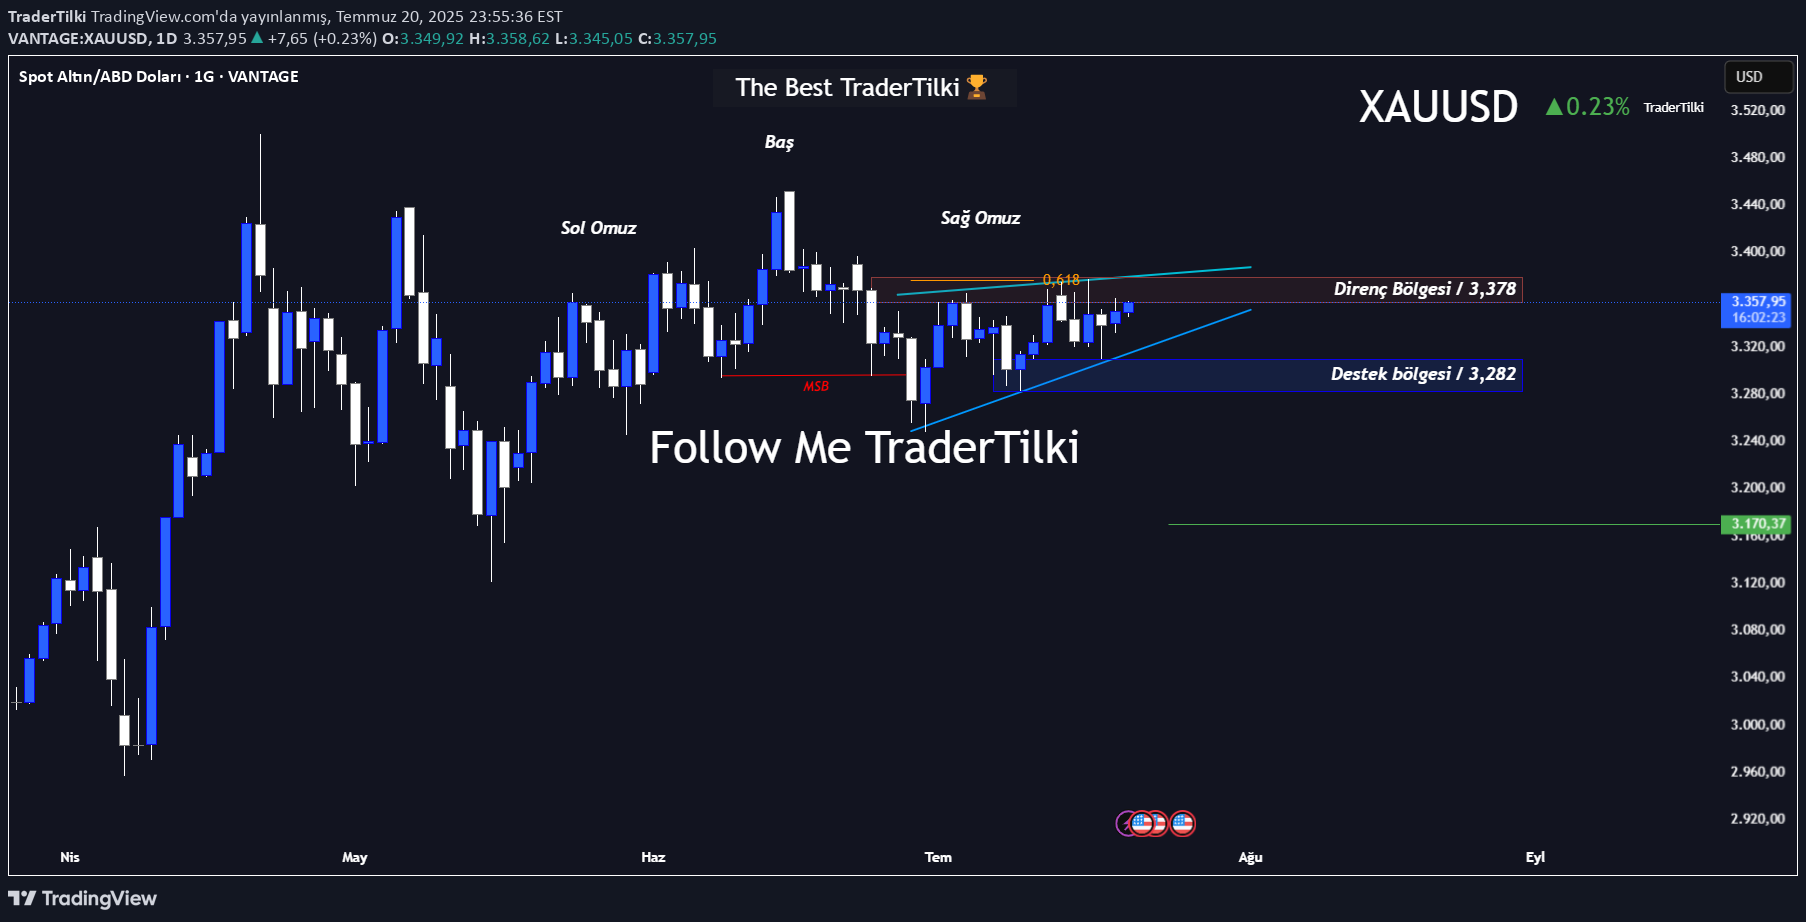
Good morning my friends, Let's see what gold describes in the 1 -day graph: - ** Resistance: ** 3,378 - ** Support: ** 3,282 - A ** shoulder - head - formation ** is available on the graph. Normally the target level of gold ** 3,170 **. Gold is highly affected by the basic analysis factors. For example; It can cause fluctuations under the sudden war news or the rumor of Trump's Fed president last week. Therefore, I do my analysis with both technical and basic analysis ** combination. In order for gold to reach its 3,170 target, it is necessary to break the 3,282 support level **. However, since this break has not yet realized, we cannot say that the decrease - the basis of the compassionate factors play a critical role here. Let's not forget, this analysis is ** Swing Trade ** model; It may take time to reach this goal. My friends, every appreciation from you is my biggest source of motivation to share my analysis. I would like to thank everyone who supports and likes. I love you, regards.💛

TraderTilki
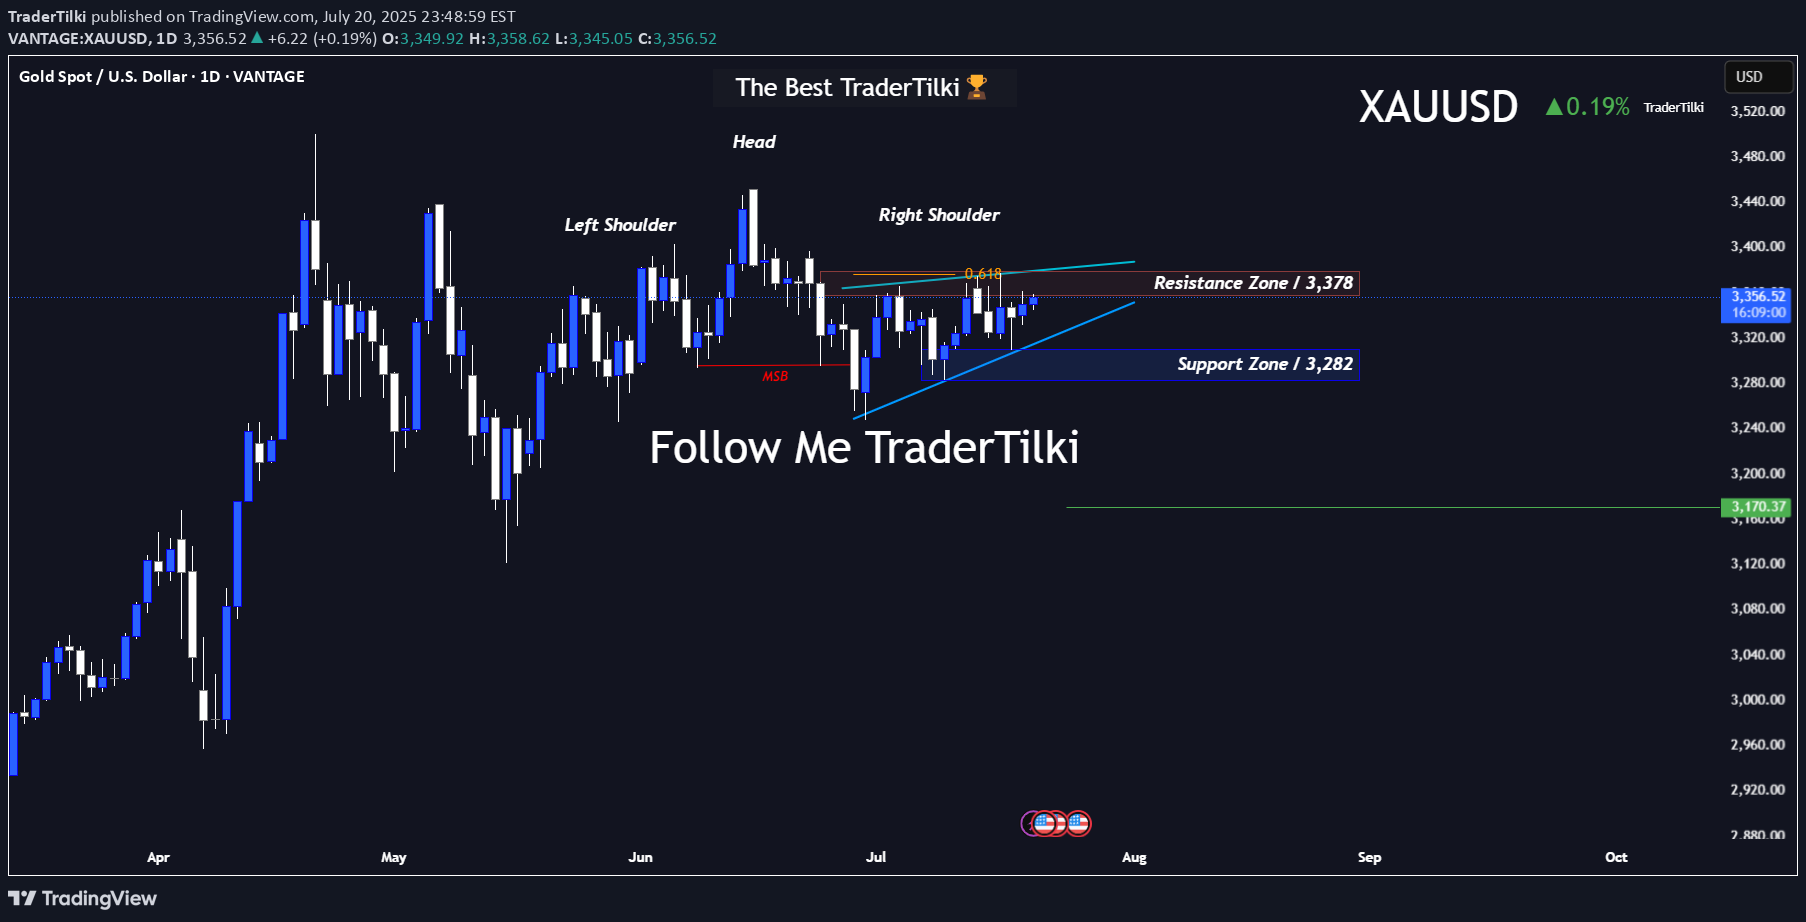
Good Morning Traders, Let’s break down what gold is showing us on the 1-day chart: - **Resistance:** 3,378 - **Support:** 3,282 - There’s a noticeable **head and shoulders pattern** on the chart. Under normal conditions, gold’s target sits at **3,170**. Gold is highly sensitive to fundamental factors. Sudden war news or events like last week’s rumors about Trump firing the Fed Chair can trigger serious volatility. That’s why I always combine **technical and fundamental analysis** in my approach. For gold to reach the 3,170 target, the **3,282 support level must first be broken**. Since that hasn't happened yet, we can't confirm a bearish move—fundamentals play a key role here. Keep in mind: this is a **swing trade** setup based on a 1-day chart. Reaching the target could take time. I want to sincerely thank everyone who’s been supporting my analyses with likes—your support is my biggest source of motivation when it comes to sharing content. Much love and respect to you all.💛
Disclaimer
Any content and materials included in Sahmeto's website and official communication channels are a compilation of personal opinions and analyses and are not binding. They do not constitute any recommendation for buying, selling, entering or exiting the stock market and cryptocurrency market. Also, all news and analyses included in the website and channels are merely republished information from official and unofficial domestic and foreign sources, and it is obvious that users of the said content are responsible for following up and ensuring the authenticity and accuracy of the materials. Therefore, while disclaiming responsibility, it is declared that the responsibility for any decision-making, action, and potential profit and loss in the capital market and cryptocurrency market lies with the trader.