
TradeYourLogic
@t_TradeYourLogic

What symbols does the trader recommend buying?
Purchase History
پیام های تریدر
Filter
TradeYourLogic
WAVES/USDT

Not a financial advice, please do your own research 1D timeframe Buy zones - 1.50$ - 1.54$ Stop loss - 1.48$(if we start making lower lows/change of trend) Targets: - 1.67$ - 1.85$Closed position around 1st target. I will be looking for the possibility to re-buy Profit +6%
TradeYourLogic
KDA/USDT

-- Not a financial advice, please, do your own research -- Finally, we are observing break out of our downward resistance(Falling Wedge, reversal pattern) with some significant volume and multiple RSI divergences. As for now, we need to await and see, how 1W candle gets closed(we still might end up with the fake break out). I have DCAed at different price levels: 0.77$, 0.52$ and hold it for long term If you have missed some recent KDA news and why I personally believe in project: - ledger support - increase of daily transactions volume(which signifies adoption) - constant technical developmentNeed to wait and check how 1W candle gets closed, however as for now, most probably, 0.3$ is incoming invalidation, if 1W gets closed above 0.52$4H time frame, we have a Falling Wedge pattern. If we break it out upward, then we can potentially see 0.51$ area, which at the same time will form Double Bottom pattern with the target around 0.6$As for now, Falling Wedge is in play on 4H timeframe and we also have a Double Bottom on 1D timeframe, in order to proceed, we need to break 0.51-0.53$ resistance area and retest it after P.S. I hold KDA for long term, as it is like ETH in 2015(not a financial advice, DYOR)3D timeframe, Double Bottom with the target 0.66-0.7$, if we break it and reach out target zone, then we can expect a re-test of our demand zone around 0.55$ and we should hold it in order to continue to growWaiting for 1W candle to get closed. As for now, price is 0.518$, per 12H timeframe I can observe some accumulation. Not a financial advise but there might be a pump soon up to 0.7$(daily 200MA zone)Short Update: if we break our 0.5$ support zone, we can dive to our support area at around 0.45$ P.S. I am holding it long term and I am accumulating, not sellingPrice dropped with significant volume probably due to the hacker, who stole it from CoinEx P.S. I keep holding and accumulatingBasically we are currently in our Triangle pattern and at our local support zone(0.48$). It will be amusing if we pump from here after this fuel(massive sell orders)As for now. in order to proceed with our uptrend we need to break and stay above 0.51$, otherwise we can go to 0.45$If we can't hold 0.47$ support, then we can drop to at least 0.45$. Additionally, if BTC decides to get dropped, we might see 0.3$ on KDA P.S as I mentioned before, I hold long term, only accumulate(solid tech project, decent team)Short update: As long as we hold 0.45-0.46$ level - we are fine(accumulation). As soon as we break and retest 0.54$ level - we can potentially visit 0.7$Please, like and subscribe as it motivates me to post more ideasSometimes simple "waiting" is the complexest thing. Patiently waiting until we break and successfully retest 0.54$Short Update: If we are not able to restore 0.475$ price level soon and afterwards break 0.54$ resistence within this week, then most probably we will drop to 0.36$ levelWe are BULLISHShort update: We are in a symmetrical triangle now(curr price is 0.512$), if we break 0.53$, then we can see KDA growing to 0.6$. P.S I am still holding long term and daily transaction volume is increasing(253k now), which signals adoption and continuous developmentAfter breaking out of symmetrical triangle we went to 0.59 - 0.60$ area, where our 200MA on 1D timeframe lays. As for now, we can see some correction, especially if BTC drops(I am not selling). If we break 200MA on daily timeframe(0.601$), then we can expect a movement up to 0.75$, which corresponds to the 100MA on 3D timeframeCrucial moment, we either break 0.6$(1D 200MA), gather liquidity and grow to 0.7$ or the price gets correctedShort update, for now I would expect a movement to 0.7$ and correction after(up to around 0.5$), especially if BTC gets corrected. If this scenario plays out, then we can potentially form Inverted Head and Shoulder with the potential up to 0.9$. Not a financial adviseAs I mentioned before, we have reached 0.7$, if you check 3D timeframe, you will notice we are kind of overbought( I am not selling!!! ), therefore, I am expecting some correction to happen soon. Additionally, if you open 1W timeframe you will observe tremendous buy volume, which is an extremely decent sign for upcoming future.Correction is in play as was mentioned above. We can see a drop to the 0.53$ level and bounce after, which will form our right shoulder in Inverse H&S pattern with the first target of 0.9$Short update: We might be forming our right shoulder, let's observe how our 3D candle gets closed, price now is 0.614$. If we get closed above 0.67$ we will have a BULLISH engulfing. In general, the local target I am waiting is 0.8$(our local H&S patter's target)Binance and CZ fud and correction after. As for KDA, 3D timeframe, we have inverted hammer candle(price is 0.58$). let's await and check the following 3D candle, whether we are forming a Right Shoulder now, if so, then we can see our 0.8$ target in the nearest time. Also be cautious(I am not selling!!!), because BTC has several bearish RSI divergences, so potentially it can drop in price, which will trigger market correctionShort Update: Once we break 0.69$ area with successful retest, our target will be 0.85-0.9$ P.S if you follow my IDEA, I would really appreciate if you LIKE it or SUBSCRIBEAnother Short Update: On KDA we've reached 0.74$, it is almost 2D 200MA. What are my expectations now? If you check USDT.D 1D chart you will see that we are kind of oversold now and we have a bullish divergence. For those who are not aware, when USDT.D chart drops in value - CRYPTO market grow, if USDT.D rises, then CRYPTO falls. As easy as it is. BTC chart, we are currently overbought, especially after the news that MicroStrategu bought another chunk of BTC supply. Additionally, we have open GAPs on BTC CME Futures chart, on 39,500$ and around 20,000$ !!! As for now, it makes sense if the market cools a bit down. therefore if you made some gains, do not forget to fix it. There is no trade in history who went bankrupt after taking his profits. Always keep it in mind and "don't marry your bags"I sold 40k+ of KDA and I will be waiting for BTC correction, not a financial advive and I might be wrong about selling, time will tell.Guess, I was right when I decided to sell. As for now, I am waiting for BTC correction, in long term BTC will grow, otherwise, why would MicroStrategy buy BTC, right? I will update this post, once I re-enter t\he marketI have rebought at 0.635$, expecting a move up to 0.96$Short update: I sold again at 0.72$ and I am expecting the market to correct soon, therefore I will stay outside for a while, not a financial advice.I have just re-bought at 0.7$ area and waiting BTC to retest 45k$Sold again at 0.72$, waiting for a correction after we could not break our 43.5k$ resistanceCongratulations to all who holded and manage to earn. I will publish a new post after the market correction.
TradeYourLogic
KDA/USDT pair

A for now we are moving in downward channel, at this present moment I would expect another drop down to around 0.35$ price area and some accummulation there with the following break upward Gets invalidated if we manage to break resistance at 0.7$ and flipping R/S
TradeYourLogic
KDA/USDT

Not a financial advice, always perform your own research before buying anything My new chart and new vision for KADENA, at least for now I am waiting to see how 3D candle gets closed first, as for now it gets closed with BULLISH engulfing which will which induce our bullish continuationUnfortunately, we did not end up closing with BULLISH engulfing, I will be waiting for a weekly candle closureShort update, daily candle gets closed with the bullish engulfing, hence we can expect some upside movement, I am also waiting for the weekly candle, as for now the whole market is growing, therefore KDA can touch 1.5-1.6$ level soon I am expecting BTC to reach 27-28k level and after it will have a correction As usual, not a financial advice, please do your own researchStill waiting for 1W candle to get closed, if we manage to get closed above 1.35$ or somewhere around this area, weekly candle will engulf previous two weekly correction candles which will be an extremely bullish sign and we could await for further upcoming movements3D chart, we are currently within the ascending triangle pattern, as long as we stay above our uptrend line(1,08$) - we are fine and we can attend our 100MA(1,4$), in case if we manage to get closed beneath 1,08$, then we could also visit 1$ and 0.9$ accordinglyWe have broken our local support, on 1D timeframe potential Head and Shoulders pattern, if we break the neck(support at 1$), our potential target based on TA will be around 0.7$ As for now everything depends on BTCPotential Inverse Head and Shoulders on BTC 3D timeframe with the target around 31-32k, RSI is in oversold area Invalidation if BTC gets closed under 19k USDC.D and USDT.D, RSI is in overbought areaHope you have bought the dipShort update: I am still waiting for the Weekly candle gets closed, if BTC does not get dropped, then we will see an uptrend in KDA to our local resistance area Also mining difficult is increasing due to the KA3 miners release which eventually should decrease daily KDA producing, which might cause Demand > Supply, which can lead to the price growth Recently daily produce was around 60 000 of KDA and as for now it has decreased to around 45 000 KDA(It is not 100% yet, still gathering information for my inner statistics)Please, disregard previous information regarding daily produce decrease, I was wrongAfter some rally on BTC, I would expect a correction at around 25k area and the same time BTC.D is making some BEARISH divergences, which means ALTs can potentially start growing As for KDA, if we lose 0.9$ area we will start making lower lows, which means continuation of BEARISH trend, nevertheless I am holding it for long term just obserwing how the project gets developed To be honest, KDA under 1$ is a gift but none of this is a financial adviceShort update, nothing new has happened, just keep holding As for now we can observe ALTs pumping after BTC growing and USDT.D moving downward, I expect it to continue doing that but IMHO BTC will not genuinely break 32k area As for KDA, we need to close above 1.10$ on a daily timeframe in order to consider going to 1.40$ Patience always pays off
TradeYourLogic
KDA/USDT

Not a financial advice Potential Inverse Head and Shoulders pattern on 4H timeframe If we manage to break a downward resistance line and successfully retest it after we can continue growing to 2-3$ area in future with starting price rates at 1.2$ - 1.4$ As for me, I will keep KDA on spot and await to see where KADENA team leads us, 2023 year is promisingAfter a short rally, price has corrected and as for now, IMHO, we have a Cup&Handle pattern on 4h+ timeframe with the target around 1,25$ None of these is a financial advice, do you own researchAs for now, we are stuck at 1$ support area, if we break and go below 0.97$ area, then most probably we can expect another visiting of 0.85$ level, let's observeWe have printed a lower low and lower high on 4H timeframe, which is not a good sign but it can be a market manipulation before CPI data release, let's patiently awaitShort update: if we manage to go upward and stay above 1.03$, then we have some decent chances to continue upward movement to 1.2$ - 1.3$I do not want to post a new chart yet, but I checked KDA chart on COINEX as it has more information and it seems we have broken upward a falling wedge with ATH at 3$, hence as for now we can reach it within the next months Nevertheless, we still have to break upward our Cup and Handle pattern Not a financial advice4H timeframe is not looking good, KDA and a whole market is following BTC We might see a final bottom-capitulation on BTC before an uptrendAs for now, we are most probably going to retest our support zone at 0.85$ or going lower, even 0.5$ is possible, let's await and see We also might end up in a bear trap if BTC maintains 16450$Cup&Handle was invalidated but we might end up forming Double Bottom on 1D timeframe with the 1st target around 1.35$ and 2nd target around 1.7$ Let's await whether it occursNot 100% sure yet, but we might be about to break our downward resistance line, huge Falling Wedge patter with the potential of 3$ and locally we can be forming and breaking our Double Bottom formation on 1D timeframeStill unable to break downward resistance, we can visit 0.85$ or lower if BTC makes lower lowsAs for now if BTC does not fall under 16500$ we have decent chances to form Double Bottom on 1D timeframe with the first target 1.3$ We also have Bullish Divergence on 1W timeframe and if we manage to close above 0.91$+ we will have Bullish Engulfing on 1W as well which is extremely a good sign1W Bullish Engulfing candle, I am expecting 1,07$ soon, not a financial adviceNot a financial advice, as for now we follow BTC trend and BTC is getting overbought, USDC.D and USDT.D are getting oversold on a chart, which signals that we may face a correction soon, do not forget to lock profitsNot a financial advice We have an open GAP on BTC CME futures and there is a high probability we will close it soon, also per USDT.D and USDC.D(both oversold per RSI) show potential local correctionHope you did lock some profits and re-bought lower, CME BTC gap has not been filled yet, I am expecting it to get filled first before we can climb higherNot a financial advice I might be wrong but I have sold my KDA pack at 1.31$ to lock profit, I will be waiting for correction as we are currently at support zone per USDC.D We also have 2 unfilled gaps on CME Therefore I will try to re-purchase at around 1.18$ areaNot a financial advice I decided to re-buy at around 1.28$ after some re-evaluation and just hold it, on a 1M chart we have a potential bullish engulfing and deep oversold per MFI(money flow index) on 1M candlestick as wellNot a financial advice I am waiting until 3D candlestick gets closed, as for now it gets closed with a upper wick which means sellers are taking control for now and at this point I would expect some correction before we proceed furtherWe need to get closed above 1.35$ which is our 200MA on daily timeframe, if we do so we will have an uptrend. As for BTC I am expecting to see 30k within the mid term1.7$ might be next but not yet confirmed, need to wait until weekly candle gets closed I will also post a new vision with the chart
TradeYourLogic
KDA/USDT

If we manage to break this downward resistance line with successful retest, I will expect visiting our 1.5$, 2$ and might even 3$(depends on BTC)As for now I expect the price to reach around 1.55$ level which equals our 12H 200 MA and after some pull backWe are staying above 12H 100MA, which is a good sign, I still expect we will at least touch 200MA(1.5$)Just a suggestion, but we can reach 0.9$ level first before we goes upwardMarket manipulation... Hope you did not sell
TradeYourLogic
KDA/USDT

Potential inverse Head&Shoulders on 1D timeframe, also bullish RSI divergence on 1W timeframe If BTC price gets reversed back to the 25l+ level, also keep in mind we have unclosed gaps on CME exchange at 28k and 35k levels, hence I could expect KDA price follows BTC and potentially reach 3$ or 4$ level I am also awaiting for the announce of 2nd KDA cohort or future projects, in general Kadena is long term investment, we have brillian team, therefore I sincerely believe that KDA has a bright futureBe prepared and patient, if BTC keeps falling, we can hit 1.2$ level and even lower as well but keep in mind, the best time to buy is when everyone is fearful and when everything is falling, you basically buy cheap assets, especially when it refers to the promising project like KDA
TradeYourLogic
KDA/USDT Cup&Handle?

Can we reverse in price here and form a Cup and Handle pattern here eventually ending up at 2.7$ rate? I am not 100% sure yet but as I mentioned before I do really believe in KDA long term and I am DCAing my entry. Once we expand our ECO system and DEFI TVL, price will drastically ascend, definitely worth of keeping it a long termUnfortunately, we broke our resistance, let's check whether we can hold 1.4$ level I am DCAing and holding it long termCan we form an inverse H&S pattern on 1D timeframe?
TradeYourLogic
KDA/USDT

Not a financial advice I have done some tiny research regarding KDA and to be honest I frankly believe it has immense potential(similar to EGLD, Harmony, Solana before their price peak), therefore I decided to DCA it. As you can see it is currently in overbought area per RSI hence correction will take place but if you check its weekly candle you will observe a bullish engulfing I will update this post, if anything phenomenal happensHope you have managed to make some decent gains, do not forget to fix it, also bear in mind that we are quite overbought per RSI and per USDT.D chart potential correction might be comingWell, as I said before, correction is in play, keep DCAing and holding for a long termI expect to see another leg up if we keep 2 - 2.2$ level and we see 50MA crossing 200MA on 12H timeframe
TradeYourLogic
CLV/USDT
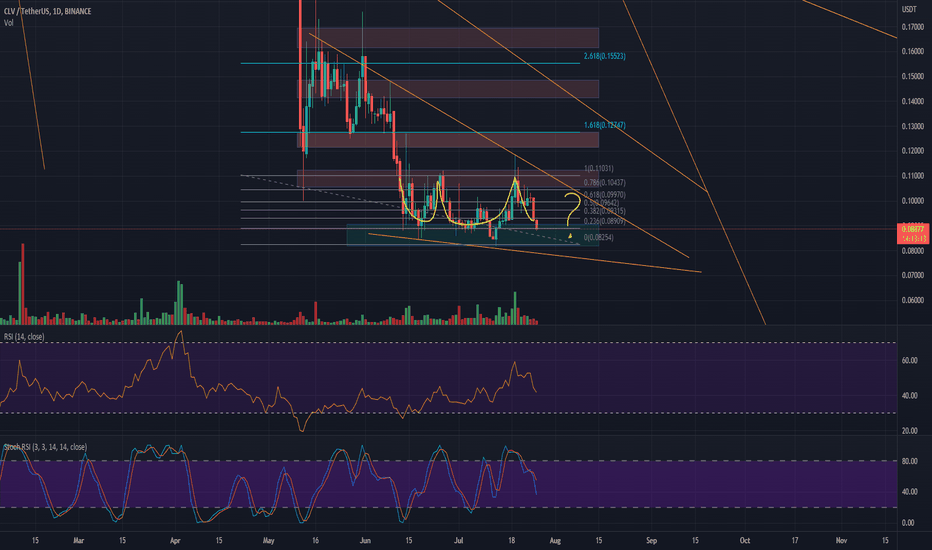
Potential Triple Bottom on 1D timeframe if we find support in our demand zone Targets on a chartDue to the USDT and USDC dominance chart, as it reached oversold level, I have closed my CLV position, I expect some correction per BTC and ALTs, therefore I will post new ideas once it occursForgot to mention that I have rebought CLV and increased its amount after local pumps As for now we are approaching 200MA on 12H timeframe, let's see whether we manage to break it and stay above Also on August 10th, we will have new inflation numbers, hence I am expecting some volatility on a market, moreover we are in oversold area in USDT.D chart, that is why reversal might be coming, so I would recommend to keep tight stop loses unless you are holding long term(as me)I decided to close CLV trade and await for the total market correction
Disclaimer
Any content and materials included in Sahmeto's website and official communication channels are a compilation of personal opinions and analyses and are not binding. They do not constitute any recommendation for buying, selling, entering or exiting the stock market and cryptocurrency market. Also, all news and analyses included in the website and channels are merely republished information from official and unofficial domestic and foreign sources, and it is obvious that users of the said content are responsible for following up and ensuring the authenticity and accuracy of the materials. Therefore, while disclaiming responsibility, it is declared that the responsibility for any decision-making, action, and potential profit and loss in the capital market and cryptocurrency market lies with the trader.