
TradeSmart-2
@t_TradeSmart-2

What symbols does the trader recommend buying?
Purchase History
پیام های تریدر
Filter
TradeSmart-2
SOL Long
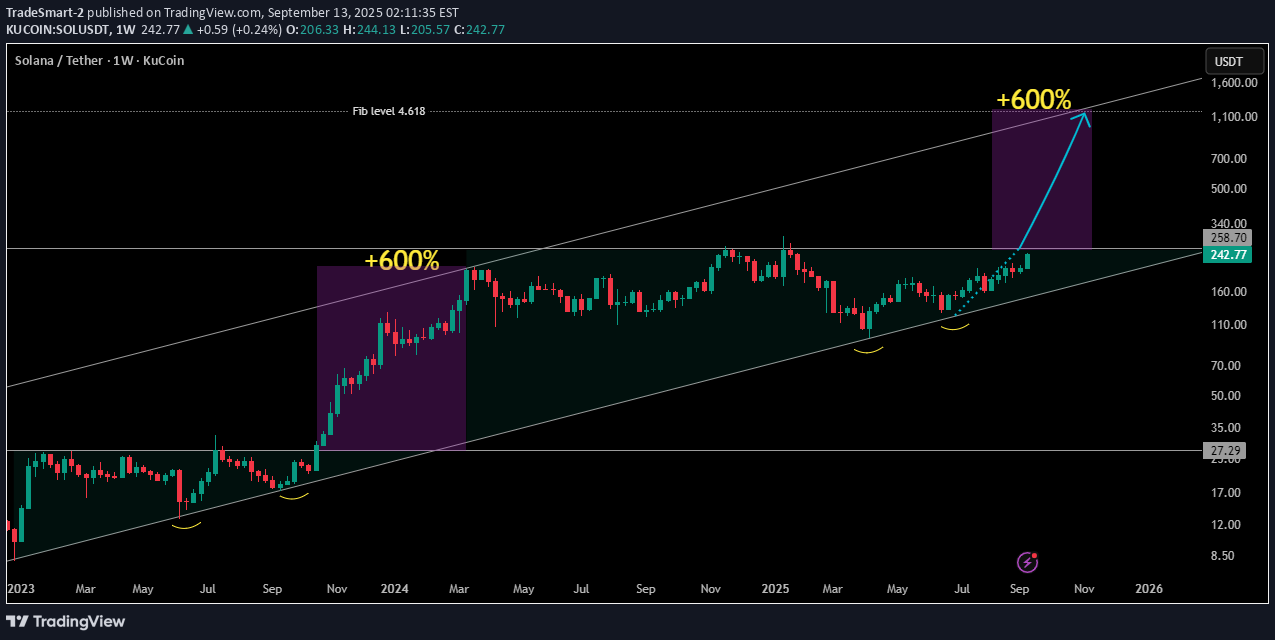
SOL setup is massive and unfolding fast. Previous breakout delivered +600% Now forming same double-bottom and channel. $1,000+ isn’t crazy — it’s calculated.
TradeSmart-2
TradeSmart-2
$SNEK 9X Long Potential
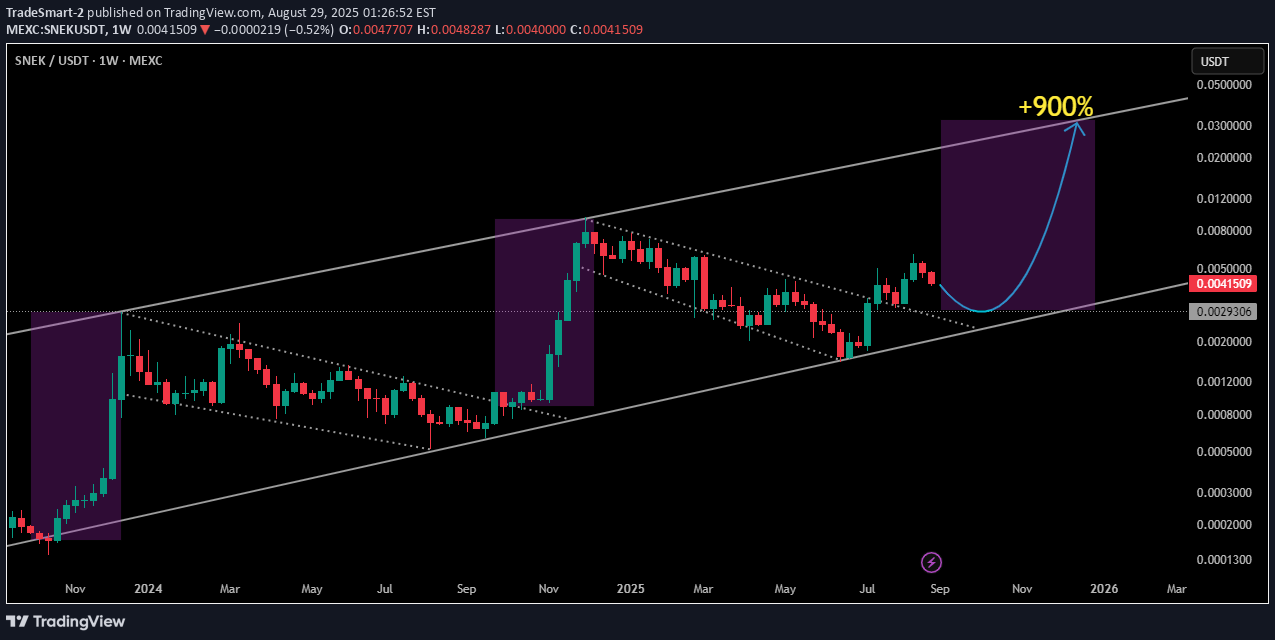
$SNEK holding the long-term channel. History shows explosive rallies from here. Next wave eyeing +900% upside.
TradeSmart-2
FLOW

Trend: Overall downtrend since 2023, but currently bouncing from the lower boundary of the channel. Current Price: $0.406, up 8.27% this week – a bullish sign. Support Zone: Around $0.33–$0.35 (lower boundary of the descending channel). Resistance Zone: $0.70–$0.80 short-term, and $1.28 long-term (upper channel boundary). 🧠 Summary: FLOW shows signs of a potential reversal from the bottom of a long-term channel. If it continues to respect this bullish momentum, it could target higher resistances, possibly even approaching the $1+ zone in the coming months.
TradeSmart-2
69Billion Market Cap Target

Current Market Structure: Price at time of analysis: ~0.00000729 USDT. The market had a sharp drop, consolidated, and now appears to have bounced from support near 0.00000580. Price is forming a potential bullish reversal and has broken above a falling wedge, which is typically a bullish pattern. 📈 Trend Channels and Support/Resistance: The chart uses parallel channels to identify market direction. PEPE seems to be respecting an upward trend channel. Key support/resistance levels: Support: 0.00000580, 0.00000359 Resistance: 0.00001717, 0.00002834 Target zone: Around 0.00016000 (as marked on the chart) 📊 Projection (Light Blue Path): The light blue projection shows a bullish scenario: Gradual growth till mid-2025 Strong breakout afterward toward 0.00016000 This would imply a massive rally — potentially more than 20x from current levels. 🧠 Conclusion / Sentiment: The overall bias based on this chart is bullish. Ideal entries may have been around the wedge breakout (around 0.00000580). Conservative traders might wait for confirmation above 0.00000900 (near resistance). Long-term target: 0.00016000, but expect pullbacks and consolidations along the way.
TradeSmart-2
PEPE/USDT

Trend & Pattern Downtrend: Since mid-December 2024, the price has been in a downtrend, as shown by the falling trendline. Potential Reversal: A breakout from the descending trendline seems to have occurred recently (early April 2025), suggesting a potential trend reversal. Key Levels Support Zone: Around 0.00000580 USDT, where price has previously bounced multiple times (strong demand zone). Resistance Zones: 0.00000850 – 0.00001000 USDT: First major resistance area, also near the 200 EMA (~0.00001098). 0.00001300 – 0.00001500 USDT: Next resistance if the price manages to break above 0.00001098. 0.00001717 USDT: Final target shown on the chart (upper resistance). Indicators 200 EMA (Blue Line): Currently above the price (~0.00001098), acting as dynamic resistance. A breakout above this would confirm bullish momentum. Potential Scenarios Bullish Case (as drawn): Price breaks above the current level and retests the breakout area (~0.00000850). Continues to climb toward the 200 EMA (~0.00001098). If that breaks, the price could move toward the 0.00001300–0.00001500 region and possibly to 0.00001717. Bearish Rejection: If rejected at resistance (~0.00000850 or 0.00001098), price may fall back to the support region around 0.00000580. Conclusion The chart suggests a bullish breakout scenario is in play. A close above 0.00000850 would be a good bullish confirmation. Watch 0.00001098 (200 EMA) closely—if broken, the uptrend may gain strong momentum.
TradeSmart-2
ETHUSDT

ETHUSDT I expect Long around 2650 area , this is not financial advice
TradeSmart-2
DOGEUSDT

DOGEUSDT about to bull with nice pattern. almost 80% completed pattern at the moment .
Disclaimer
Any content and materials included in Sahmeto's website and official communication channels are a compilation of personal opinions and analyses and are not binding. They do not constitute any recommendation for buying, selling, entering or exiting the stock market and cryptocurrency market. Also, all news and analyses included in the website and channels are merely republished information from official and unofficial domestic and foreign sources, and it is obvious that users of the said content are responsible for following up and ensuring the authenticity and accuracy of the materials. Therefore, while disclaiming responsibility, it is declared that the responsibility for any decision-making, action, and potential profit and loss in the capital market and cryptocurrency market lies with the trader.