Tracking_Technicals
@t_Tracking_Technicals
What symbols does the trader recommend buying?
Purchase History
پیام های تریدر
Filter

Tracking_Technicals
Ethereum is Totally Looking Bearish for next Couple Weeks Min

We Can See We Doji'd out and Failed to make a Higher High Suggesting Bulls are coming to Exhaustion and Bears are Taking Over I'm Expecting a Draw Down to At Least 2500 on ETH before the End of June

Tracking_Technicals
Ethereum is Totally Looking Bearish for next Couple Weeks Min

We Can See We Doji'd out and Failed to make a Higher High Suggesting Bulls are coming to Exhaustion and Bears are Taking Over I'm Expecting a Draw Down to At Least 2500 on ETH before the End of June

Tracking_Technicals
Btc is Channling on Fib Line Last chance to get 50k btc

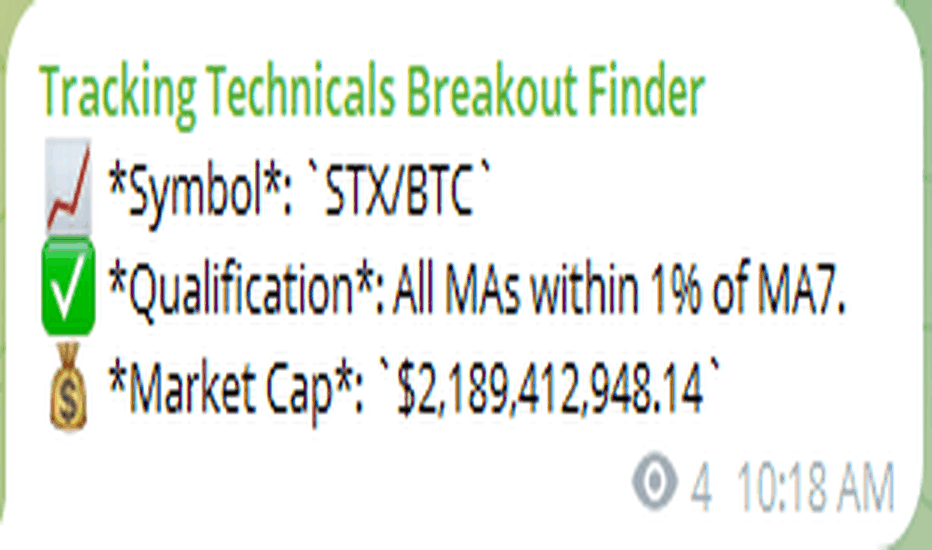
After an incredibly Impressive 25% Run btc is channeling on the Fib Line .786 It looks to have made a tripple bottom on the .78 as well on the 4 hour time frame. It Looks Like We've Had Our Drop and we're starting to continue back rushing to that all time high as there isn't enough selling volume to really convince me that it's going to keep pushing down any further. This is the last Chance to get a 50k BTC! Also Bitcoin Came up on our Breakout Finder Thursday Tracking Technicals Breakout Finder, [2/22/2024 10:18 AM] 📈 *Symbol*: `BTC/GBP` ✅ *Qualification*: All MAs within 1% of MA7. 💰 *Market Cap*: `$1,007,232,196,139.76` Tracking Technicals Breakout Finder, [2/22/2024 10:18 AM] 📈 *Symbol*: `BTC/TUSD` ✅ *Qualification*: All MAs within 1% of MA7. 💰 *Market Cap*: `$1,007,232,196,139.76` Tracking Technicals Breakout Finder, [2/22/2024 10:18 AM] 📈 *Symbol*: `BTC/USDC` ✅ *Qualification*: All MAs within 1% of MA7. 💰 *Market Cap*: `$1,007,232,196,139.76` Tracking Technicals Breakout Finder, [2/22/2024 10:18 AM] 📈 *Symbol*: `BTC/USDT` ✅ *Qualification*: All MAs within 1% of MA7. 💰 *Market Cap*: `$1,007,232,196,139.76`

Tracking_Technicals

Tracking_Technicals
Video Explanation of SPA Low Marketcap, Very Bullish Overall

With a Previous high of $0.20 in a Bear Market This Coin being a Penny is pretty significant. We've been forming a support line that's been relevant for at least 18 months. Zooming in the Support Line was tapped 4 Times and looks like it has no intention on coming back. ADX is high looking as if it's going to continue going as such. MACD Still looks bullish as can be. This is a wonderful project i believe there's a lot of faith in. Let me Show you something interesting about SPA is it's recently been coming up on our market sifter and Breakout finder on the BTC Pair Tracking Tech Market Sifter, [2/13/2024 10:36 AM] 📈 *Name*: Sperax 🔖 *Symbol*: SPA 💲 *Price*: $0.011076170319746786 📉 *24h Change*: -9.79% 📊 *7d Change*: -17.16% 💰 *Market Cap*: $18_737_070.61 🔄 *24h Volume*: $13_850_112.77 🏷️ *Tags*: alameda-research-portfolio, arbitrum-ecosytem, dwf-labs-portfolio Do Your Own Research as Always

Tracking_Technicals
Live stream - Lets Search for Breakouts

According to my breakout breakdown finder we have several tokens right now performing a Moving Average Squeeze!

Tracking_Technicals
SPA Healthy correction After 300% Breakout, Continuing Bullrun

The ADX is 12 and obviously Bottoming Out. The MACD is hovering below the signal line waiting to Make a Move. We Broke out ran 300% to have a health pullback and run 100% again This is a low marketcap token with a lot of potential and even has a 3x margin available on kucoin. Don't miss this banger! 📈 *Name*: Sperax 🔖 *Symbol*: SPA 💲 *Price*: $0.011076170319746786 📉 *24h Change*: -9.79% 📊 *7d Change*: -17.16% 💰 *Market Cap*: $18737070.61 🔄 *24h Volume*: $13850112.77 🏷️ *Tags*: alameda-research-portfolio, arbitrum-ecosytem, dwf-labs-portfolio

Tracking_Technicals
XEM Starting to breakout Ascending Triangle

The ADX Has Bottomed out showing we're soon to start rising and find strength in the upcoming Trend as well as currently Oscillators are traditionally performing better. The MACD has recently signaled a buy and we're cruising above the signal line. We're forming an ascending triangle with the price target taking us close to the next fib line more importantly running that 50 period moving average to form a golden cross more than likely forming a new more volatile uptrend! Watch XEM Y'all Fib Ranges have it running between 100-400%

Tracking_Technicals
Sui Very Bullish

We were Squeezing back in November, We started having an outbreak in positive volume. Once we crossed over the 50 period moving average we started a new trend. We had a golden cross and didn't have a pullback until Jan 15th where we started a correction and had a healthy touch on the .618 before continuing crushing the previous swing high finding it's way with some resistance around the 1.61 fib at 2.12 After 2.12 according to the fib extension we can look at price targets 3.20, 4.28, and 4.95 in the not so distant future.

Tracking_Technicals
Sei is looking Incredibly Bullish

We're Currently at the last swing high after a health correction testing back to the .618 fib We can see the 50 Day Moving Average came up and hugged against the fib line & moving average simultaneously. Sei is one of the Most Bullish Projects to date as it seems with no intention of stopping. Prices to consider according to fib ranges 1.36 2.14 2.92 3.41
Disclaimer
Any content and materials included in Sahmeto's website and official communication channels are a compilation of personal opinions and analyses and are not binding. They do not constitute any recommendation for buying, selling, entering or exiting the stock market and cryptocurrency market. Also, all news and analyses included in the website and channels are merely republished information from official and unofficial domestic and foreign sources, and it is obvious that users of the said content are responsible for following up and ensuring the authenticity and accuracy of the materials. Therefore, while disclaiming responsibility, it is declared that the responsibility for any decision-making, action, and potential profit and loss in the capital market and cryptocurrency market lies with the trader.
