
TizzaBuburuzza
@t_TizzaBuburuzza

What symbols does the trader recommend buying?
Purchase History
پیام های تریدر
Filter
XAUUSD Multi-Timeframe Plan + Daily Sniper Setup (W1 → M15)

🟨 WEEKLY (W1)✅ Bullish structure (HHs & HLs)🔓 Broke ATH → price discovery mode🎯 Targets: 3,120 / 3,180 / 3,250🟩 Key demand: 2,985–2,950📅 DAILY (D1)🔼 Breakout above 3,049 confirmed🕳️ FVG forming between 3,049–3,083📈 No bearish signs while above 3,049💡 EMA structure supports momentum🕓 H4✅ Clean breakout from consolidation🟩 Demand zones:3,049 (Flip zone)3,000.65 (HTF OB)📈 Trend in expansion phase🕐 H1📦 Broke range between 3,000–3,049🔲 OB + liquidity grab confirmed support🎯 Targeting 3,100 / 3,120🕧 M30 & M15 (Precision Zones)🔹 Entry 1: 3,083–3,085 (FVG + OB zone)🔹 Entry 2: 3,073–3,076 (Unmitigated demand)✅ Validate entries via M1/M5 CHoCH + bullish PA🔫 DAILY SNIPER PLAN✅ Buy Setup (High Probability)Entry: 3,083–3,085 or 3,073–3,076Trigger: M1–M5 CHoCH or bullish engulfingSL: Below 3,070TP1: 3,100TP2: 3,120TP3: 3,150🔥 HTF trend + fresh liquidity = high-RR long opportunity.🟥 Sell Setup (Countertrend Idea)Entry: 3,118–3,121 (liquidity hunt zone)Trigger: Bearish M5/M15 CHoCH + LQ sweepSL: Above 3,125TP1: 3,100TP2: 3,085TP3: 3,050⚠️ Use only if price shows exhaustion + structure break.✅ Recap:Focus remains on buy-the-dip as long as price holds above 3,049.Bearish setups = scalp/reversal only if smart money shifts short-term flow.
XAUUSD H1 Trading Plan (Intraday Precision)

Bias: 📈 BullishCurrent Price: ~$3,096Context: Clean breakout from H1 range → intraday expansion phase in play.📊 1. Structure & Market PhasesPrice consolidated in a tight range (highlighted in blue) for ~1 week, between ~3,000 and ~3,049.Recent breakout above range → confirming bullish continuation.Minor HLs forming → micro structure remains clean.🧠 2. Smart Money Concepts🔲 Old OB / Demand Zone: Gray zone = area of prior breakout (ideal re-entry on pullbacks).🧊 Range high (~3,049.57) = now acting as support (flip zone).🧠 FVG might exist in the 3,060–3,080 range on lower TFs → potential internal mitigation.📌 3. Key H1 Levels🔝 Upside:🔸 3,120.14 – Major upside target (aligned with HTF)🔸 Next target levels depend on PA around psychological levels (e.g., 3,100, 3,150)🟦 Support Zones:✅ 3,049.57 – Previous range high✅ 3,000.66 – Base of accumulation block✅ 2,983–2,975 – Internal mitigation zones✅ 2,899.69 – Major invalidation point (HTF OB)📅 4. Trade Scenarios (H1 Execution Focus)✅ Scenario A: Breakout ContinuationPrice stays above 3,049–3,060 → bullish continuation likely.🎯 Target: 3,100 / 3,120 intradayLook for bullish BOS or FVG entries on pullbacks (M15/M5 timing ideal)🔁 Scenario B: Pullback into DemandRetracement back to 3,049 / 3,030 / 3,000 zone🔁 Entry on bullish reaction from prior range topGreat RR setups for continuation longs🟥 Scenario C: Deeper Reversal (Less Likely)Break below 2,975 could lead to:🔻 Deeper move into OB around 2,960 / 2,899Would shift intraday bias from bullish to neutral🧭 Summary1H is in a breakout phase – ideal moment to hunt continuation trades.Pullbacks into previous range top or base are high-probability re-entry zones.Bias remains strongly bullish unless structure below 2,975 is broken.
XAUUSD H4 Trading Plan (Intraday Outlook)

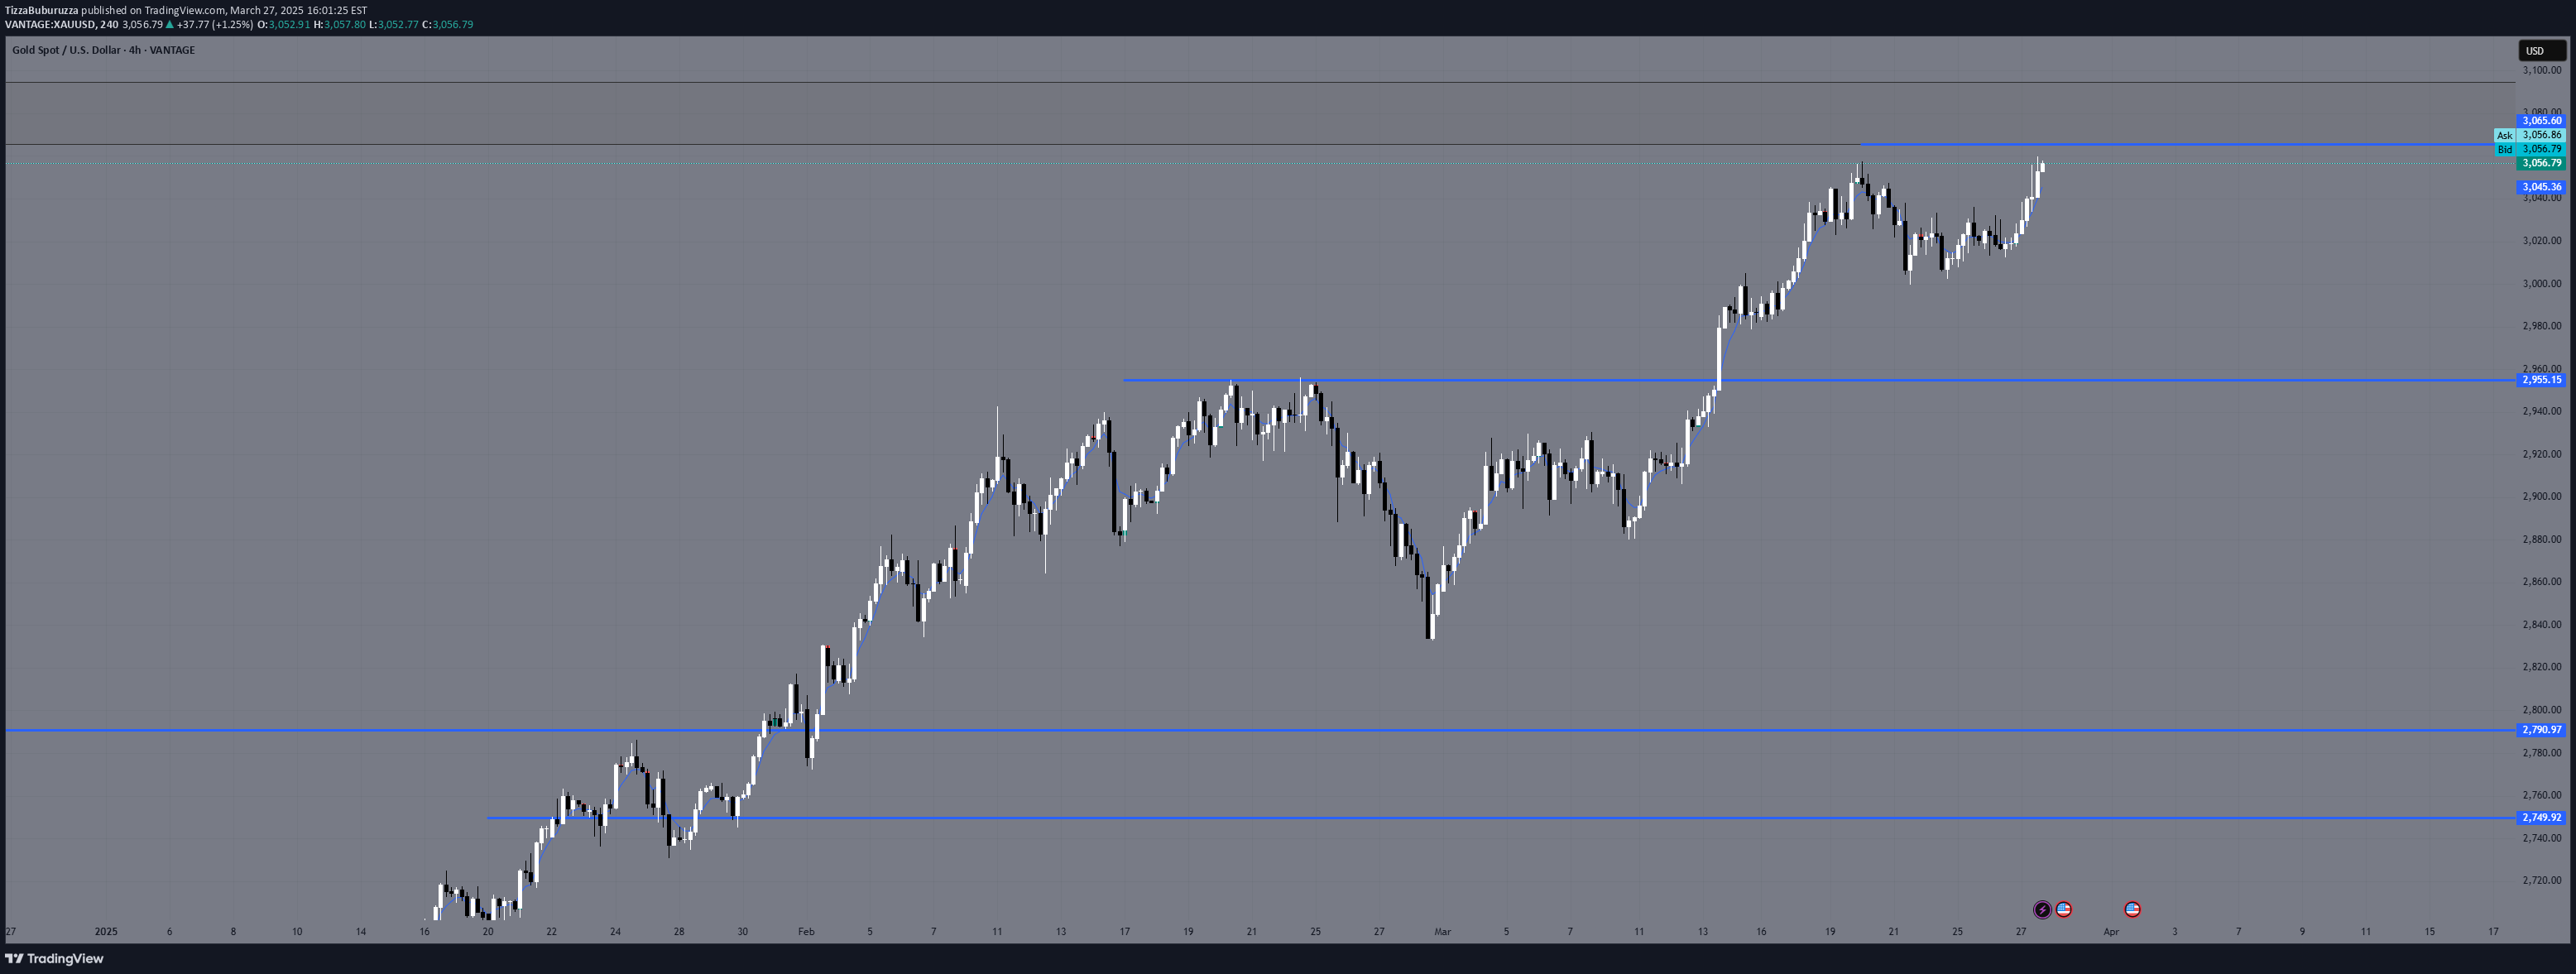
Bias: 📈 Bullish (Strong Continuation)Current Price: ~$3,093Context: Price is accelerating after breaking key resistance, maintaining bullish structure.🧠 1. Market Structure (H4)Structure remains bullish, with well-defined HH & HL.Recent consolidation block (OB + FVG): price broke out cleanly and is now expanding.Short-term trend leg is steep → potential for shallow intraday pullbacks.📌 2. Key Levels from Your Chart🔝 Upside Target3,120.14 – Major H4 resistance / next liquidity zone🟦 Intraday Support Zones3,049.57 – recent H4 resistance, now flipped support (ideal for pullback entries)3,000.65 – clean structure zone, possible FVG fill2,977.64 – origin of last impulse2,960.27 / 2,899.69 – deeper HTF demand / OB zones🔍 3. Order Blocks & Liquidity🔲 OB zone breakout (highlighted gray area) → now acting as demand💧Buy-side liquidity rests above 3,120Any retracement into 3,049 / 3,000 could be used by Smart Money for re-entry longs📅 4. Trade Scenarios (H4)✅ Scenario A: Bullish ContinuationPrice holds above 3,049 → intraday continuation toward:🎯 3,120🎯 Potential extension: 3,150+📌 Ideal setup: bullish engulfing or BOS + FVG entry on pullback to 3,049 zone🔁 Scenario B: Pullback Before ContinuationRejection near 3,100–3,120 leads to pullback toward:🔁 3,049🔁 3,000 (FVG / previous OB)Monitor price action at those levels for continuation entries.🟥 Scenario C: Bearish Shift (Low Probability for Now)Break below 2,960 with strong bearish momentum → opens door toward:🔻 2,899This would invalidate current bullish short-term structure.🧭 SummaryTrend is strong, momentum is clean → only looking for buy setups on dips.Watch for continuation above 3,049 and especially reactive price action near 3,120.If pullback occurs, 3,000 zone is prime location for re-entry longs.
XAUUSD Daily Trading Plan (1D Outlook)
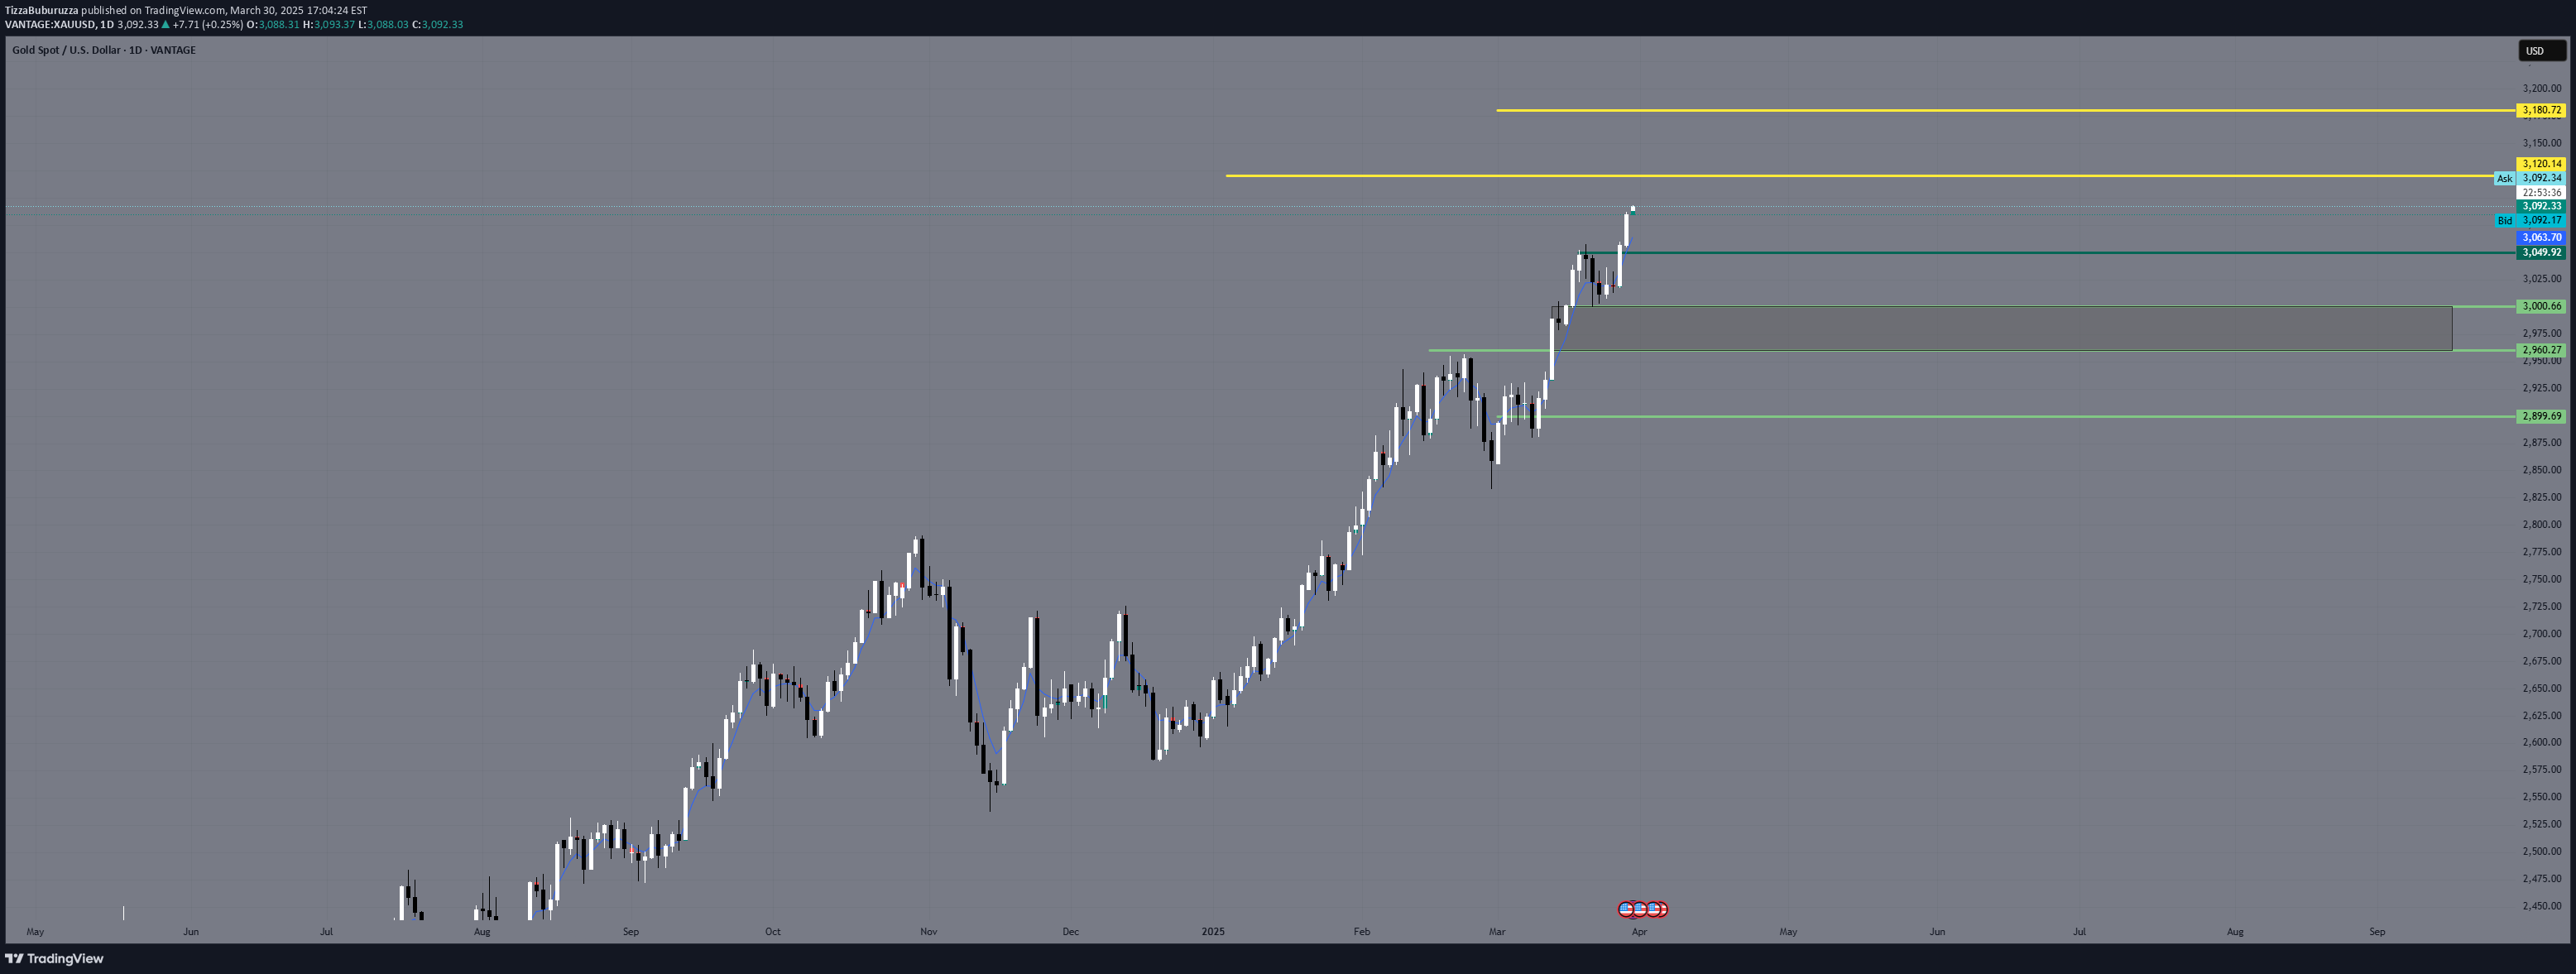
🔍 1. Structure & Price ActionPrice broke out aggressively from previous consolidation (~2960–3000).Current impulse leg is strong, with very shallow pullbacks – trending conditions.Daily candles show sustained buying pressure, minimal upper wicks → buyers in control.📏 2. Key Levels (from your chart)📌 Upside Targets:🔸 3,120.14 – potential resistance / short-term TP🔸 3,180.72 – extended upside target if momentum holds🟩 Support Zones:✅ 3,049.38 – minor intraday support✅ 3,000.66 – recent breakout retest zone✅ 2,960.77 – clean demand zone / OB zone✅ 2,899.69 – last major demand / strong structure support🧠 3. SMC & Liquidity InsightsBuy-side liquidity has been cleared → clean runway toward psychological zones (3100–3200).FVG may exist between recent candles → shallow retracement into 3049 / 3000 possible.No active bearish OBs above → price remains in price discovery mode.📅 4. Daily Trade Scenarios✅ Scenario A: Bullish ContinuationHold above 3,049–3,060 → continuation toward:🎯 3,120🎯 3,180+Look for strong H4 bullish candles on retest of minor support.⚠️ Scenario B: Pullback to DemandReject from 3,100+ and drop toward:🔁 3,000 (retest previous high)🔁 2,960 (key OB / FVG zone)Watch for bullish reversal signals (engulfing, break of structure) for re-entry long.🟥 Scenario C: Deeper Reversal (Less Probable)Break below 2,899 could shift bias to neutral/short-term bearish.🧭 SummaryXAUUSD is in a strong trending phase with no major resistance above.Pullbacks into 3,049 / 3,000 / 2,960 are ideal areas to look for continuation longs.Focus remains on buy-the-dip setups as long as price holds above 2,899.
XAUUSD Weekly Trading Plan (W1 Outlook)

Bias: 📈 Bullish (Strong Momentum)Structure: Higher Highs / Higher Lows (Weekly)Current Price: ~$3,084Market Phase: Price Discovery / Momentum Phase🔍 1. Weekly Market StructureClear bullish structure with strong continuation.Recent Higher Low (HL): ~1985–2000 zone.Current Weekly Candle: Strong bullish with little to no upper wick → sign of aggressive buying.🧠 2. Smart Money Concepts (SMC)✅ Liquidity Grab: Buy-side liquidity above 2080–2150 has been swept → cleared space for new highs.📏 Fair Value Gap (FVG): Estimated FVG between 3000 – 3080, possible retest area.🧱 Valid Bullish OBs: Below, around 1985–2000 (HL origin).⛔ No resistance above – price is now in price discovery mode.📊 3. EMA Alignment (Estimated)EMA 5/21/50/200 are all bullishly stacked.Price is significantly extended above EMA 21 → potential for short-term pullback.Trend remains intact and strong.🧱 4. Key Zones (Weekly)Support Zones:3000 – 2960 → recent impulse base.2900 – 2880 → minor structure zone.2080 – 2100 → breakout + consolidation area.No historical resistance above current levels. Watch for round number reactions (e.g. 3100, 3150, 3200).🔢 5. Fibonacci Levels (Swing Low: ~1985 → High: ~3084)0.382: ~26600.5: ~25350.618: ~2410→ These levels are relevant only if price enters deeper retracement later.📅 6. Weekly Scenarios✅ Bullish Continuation (Main Bias)Hold above 3000 → target extensions toward:🎯 3120 / 3180 / 3250+Strong momentum candle suggests interest remains to the upside.⚠️ Pullback ScenarioRejection from 3085 area → potential drop toward:3000 (minor FVG fill)2960–2900 (stronger structure + potential re-entry area)Bullish bias remains intact unless we break below 2900 weekly close.🧭 SummaryXAUUSD is in price discovery after sweeping key liquidity.Momentum is strong, but price is overextended → short-term pullbacks are healthy.All signs point toward higher targets unless major structure breaks.
XAUUSD – Refined Daily Plan w/ Sniper Entries

🔹 HTF Bias (D1 + H4)🔼 Overall trend: BullishPrice is inside a Premium HTF zone (3065–3090)Daily and H4 structure are bullish, but price is testing a major liquidity zoneReaction expected either:✅ Bullish continuation on breakout🔁 Short-term rejection for retracement ➤ sniper setups engage🧠 Current Setup Situation (M15–H4 Context)📍 Price is consolidating below 3065, forming equal highs ➤ liquidity sitting aboveM15 + M30 show clear FVG + OB confluence zonesH4 has no CHoCH yet — structure intactStrategy: reactive entries based on smart money reaction🔻 SNIPER SELL SETUP (Scalp to Retrace)🎯 Sell Plan:Entry Zone: 3064.5 – 3066SL: Above 3070 (above wick + LQ)TP1: 3041 → M30 FVGTP2: 3020 → H1 bullish OBTP3: 3008 → large imbalance (LTF)⚠️ Entry Conditions:Price must:Sweep liquidity above equal highsShow M15 or M5 bearish BOS / engulfingIdeally with shift in order flow (CHoCH)✅ Confluences:D1 & H4 Premium zoneM15 OB + FVGLiquidity resting above 3065🔺 SNIPER BUY SETUP (Continuation)🎯 Buy Plan:Entry Zone: 3016–3020SL: Below 3010TP1: 3035TP2: 3055TP3: 3065 (liquidity revisit)⚠️ Entry Conditions:Clean rejection from OB zoneBullish candle (M15/M30) or LTF BOSNo full break below 3008 – that invalidates buy✅ Confluences:Clean OB + FVG (M30 / H1)Sits in discount zone after potential rejectionH4 demand & D1 continuation zone🧭 Decision Tree→ If price breaks 3065 + holds → wait for retest → long continuation→ If price sweeps 3065 + shows rejection → sniper sell→ If price drops to 3020 → look for long→ If price breaks 3008 → wait for structure to reset🧼 Summary:HTF = BullishActive zone = 3065 (reaction zone)Trade reaction, not predictionLet price come to your zone. Then strike like a sniper 🧠⚔️Sniper setups only execute after LTF confirmation🧠 Structure > Emotion🎯 Setup > Impulse💬 If this breakdown helped you, support the post:🔁 Boost / Like to help more traders see it✅ Follow for clean daily plans, sniper setups & SMC flowLet’s grow together, one smart trade at a time 📈
XAUUSD – H4 Trading Plan
📍 Structure✅ Market structure: Bullish🔼 Recent BOS confirms continuation📈 Price is pushing into resistance zone @ 3065⚠️ No CHoCH yet = no shift, but signs of potential slowing momentum🧩 Zones of Interest🔵 3065–3090 → Supply / Premium zone– Major liquidity draw– Inside weekly imbalance → potential reversal zone🔵 2955 → Prior range high + FVG– Ideal first mitigation target🔵 2790–2800 → OB zone + consolidation base– Swing target if breakdown continues🎯 Trade Scenarios🔼 Bullish BreakoutBreak & retest of 3065 (clean H4 close above)LTF entry (M15–H1) on pullback🎯 Target: ATH sweep (3100+)🛡️ SL: Below HL or valid OB🔽 Bearish RejectionStrong reaction from 3065–3090 zoneWait for H4 CHoCH → then Lower High🎯 TP1: 2955🎯 TP2: 2800🛡️ SL: Above rejection wick📌 Notes✋ No short without H4 CHoCH confirmation🧠 Structure is king – reaction first, entry secondPremium zone = decision zone → be reactive, not predictive
XAUUSD – Daily (D1) Analysis

🧱 Market StructureThe D1 structure is clearly bullish – price is printing HHs and HLs consistently.Current push is a continuation from previous consolidation, breaking structure upwards.No CHoCH or BOS bearish yet – buyers still in control.🔵 Key Zones (marked on your chart)1. Near-term Liquidity / ResistancePrice is approaching a marked supply zone / premium area at the top (same one from W1).This is likely to act as a reaction point – either:Sweep liquidity and reverseBreak through and continue higher2. Imbalances / Mitigation Zones Below PriceThese zones are clean mitigation targets if price rejects from the top:Zone LevelDescription2955Fair value gap / inefficiency (imbalance)2790–2800Strong structure zone + FVG + OB2740–2750Potential OB + previous consolidation2495Deep retracement level – less likely short-term🧩 Order Flow ObservationVery little sign of exhaustion in candles right now.The only reason to expect reversal is if:Price hits the extreme premium zoneWe see a strong daily rejection orLower timeframes shift (CHoCH / BOS)📉 EMA Perspective (implied)Assuming EMA 21/50/200:Price is well above EMA 21 & 50, indicating strong short-term bullish trend.A return to EMA 21 (probably around ~2950–2970) would be a healthy pullback.📌 Bias – DailyTermBiasReason Daily✅ BullishClean bullish structure, no shift Short-term⚠️ WatchfulIf price hits supply zone with reaction Ideal setupRejection from premium + CHoCH on H4/H1🧠 Trade Ideas (based on D1)🔼 Bullish ScenarioPrice holds above 3060 and breaks 3090+Entry on breakout + retest of minor OB on H1Target: ATH sweep and continuationSL: Below minor HL / reaction low🔽 Bearish ScenarioPrice enters supply zone → forms bearish D1 candle (engulfing / pinbar)Look for CHoCH on H4/H1 to enter shortTarget levels: 2950 ➝ 2800 ➝ 2750SL: Above daily high or OB
XAUUSD – Weekly (W1) Trading Plan

🧱 Market StructureClear bullish structure with sustained Higher Highs (HH) and Higher Lows (HL).Strong impulsive candles show aggressive bullish momentum, no signs of exhaustion yet.Order flow remains bullish until proven otherwise.🔍 Key Zones (S&D, FVGs, Gaps)🔝 Premium Zone [~3064–3094]Current price is within this premium area, which contains a weekly FVG / imbalance.Price is reacting inside this inefficiency (3064–3094) → draw on liquidity.This is not a demand zone, but rather a sell-side trap area for late buyers.Possibilities:Price fully fills the gap to ~3094 → then reverses (bearish reaction).Or, price continues pushing up for ATH sweep (liquidity above all-time-high).🧩 Below Current Price – Mitigation Zones🔵 2900–2950: Minor imbalance, could be used as short-term retracement target.🔵 2750–2800: OB + structural retest zone → high-interest mitigation area.🔵 ~2480–2550: Deep retracement zone – valid only if major structure breaks.📈 EMA Overview(Assuming standard 5/21/50/200 EMA stack)Price is far above all EMAs → strong bullish sentiment.A revisit to the 21 or 50 EMA (weekly) would represent healthy retracement.⚖️ BiasTermDirectionReasonLong-term✅ BullishStrong structure, unmitigated imbalances aboveMedium-term⚠️ Neutral-to-bullishDepends on reaction from 3064–3094Short-term🔄 Await reactionLTF confirmation needed for short setups🎯 Trade Scenarios🟩 Bullish ContinuationIf price uses 3064–3094 as support (mitigation → continuation)Targets: New ATH above 3100+Strategy: Wait for bullish PA confirmation (engulfing / BOS on D1/H4)🟥 Bearish RejectionIf price shows strong bearish reaction from 3064–3094 zoneIdeal confirmation: bearish engulfing / CHoCH on H4/H1Targets:TP1: 2950TP2: 2800SL above the high (once structure confirms)⏳ What to Watch NextWeekly close relative to the 3064–3094 zoneDaily/H4 candlestick behavior: rejection vs continuationLook for divergence between price and momentum, or exhaustion candles
XAUUSD The ultimate Sniper Entry Plan for 25 March 2025

XAU/USD - Daily Review & Sniper Entry Plan - March 25th, 2025✨ Overall Bias:Monthly: Bullish, but with a candle showing exhaustion, potential pullback towards discount.Weekly: Indecision, but we have a small CHoCH on the structure - possible correction towards the 2980 zone.Daily: Clear bearish candle on Friday, followed by a mild correction on Monday. Liquidity grab below 3000, but close above.🌐 Timeframe Breakdown:D1:Last confirmed CHoCH.Imbalance and FVG in the 3022-3035 zone.Potential bearish OB between 3031-3036.RSI below 50, momentum fading.H4:Lower highs / lower lows structure.Bearish confirmation: BOS + rejection from OB.Imbalance 3016-3026.EMA 21 and 50 acting as dynamic resistance.H1:Last CHoCH in the 3024 zone.Bearish engulfing confirmation.Unfilled FVG: 3016-3020.RSI < 40, increasing volume on bearish candles.M30 / M15:BOS on M15 and retest in the area of interest.Last swing high at 3018.13.Liquidity above 3018 and 3024 (EQH), below 3000 (EQL).🔹 Sniper Entry ScenariosScenario 1 (Short)Entry: 3018 - 3022 (FVG zone + OB + 61.8% Fibonacci)Confirmation: M15 bearish engulfing or BOS + retest.SL: above 3028 TP1: 3000TP2: 2985 (discount zone + liquidity)Scenario 2 (Long - Countertrend/Scalp)Entry: 2985 - 2990 (liquidity zone )Confirmation: M15 BOS + bullish pattern (engulfing/pin)SL: below 2979TP1: 3000TP2: 3015🔹 POI (Key Zones):3022-3028: FVG + OB + 61.8% Fibonacci - potential short zone3018.13: EQH - liquidity inducement2985: Daily OB + 78.6% Fibonacci - potential buy zone🌍 EMA Guide:EMA 5 < 21 on H1 and M30: bearish momentumEMA 50 acting as dynamic resistance (on H1: 3022)🔹 Conclusion: Favorable short on retracement to the 3018-3022 zone with confirmation. Target remains the 2985 zone for liquidity. Market response around 2985 will give clarity for potential buy/scalp.⏳ Expectations: After the Daily close, we can expect liquidity inducement towards 3020+, followed by a dump towards 2990-2985.🔔 Don't forget to Like, Share, and Follow for more updates! Let's hit that target together! 💰📈👉 Like if you found this helpful and follow for future setups!XAU/USD - Daily Review | March 25, 2025The main scenario from yesterday played out partially. The 3018–3020 sell zone was temporarily broken to grab liquidity above the EQH (3030–3031.50), followed by a strong bearish rejection.Executed trades:Two sell positions entered in the 3028–3030 zoneBoth closed manually at 3019 with +90–100 pips profitUnfilled orders:Some pending sell orders around 3018.50 remained untriggered before the stop hunt spike.Liquidity:Liquidity above EQH was taken, followed by sharp rejection — classic liquidity grab setup.Market sentiment:72% of traders were short during the spike — a clear retail trapBearish reaction after the liquidity grab confirms smart money activityConclusion: Bias remains bearish as long as price holds below 3031.50.The 3018–3020 zone remains a valid POI. Looking for further confirmation toward 2999.85 / 2985.15 as next targets.
Disclaimer
Any content and materials included in Sahmeto's website and official communication channels are a compilation of personal opinions and analyses and are not binding. They do not constitute any recommendation for buying, selling, entering or exiting the stock market and cryptocurrency market. Also, all news and analyses included in the website and channels are merely republished information from official and unofficial domestic and foreign sources, and it is obvious that users of the said content are responsible for following up and ensuring the authenticity and accuracy of the materials. Therefore, while disclaiming responsibility, it is declared that the responsibility for any decision-making, action, and potential profit and loss in the capital market and cryptocurrency market lies with the trader.