
Timpariyet
@t_Timpariyet

What symbols does the trader recommend buying?
Purchase History
پیام های تریدر
Filter
احتمال شکلگیری الگوی هارمونیک بیت کوین (BTC): دو سناریوی مهم پیش رو!
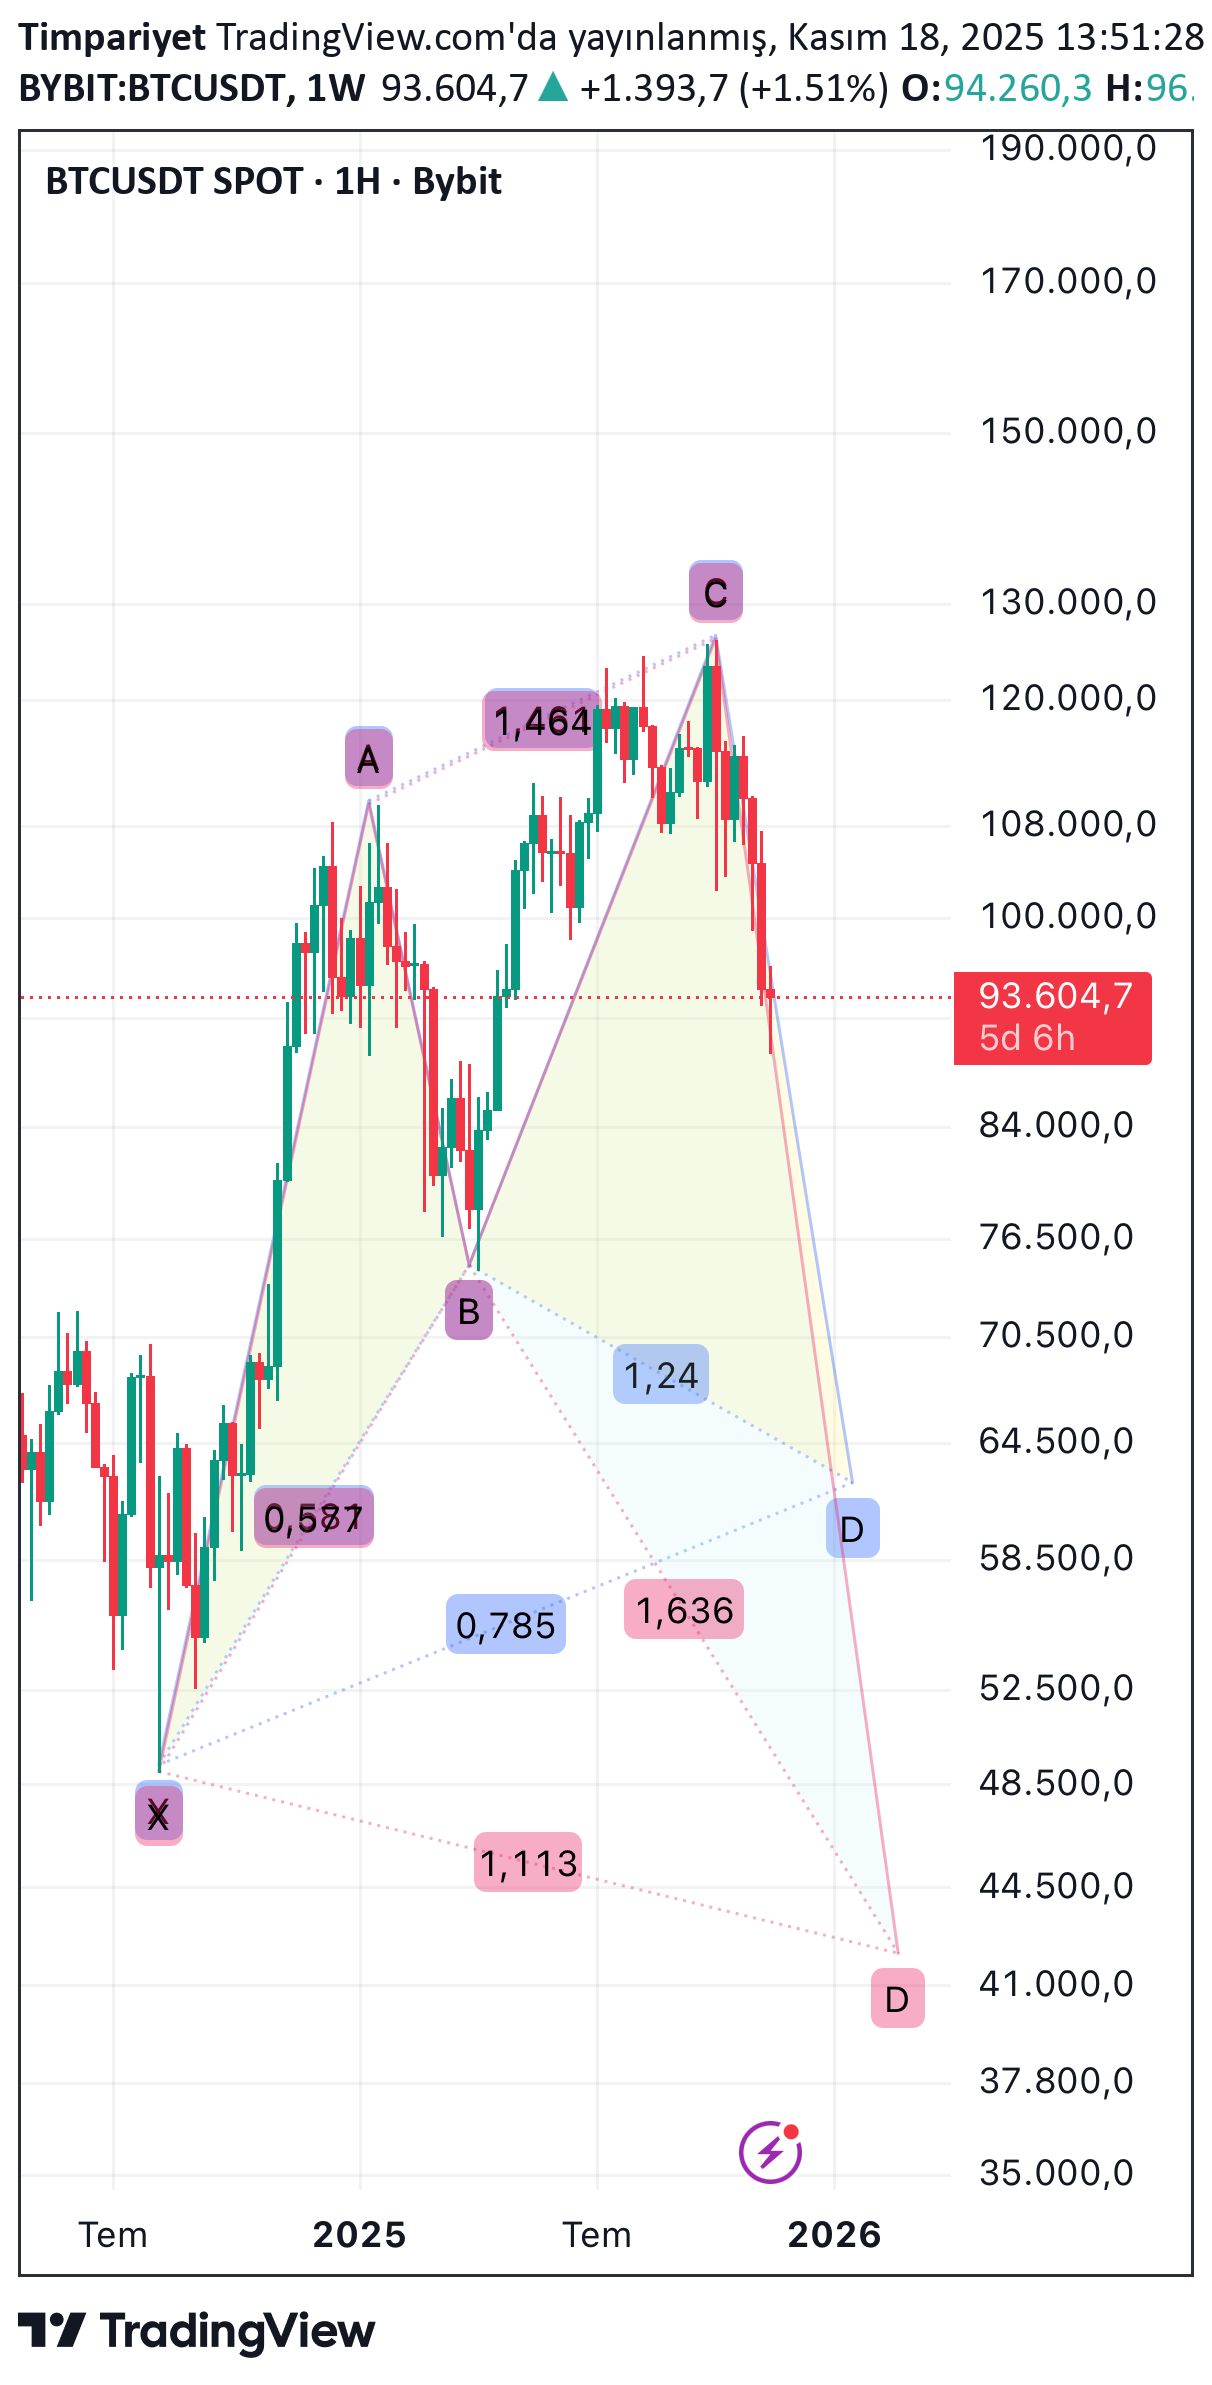
There are Cypher or Shark harmonic possibilities on the weekly chart. While the D point for Cypher is around 62K, for Shark this point is around 44K. For these two harmonics to occur, the price must close the week below 74500. I'm not sharing it because it's possible. YTD
تحلیل حساس بیت کوین (ETH 4S): آیا قیمت به اوج کانال صعودی میرسد یا سقوط میکند؟
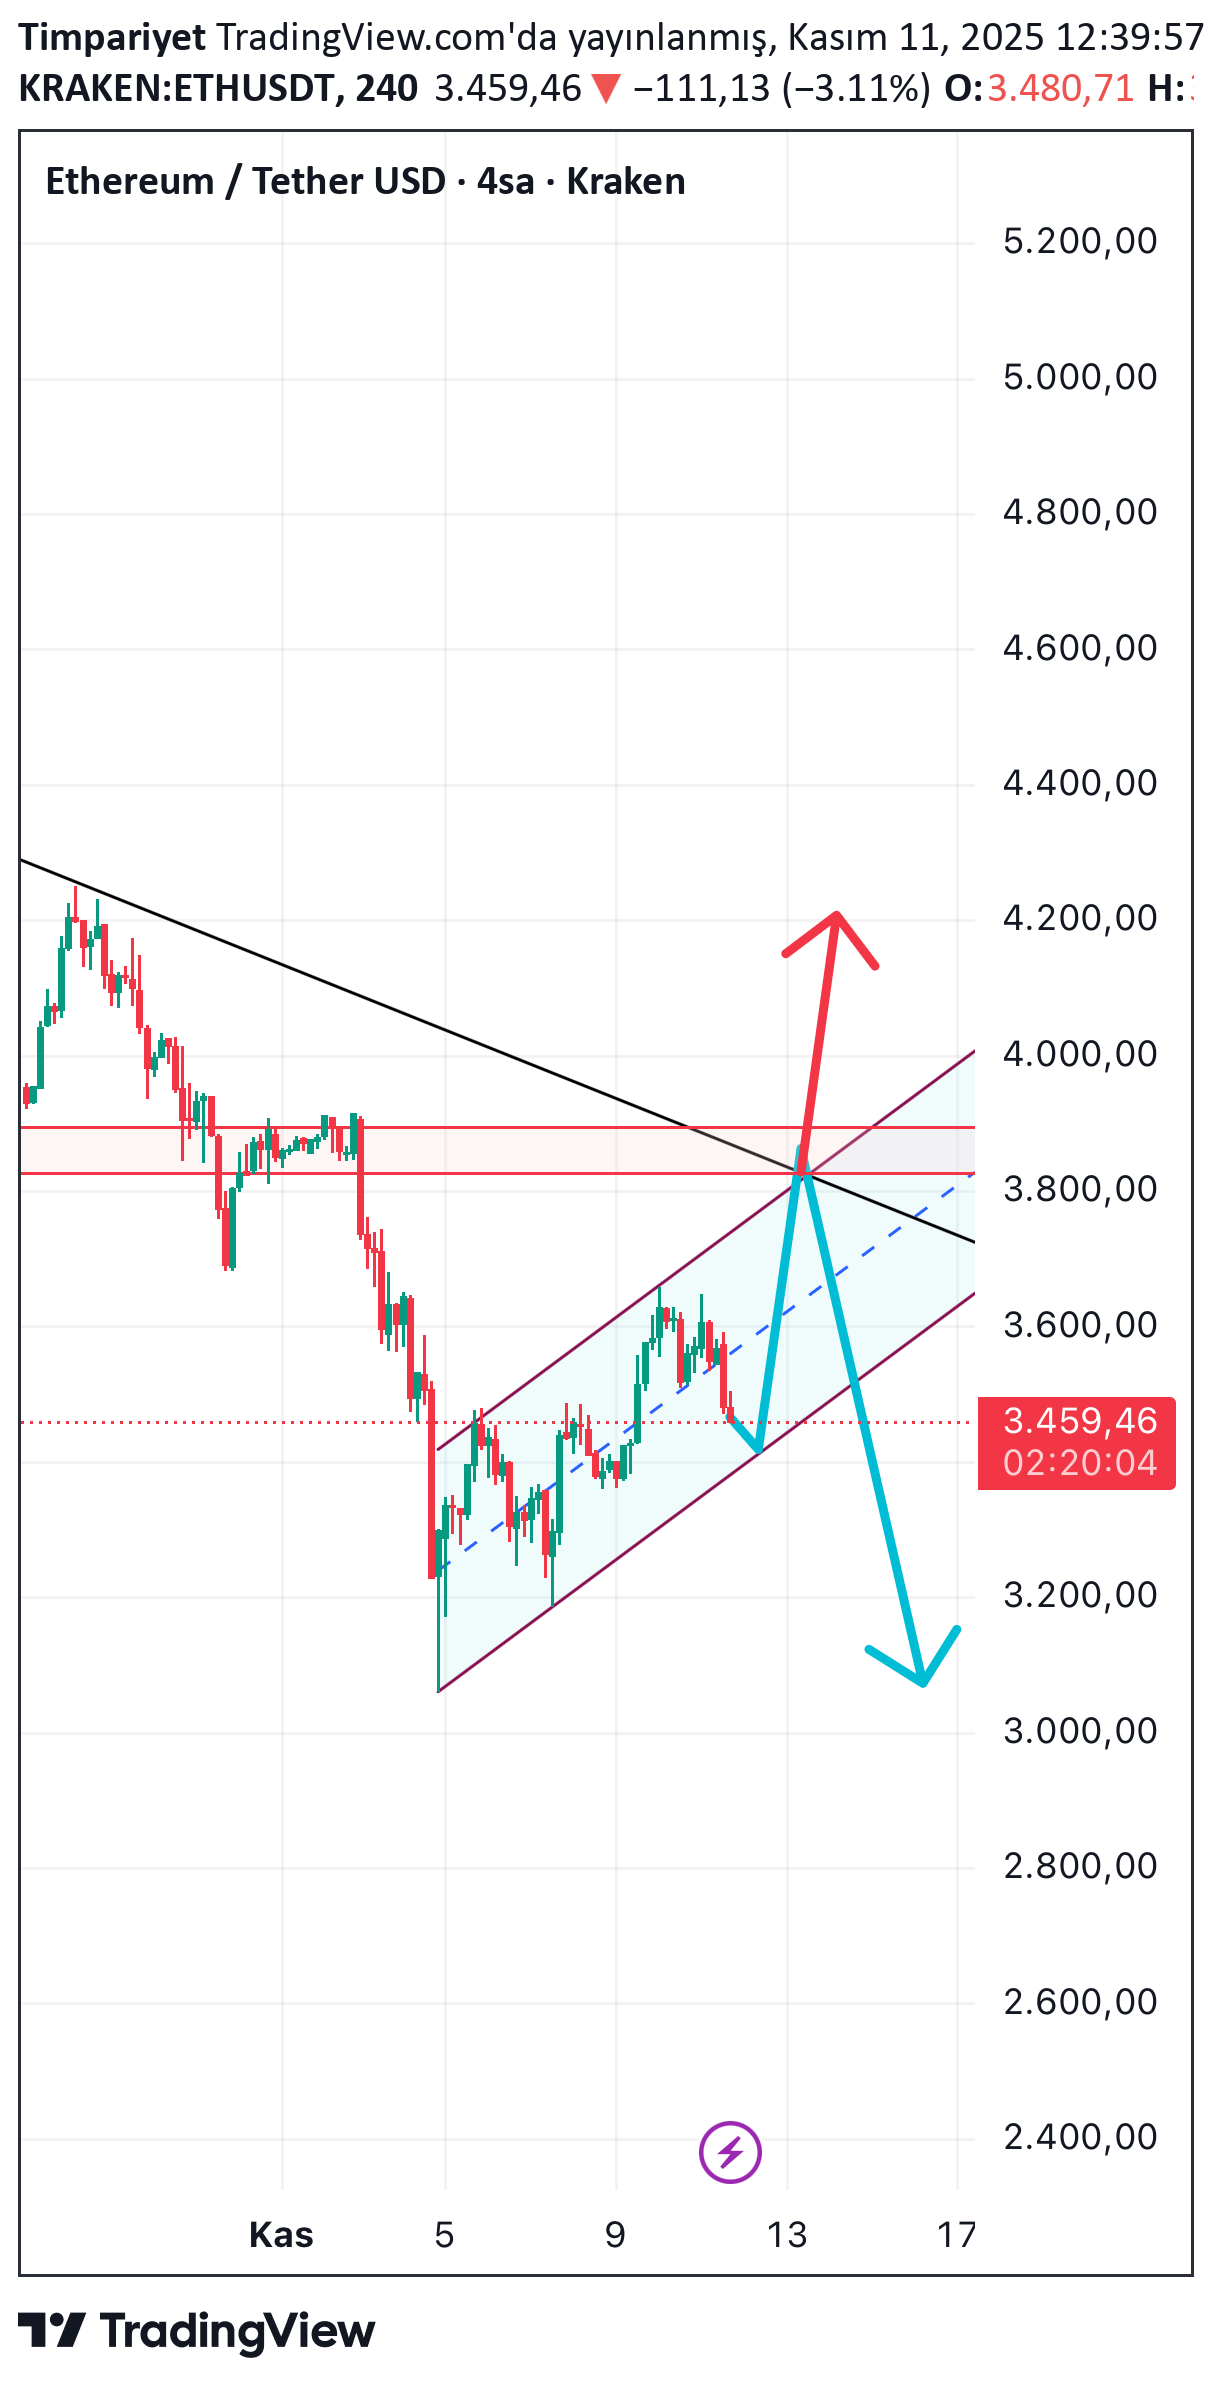
ETH 4S may be forming a rising channel on the chart. The region I showed in light red is an important region that has served as a support-resistance transformation zone for a very long time and will now act as resistance. If this resistance is overcome, I think the ETH channel will break upwards and move towards the upward targets I showed with the red arrow. However, if it loses red from that resistance, this time it can break the channel down and look for a new bottom and follow the path I showed with the light blue arrow. So, in my opinion, the critical zone is the red zone. YTD
تحلیل ماهانه اتریوم (ETH): آیا مثلث صعودی معتبر است؟ (مسیر صعود یا اصلاح عمیق؟)
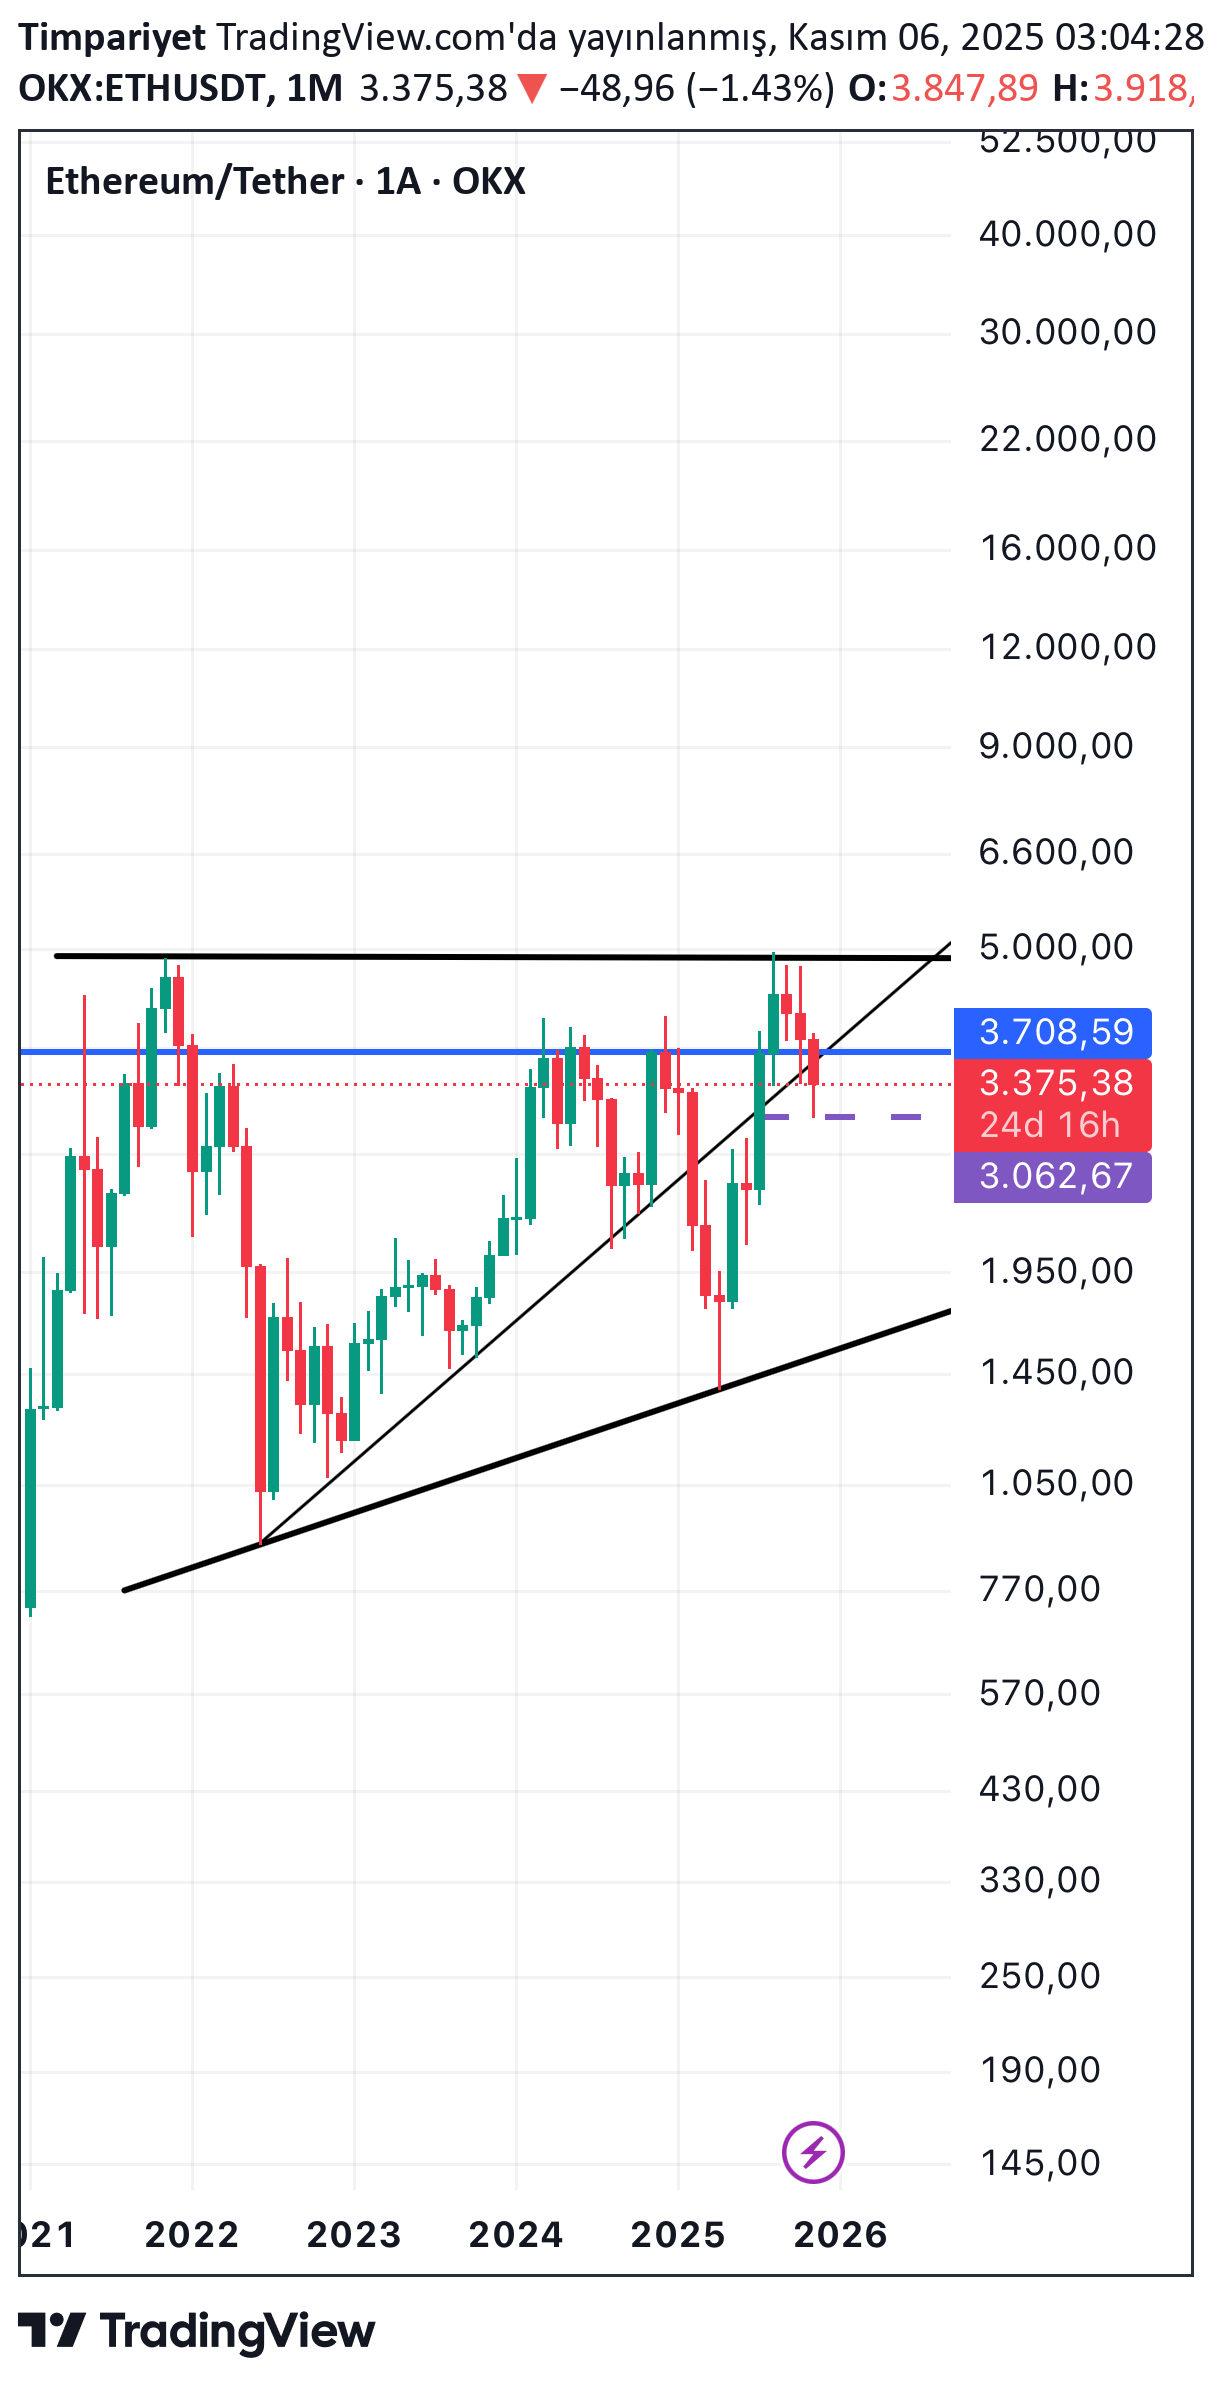
ETH may be forming an ascending triangle, which I show with thick lines on the monthly chart, that is, it may make a correction up to the alt line of the triangle. How do we know if he will do this? ETH Why did it get a pinpoint reaction from the level I showed with the dashed line, because it was the midpoint of the monthly FVG and the monthly MA-20 and EMA-21 were right there. Well, is this positive, yes for now, but in order to eliminate the ascending triangle threat, it must first close the month of November by going above the rising trend line, which it seems to have broken at the moment, and this break must thus remain a fake, and also confirm that the rise will continue by closing the month above the level I showed with the blue line. If these happen, I think December and January will be very bullish for ETH. Of course, otherwise, it may become common for ETH to experience a slightly deeper decline. YTD
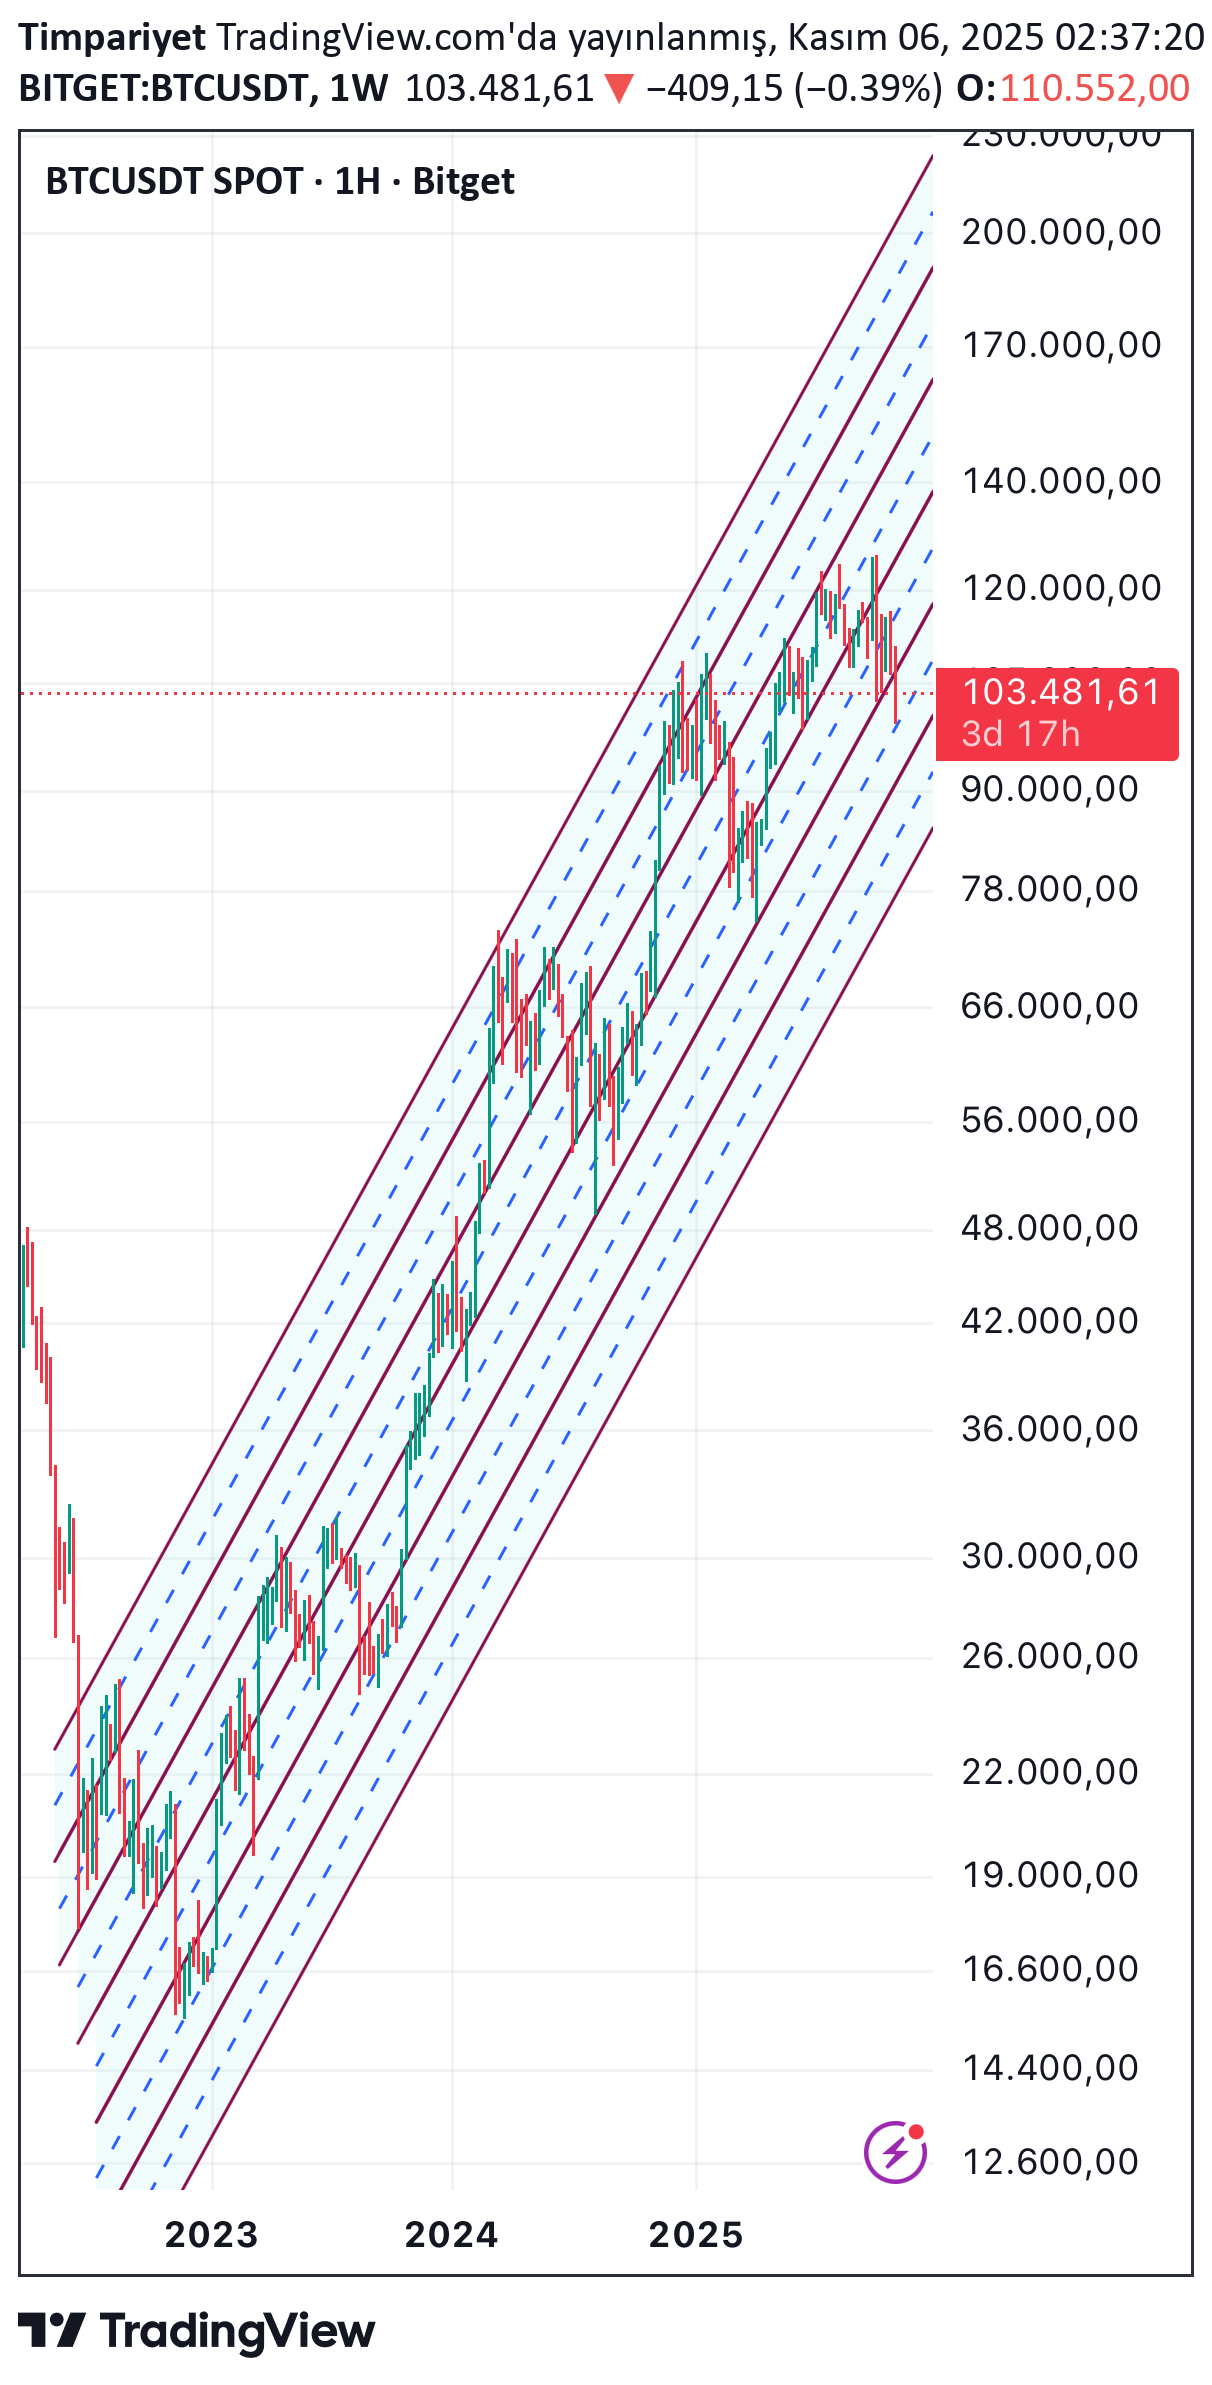
بیت کوین در خطر؛ شکست خط حیاتی 50 چه عواقبی برای روند صعودی دارد؟
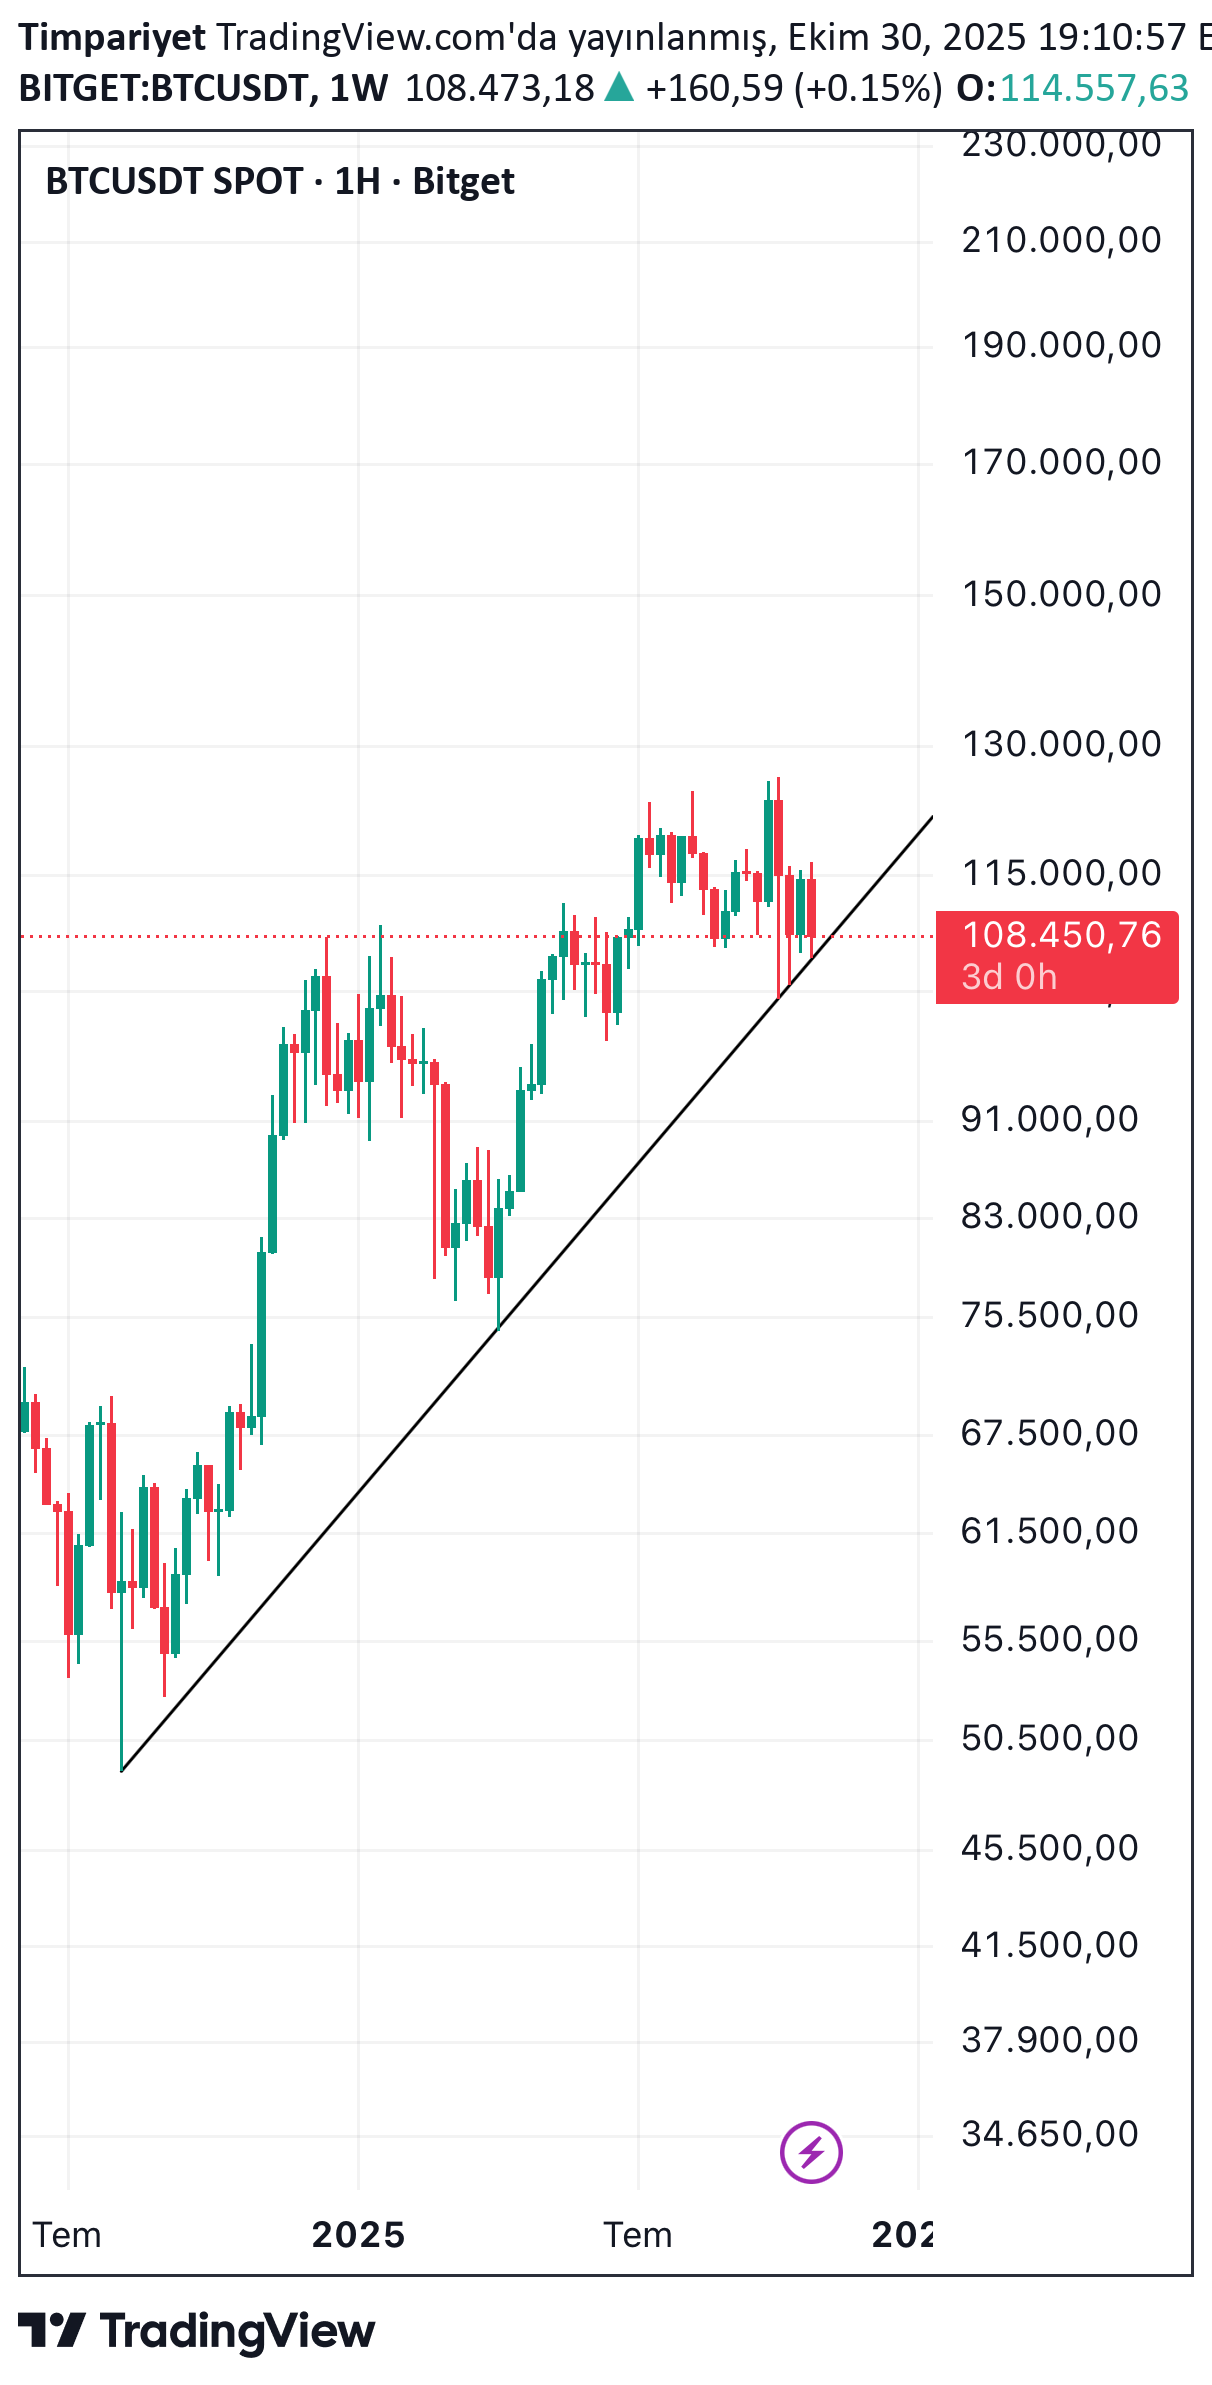
BTC The rising trend on the logarithmic chart should not be broken down and the week should not be closed below. If this happens, the weekly MA-50 will be broken for the first time this bull season. Additionally, the RSI will also fall below 50. In other words, since three negativities will come together, it may cause problems in the medium term. YTD
تحلیل بیت کوین: سه سیگنال انفجاری که هدفشان ۹۰ هزار دلار است!
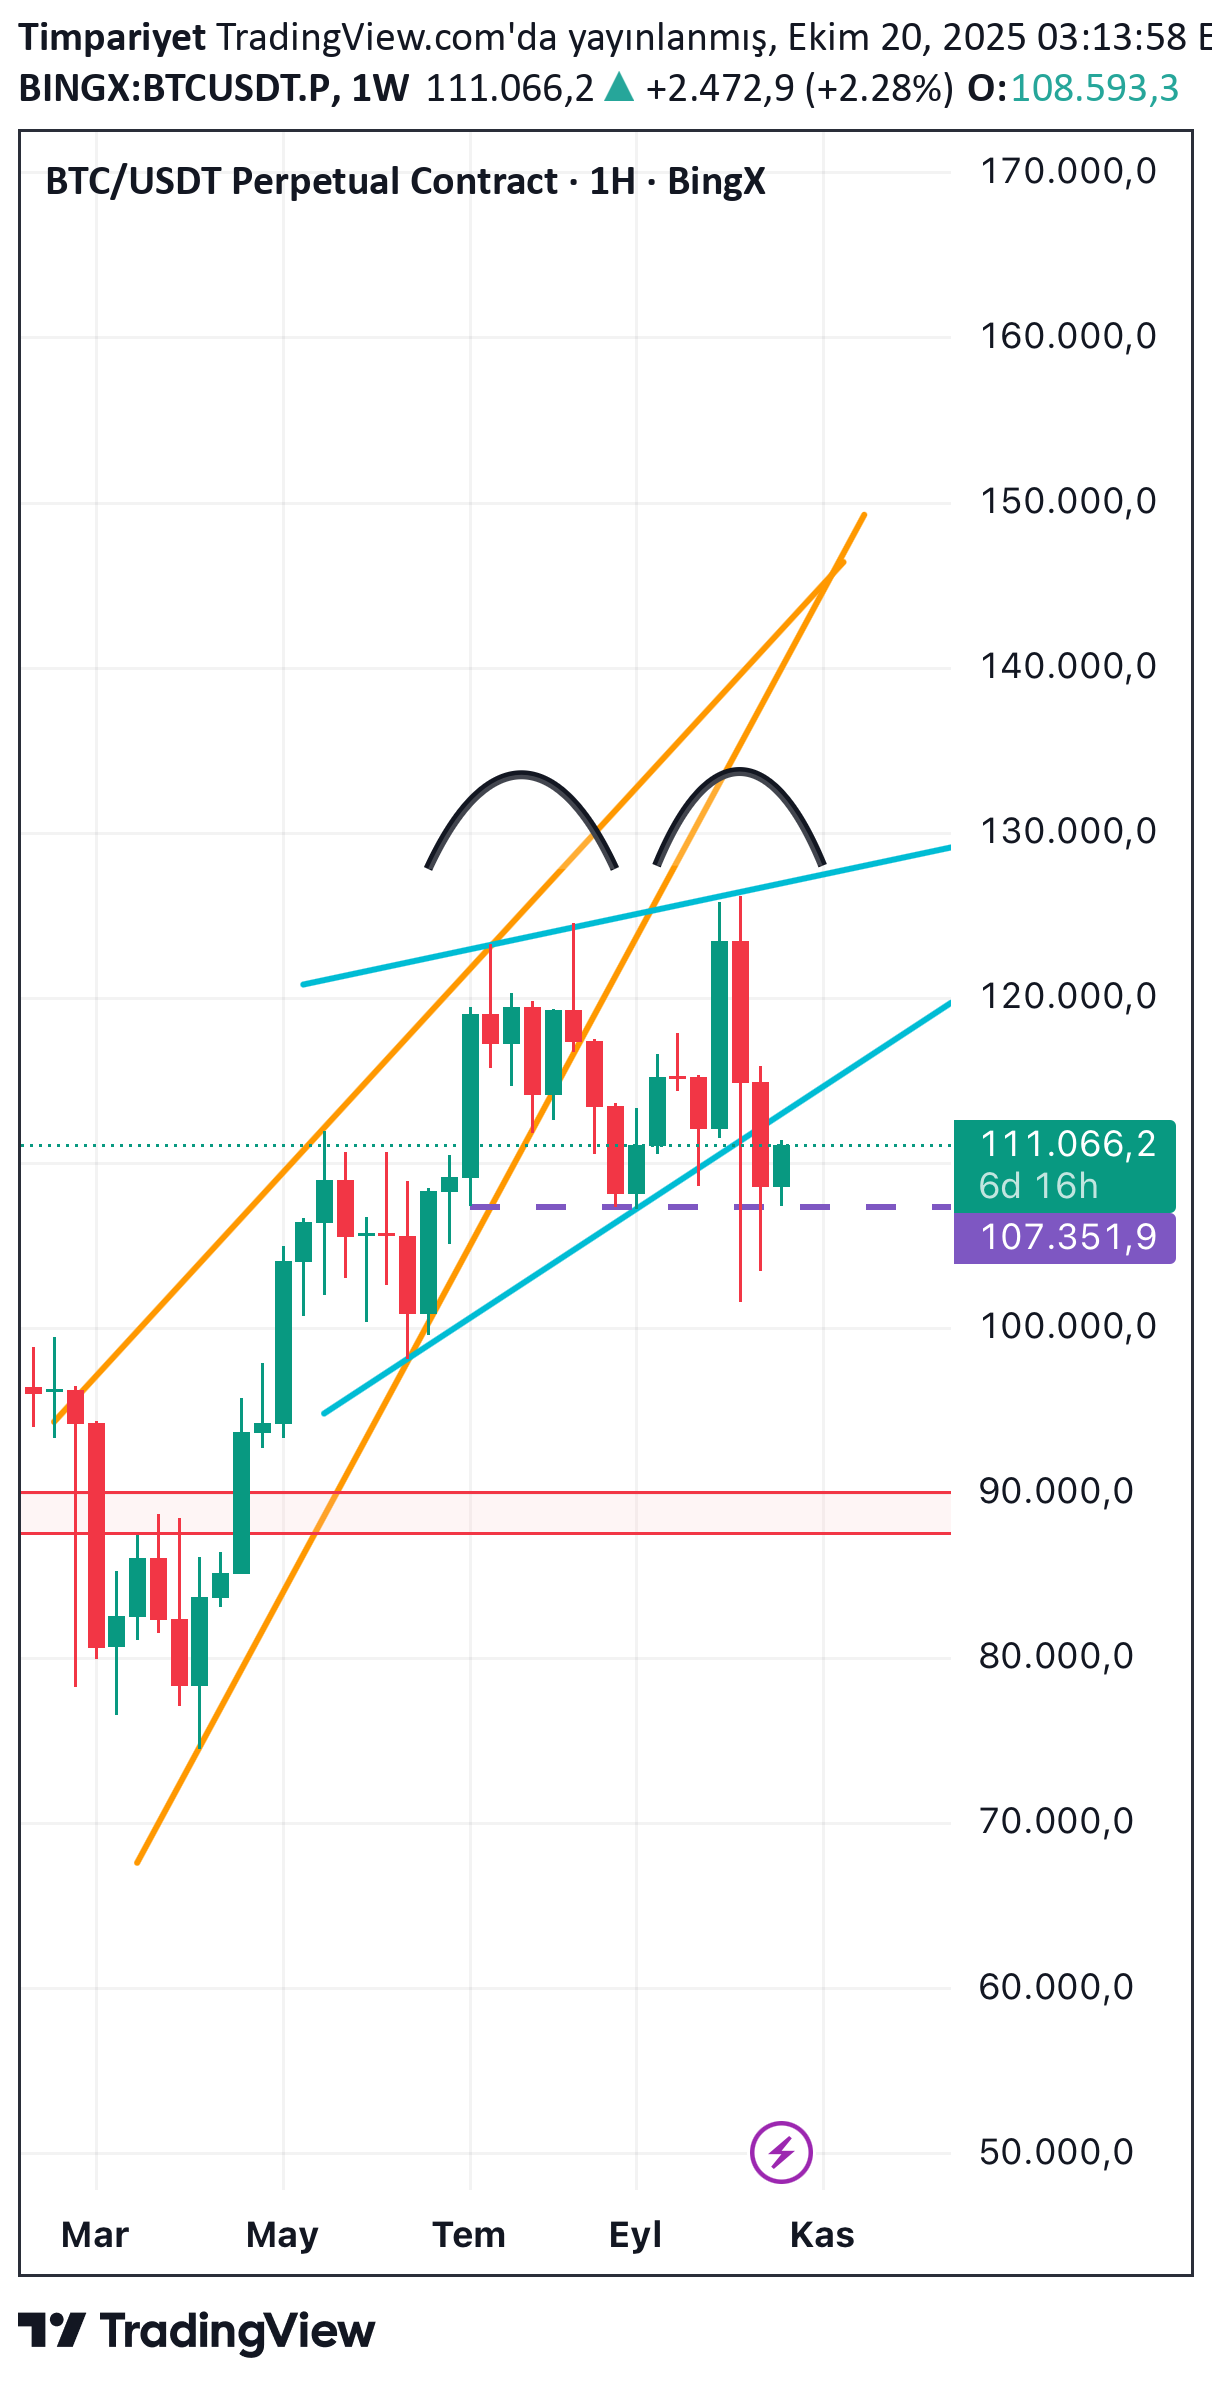
BTC There are two rising wedges on the weekly linear chart, one orange and the other blue, and both of them are broken down, both of them have a target of around 90K when measured. Moreover, when viewed from the wicks, there is an image that we can call a double top, although it is not exactly regular, and the neckline has not been broken yet. If a week close comes under the neckline that I showed as dashed, the double top may work, its target is around 90K when measured. So the answer to the question in the title is "90K". Well, is it certain? No, but if a week closes below the dashed line, the probability will increase significantly. So, is there any salvation? Yes, there may be. If the price breaks the alt line of the blue wedge upwards, enters the wedge again and closes the week, there is hope for salvation. On top of this, if there are two day closings above 115900, the probability of recovery will increase significantly. YTD
آخرین وضعیت بیت کوین در نمودار هفتگی: آیا بهای 100 هزار دلار در راه است؟
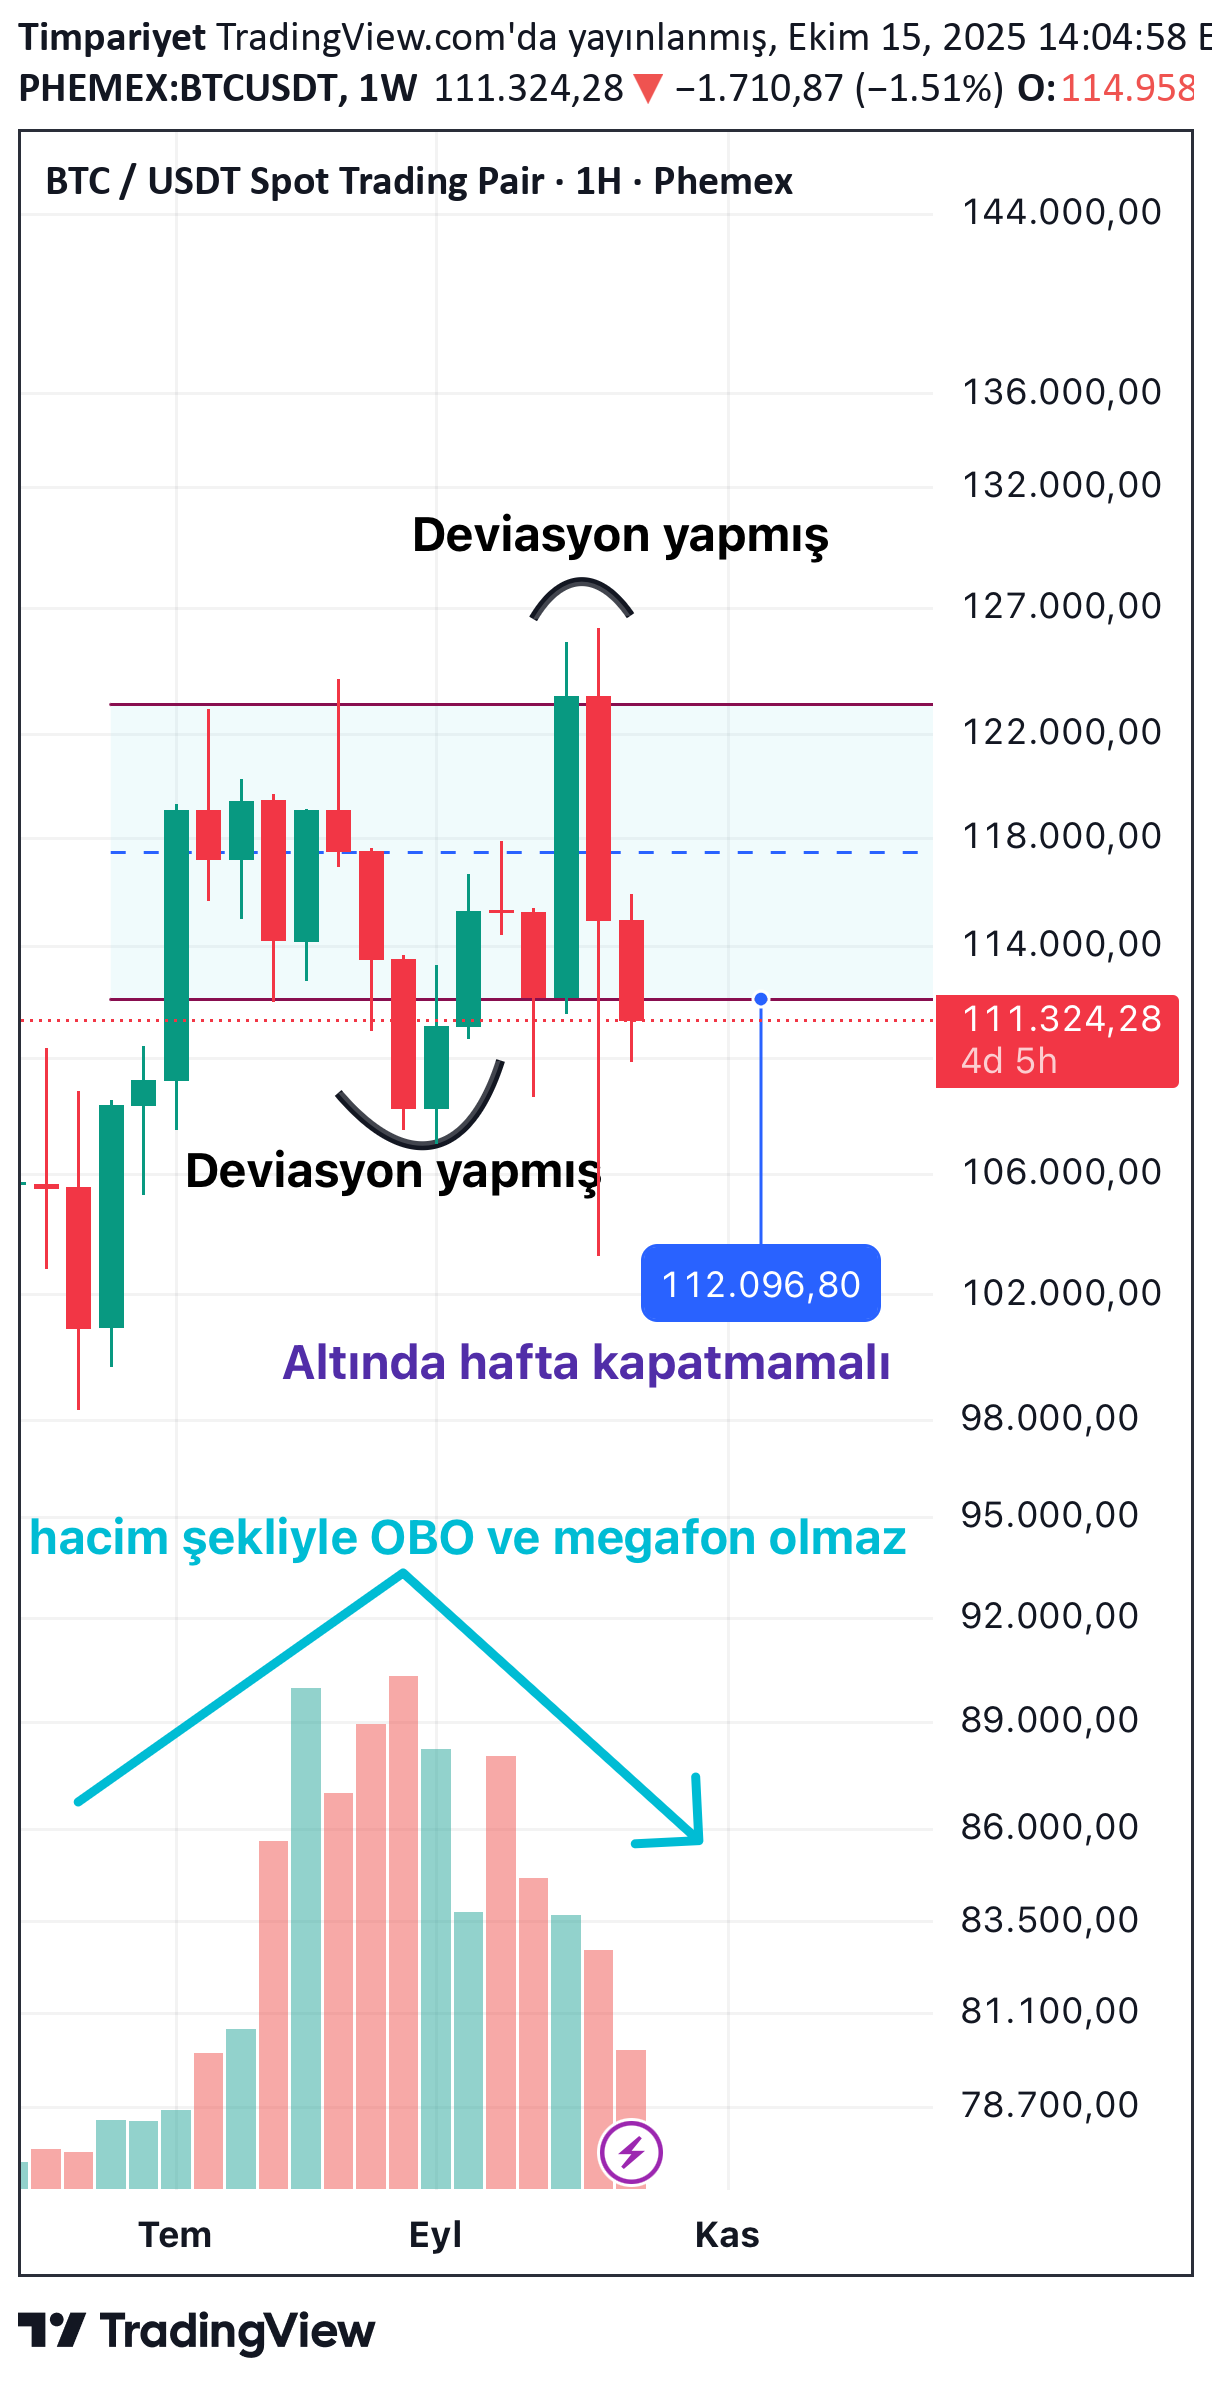
Most analysts look at the daily chart and talk about an OBO or a megaphone, but they always forget that these formations are not just about shapes. Although they are similar in shape, in order for an OBO to become an OBO and a megaphone to become a megaphone, the transaction volume must decrease throughout the formation. However, this is not the case in both cases. So there is no harm in looking at this as a weekly range. When viewed this way, this range has made a deviation movement both in the downward and upward direction. In such cases, a decrease or increase equal to the range width is expected in whichever direction the next breakout occurs. In this sense, a weekly close below 112100 is sufficient to trigger the decline. If this close comes, the target is around 100K. On the contrary, if there is a week closing above 123200 without this, the target this time is around 135K. YTD
BTC - Tipik bir Quasimodo yapmış
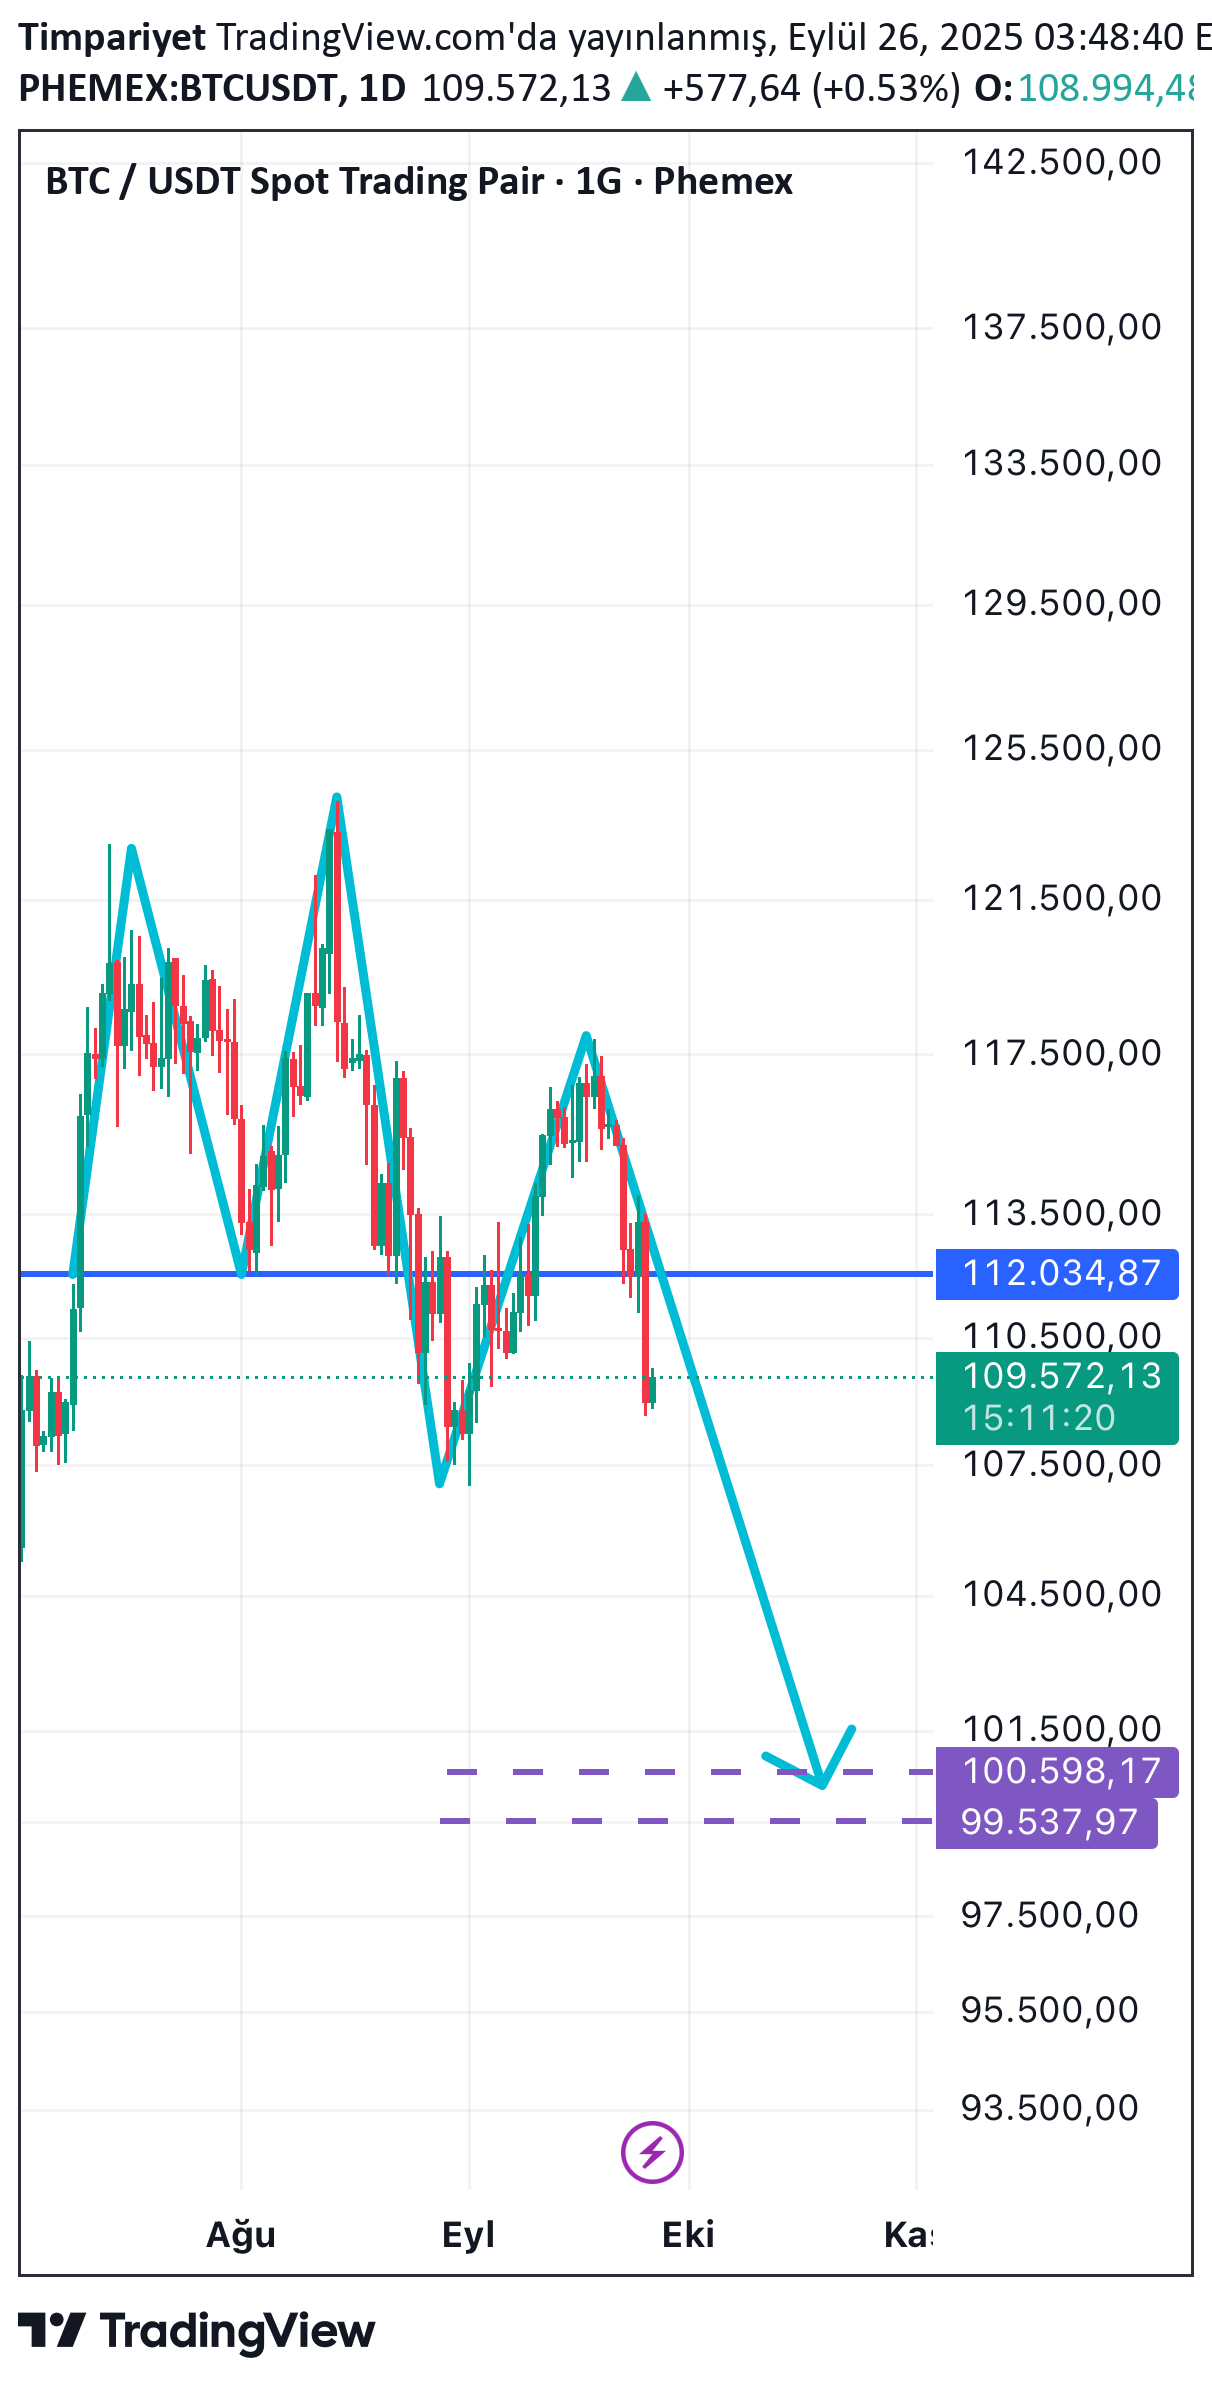
Most of the analysts, and I have escaped my attention so far, but BTC has created a typical Quasimodo formation and has broken the blue neck line down. Normally, the behavior of Quasimodo is as follows: The first decline does not go directly to the formation target and returns from one of the following supports (according to the graph or 106k, for example), this response rise usually comes to the neckline (it can wick on it, but usually cannot close the day). Then the main decline income and the price goes to the formation target (the region between the two -cut line in the graph). From there, the main rise usually begins Usually I say because this Quasimodo's sol shoulder is very close to the head, so that the other features are typical, although it is only atypical in this direction. In other words, instead of going down to the target, we can continue to rise by throwing feyk, and if the reaction rise exceeds the button line and we can understand if it closes for two days. The fact that BTC enters the rise trend is confirmed with one day closing over 118k. YTD
BTC Cypher yaparsa iş biter
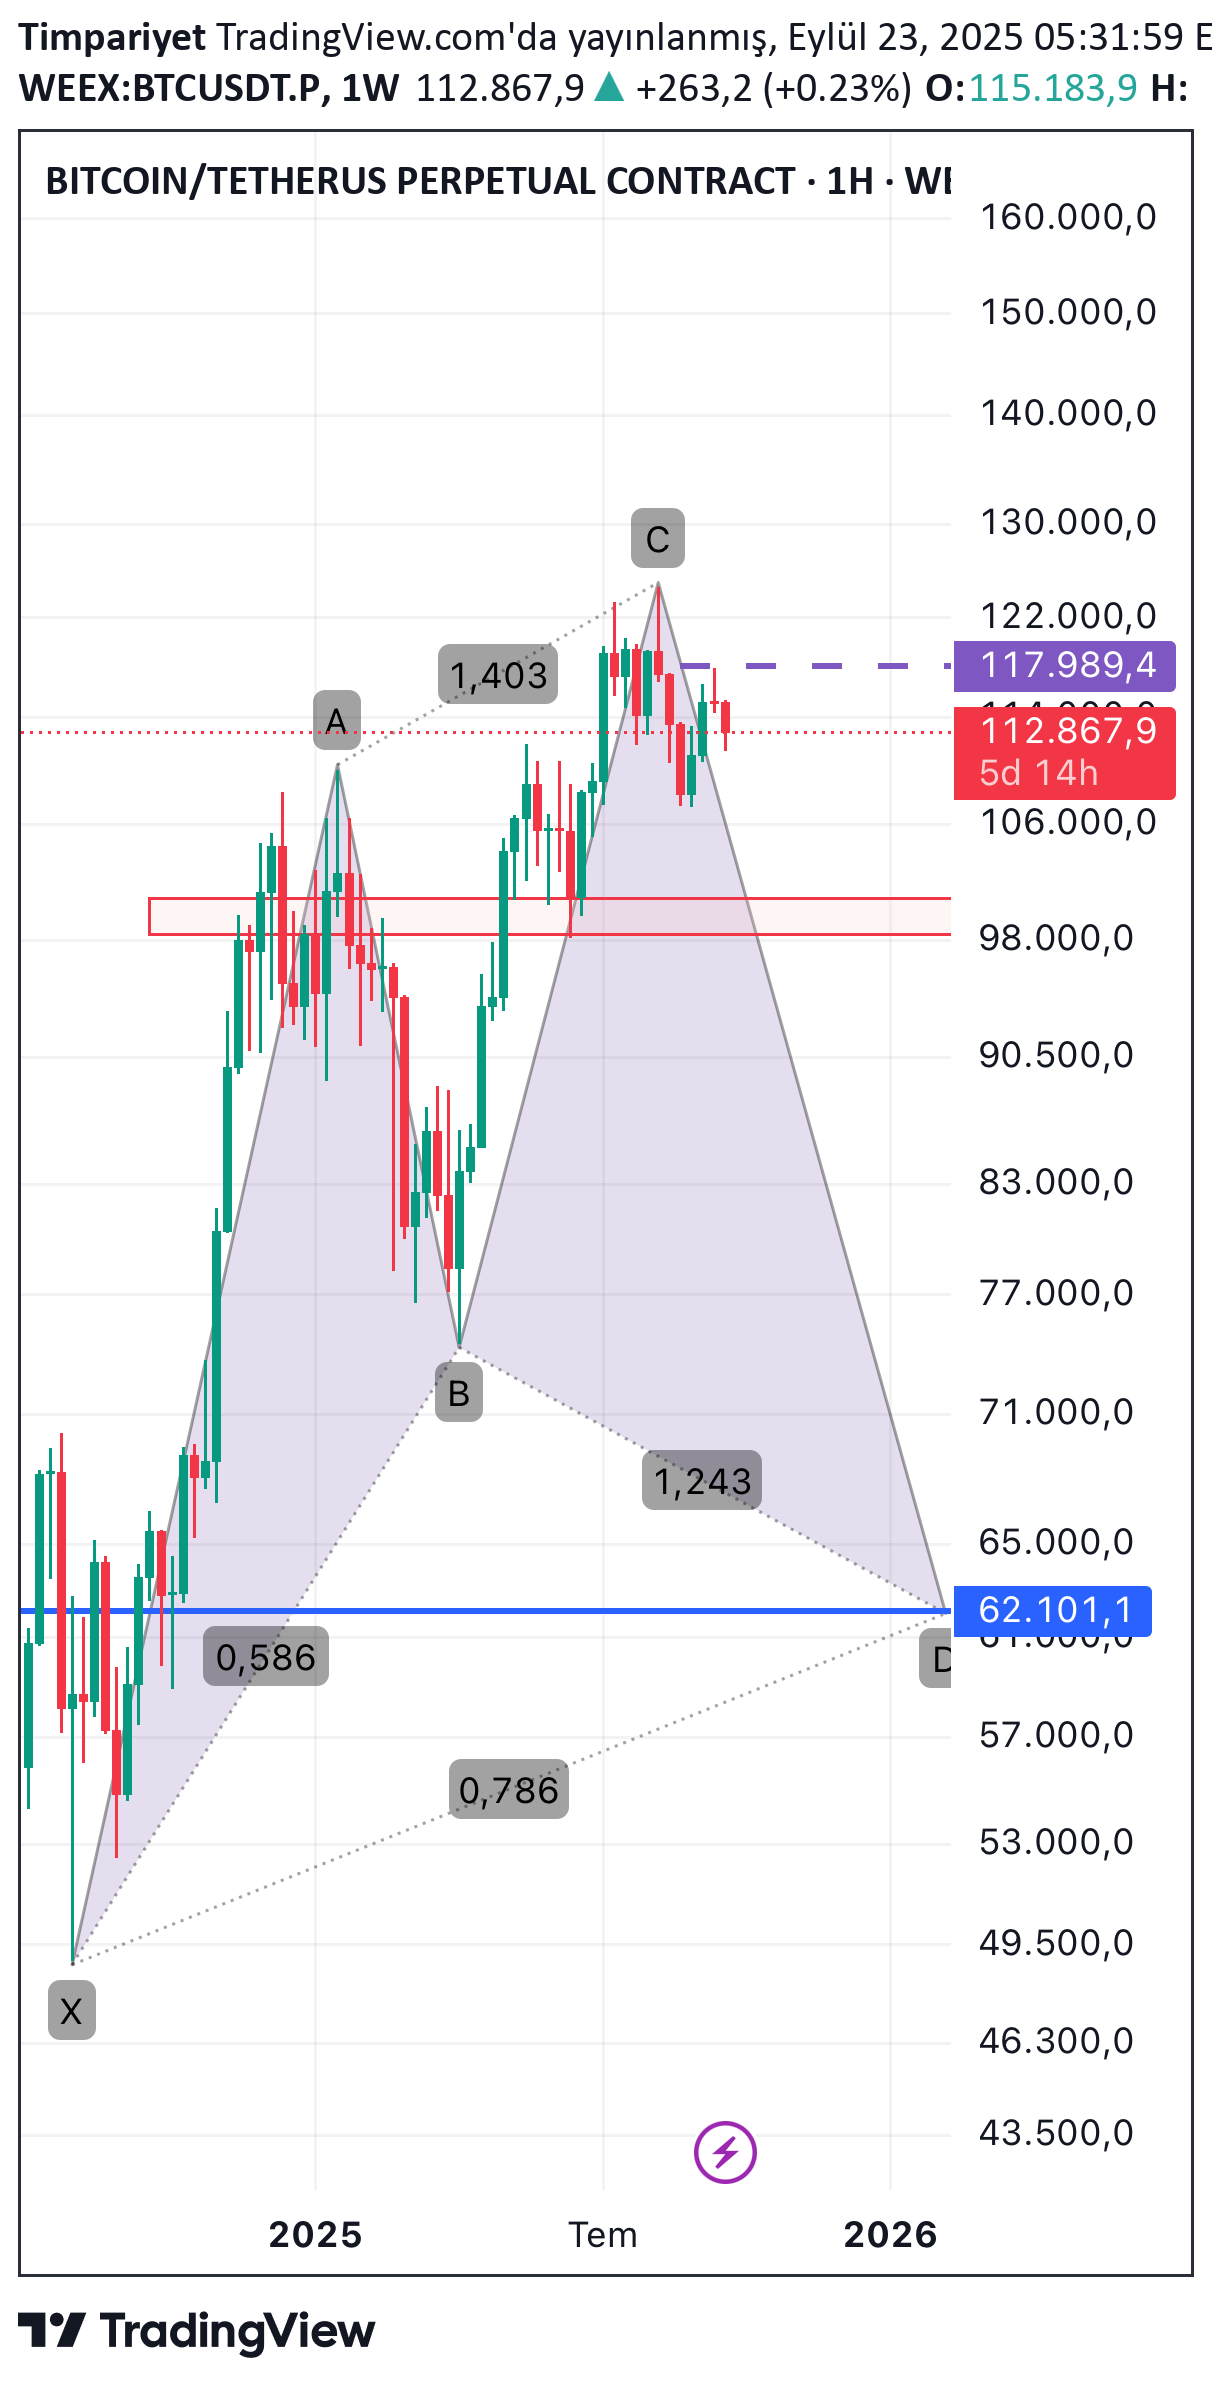
In the weekly graph, there is a possibility of a Cypher harmonic formation that is highly compatible with FIB values. But as you know, in harmonics, the position is not taken in harmony, the process is entered after the formation is entered. So this Cypher harmonic is just a possibility. If this probability closes over 118k over a week, it becomes disposed of and the probability of occurrence is reduced. If a week closing comes under 98K, the possibility of occurrence and the probability of the price to fall to 62K increases. My opinion is that this will not occur and BTC will rise to a region between 140-150k, but of course it will show time YTD
BTC 12S grafikte TOBO
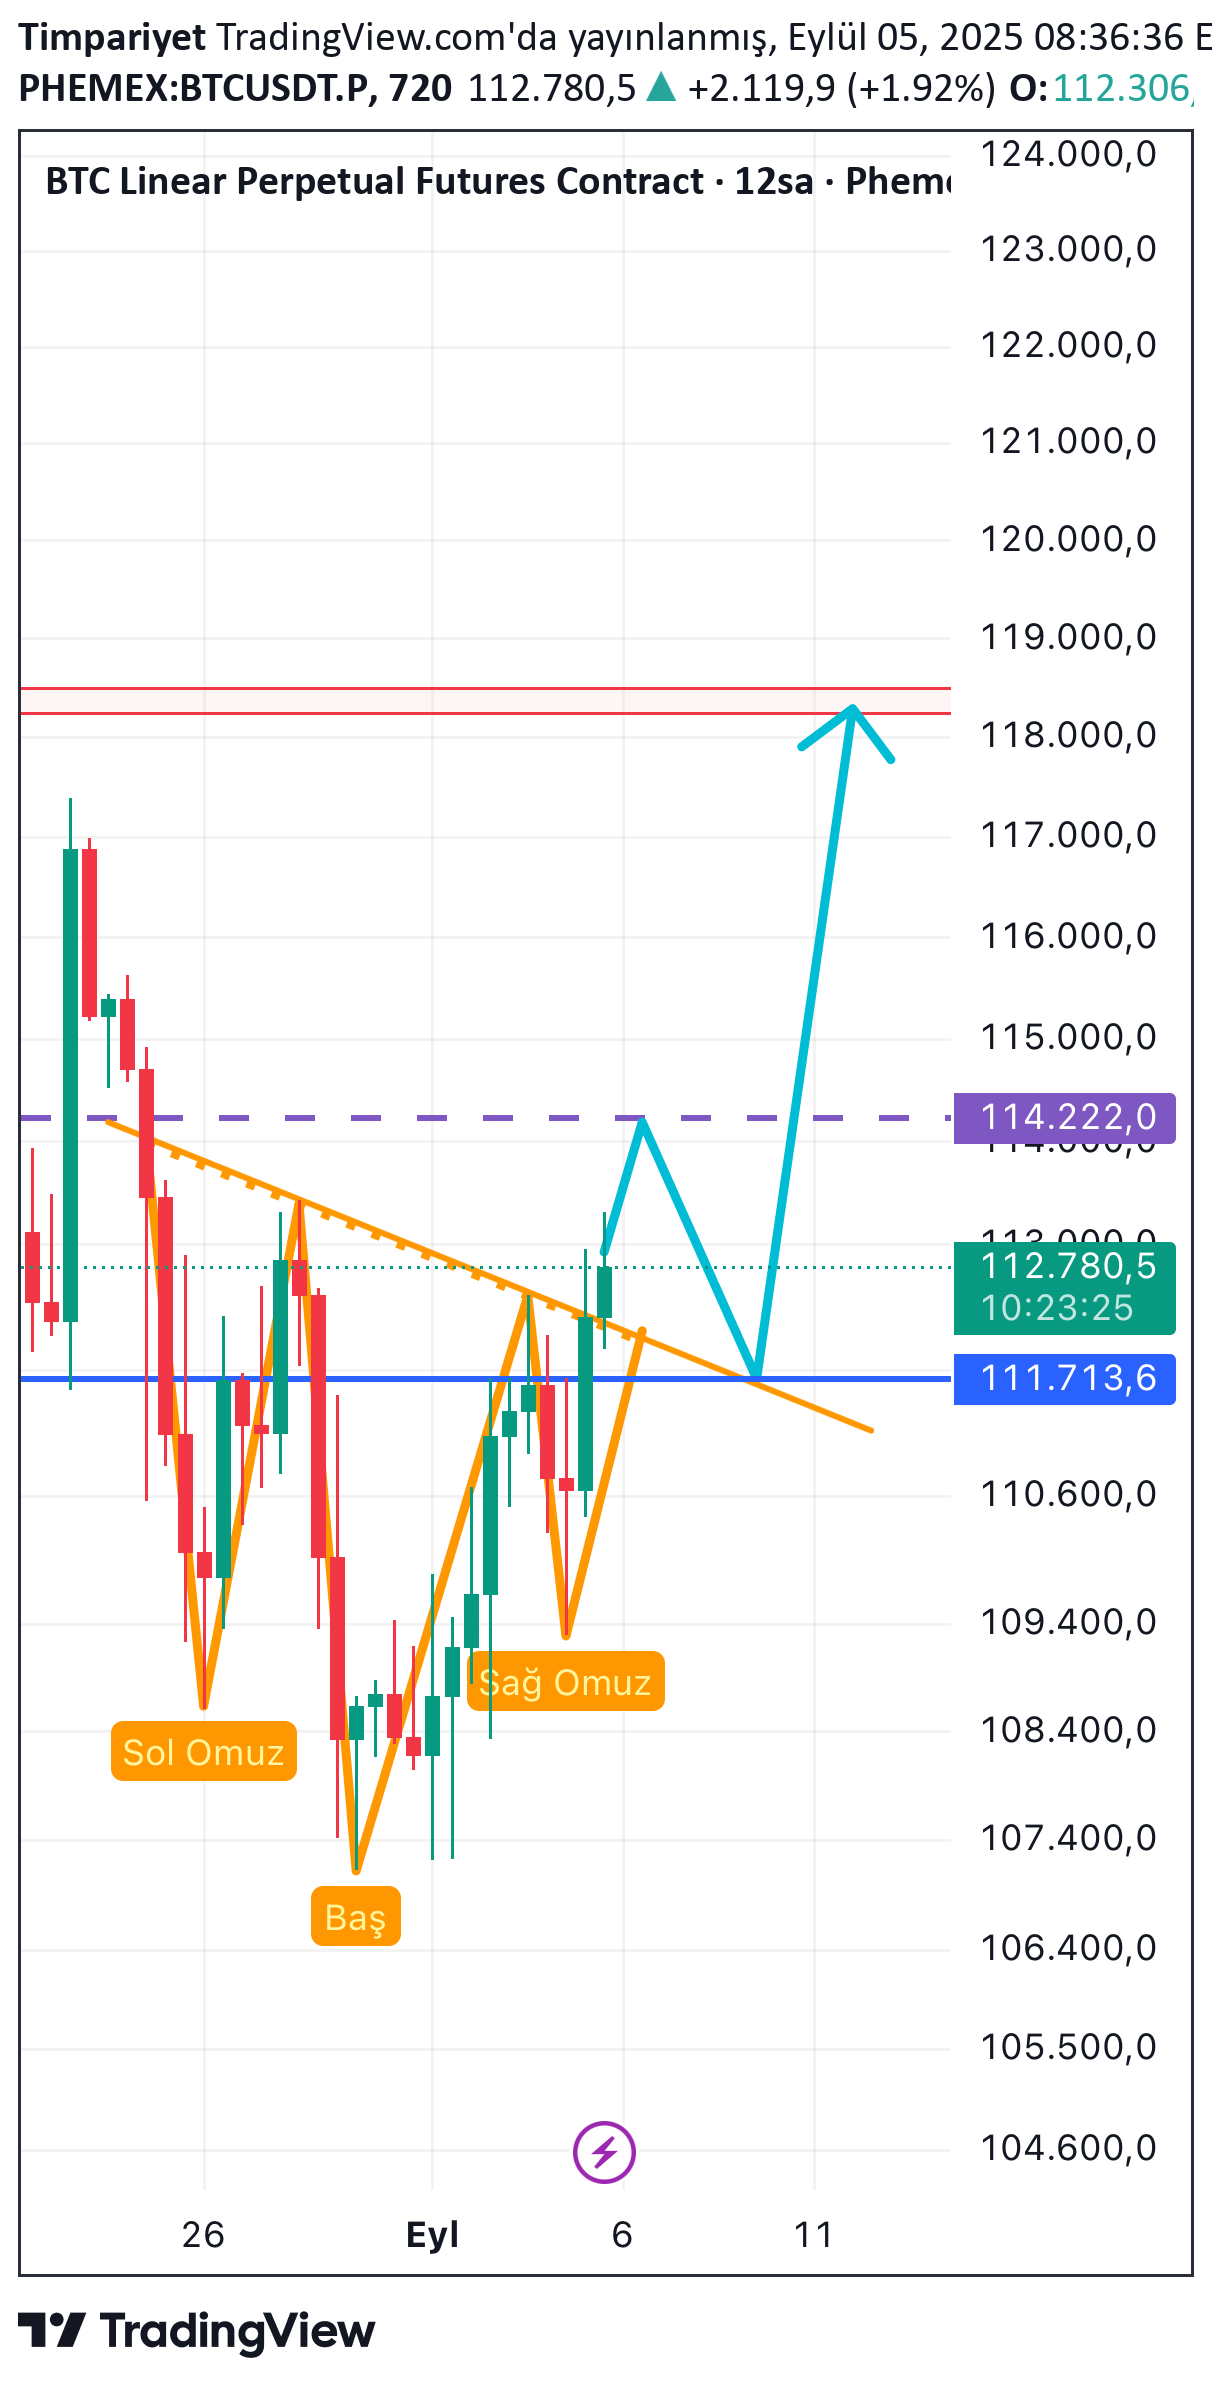
BTC 12 hours of candle graph a TOBO formation stands out. However, there has not yet been a 12-hour candle closure on the neckline, if this closing comes, it may follow the blue route I draw in the graph and give a retest to the neck line around 114200 and then go to the target 118300-118600 band. Of course, he doesn't have to do retest. In order to be active in this TOBO, a volume break on the neck line should be seen, and it may be troublesome to get aggressive longing without seeing it. YTD
Disclaimer
Any content and materials included in Sahmeto's website and official communication channels are a compilation of personal opinions and analyses and are not binding. They do not constitute any recommendation for buying, selling, entering or exiting the stock market and cryptocurrency market. Also, all news and analyses included in the website and channels are merely republished information from official and unofficial domestic and foreign sources, and it is obvious that users of the said content are responsible for following up and ensuring the authenticity and accuracy of the materials. Therefore, while disclaiming responsibility, it is declared that the responsibility for any decision-making, action, and potential profit and loss in the capital market and cryptocurrency market lies with the trader.