
ThinkingAntsOk
@t_ThinkingAntsOk

What symbols does the trader recommend buying?
Purchase History
پیام های تریدر
Filter
Signal Type
ThinkingAntsOk
I have been actively trading the market since 2019 without doing stupid things (only minor mistakes). Before 2019 I was trying to get rich fast, and of course, that didn't go well. One of the things I have been doing since 2019 was writing principles or key ideas regarding my trading journey. That includes significant mistakes or things I noticed about the fundamental laws behind price movements. One of those principles is patience. I would put this principle in my top 5 definitely (and I have more than 40 principles I have written since 2019) The principle: Whenever the market is not providing evident opportunities, DO NOT TRADE! Be aware that you will get anxious because of the lack of executions. However, remember that history has shown you that not trading during those periods was always the best thing to do. ------------------------------------------- Let's expand the previous principle. I have realized that you can not force the market to provide opportunities, and sometimes the market will not provide opportunities for extended periods (months). The first time this happened to me, I started getting anxious because I thought I was missing something, and I executed a lot of low-quality setups, of course, that finished in an absolute mess. That kind of behavior didn't happen once to me, but several times. And my conclusion always was that if the market is not providing clear opportunities, it was always best not to trade. In other words, I would have been better without executing setups. So, at one point, I asked myself. "How many more times do I need to experience this to understand that I should not trade if the market is not following the filters I have defined?". And in 2019, I decided that would be the last one. I'm writing about this because I didn't have a lot of executions lately, and I can feel that anxiety telling me, "DO SOMETHING, just trade." And at this stage I'm currently in, I do not follow those feelings anymore, but I keep following my trading plan. ------------------------------------------- Let me explain how this applies to two assets I like trading, SP500, and Bitcoin. On Bitcoin , I'm interested in developing bullish setups, and my filters are the ones you can see in the following image. However, if the price does not move as expected, I will not trade. And not trading is tricky because of the anxiety I explained to you before. On the other hand, we have S&P500 . Similar to BTC, the price has been falling, and I expect bullish opportunities to come. However, I will not risk one dollar until I see the current descending channel broken. ------------------------------------------- Lets Recap: As a swing trader, developing your patience and waiting for the best opportunities without trading in the meantime will save you a lot of money. Remember that you can not force the market to provide you with opportunities; you can only be ready to take action when those opportunities come. I hope this concept was useful. I mainly wrote this for myself, like a journal. If you have any concepts you would like to share in the comments; it's always a pleasure to read your ideas. Have a great day!
ThinkingAntsOk
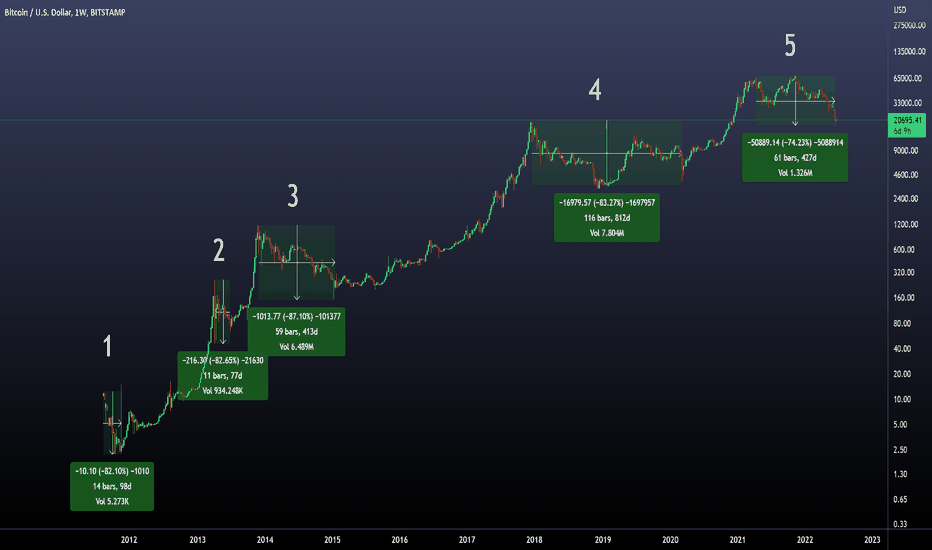
In today's post, I will do my best to bring an objective analysis of the current situation compared to all the available data we have on BITCOIN! Let's start with the current situation. How can we describe it? - On the 21 of April 2021, the bearish market started. From that point, Bitcoin never made a significant movement above that level. That's why I consider it the beginning of the correction. - 427 days have happened since that day (time flies, doesn't it?) - At the moment, the price is 74% down from All-time highs. That means that 10 thousand dollars bought on the top would be 2.600 dollars now (that hurts, for sure) ---------------------------------------- But how new is this situation? The answer is: not new at all! - Since 2012, Bitcoin has experienced the same cycle over and over again! which can be described as massive euphoria followed by massive fear, on a dance that, at the moment, keeps repeating. - To be precise, Bitcoin has crashed 80%+ more than 4 times since 2012, and we are about to reach the 5th if the price keeps falling a little bit more. - The good news! is that every time that happened, the price went back to the cycle of massive euphoria. That's why I'm writing this post because I have two assumptions that I would like to share: ---------------------------------------- Assumption number 1 (my least favorite): The cryptocurrency market is a massive Ponzi scheme that has been developing since 2012, and there will not be another time the price will make a bullish parabolic movement like the ones we saw in the past. Period, end of the story. If you are an investor, you are totally F, and if you are a trader, I hope you have a stop loss. (Alright, this is too dramatic, and I don't think that is the case, but hey! Maybe it is. Now let's go to my 2nd assumption). Assumption number 2 (The one I love): This is another correction of a cycle that, based on past behavior, I expect to keep happening. So, a bullish opportunity may be close based on the levels we are currently are. And there is a lot of money to be made if we are able to develop good setups. I will expand this idea with some charts. ---------------------------------------- I expect the bottom of this correction to happen in a range from current levels (75% decline) to a final decline of around 90%. I will use an old but effective way of detecting clear changes in trends: using trendlines (you can use the one you like the most, darling). The key aspect here is that I'm not trying to catch a falling knife, but I will be waiting for clear signs that a new trend has started. As you can see on that chart, I have defined the current situation and also the 85% and 90% levels. From any of those 3 scenarios, if I see the current descending trendline broken, I would say, "Hey, that's the first sign that a change in trend may be happening! (But I will not trade yet, because I'm not a FOMO trader) Let's take a look at the 2nd filter. The price must make a clear correction , as you can see on the chart after the breakout of the trendline. If that happens, I will set pending orders as I draw them on the chart. That's how I plan to trade, the next bullish movement. And suppose the bullish move never happens because Assumption number 1 becomes a reality. In that case, I will avoid getting exposure to the market, and in the worst-case scenario, I will have a stop loss in place. ---------------------------------------- Lets Recap. a) This is the 5th time this type of BIG correction has happened since 2012 b) There are 2 assumptions to make: One is the apocalypse of the crypto world, and the other is betting on the cycle repeating. c) Assuming the cycle continues, I will wait for the breakout of the trendline followed by a correction before trading. Otherwise, I will not engage in any setups. IF the price starts evolving as expected, I will bring more details regarding risk and all the elements regarding the execution of the setup. ---------------------------------------- Thanks for reading! I wish you all a great week, and of course, I love to read all your comments, whether you agree or don't.
ThinkingAntsOk
In every new post, I always like to explain that my views are not a statement of "This will happen." Instead, my posts should be interpreted as "We never know what direction the price will take" However if the price movement becomes bearish, this is how I will trade the market. Another important element to highlight is that my setups have a 50% win rate. That means that over 30 setups, I have 15 stop losses. So how do I make money if half of the time I'm wrong? The answer is: "Thanks to Risk to reward ratios." So, my win rate is 50%; however, when I win, I make 2 times what I'm risking on average. And that's the key. You must be prepared to see deviations from the average. For example, on a strategy with a 50% win rate, you will sometimes observe 6 or 7 consecutive stop losses. That's called Standard deviation (but we will speak about that in another post). This long introduction is made to develop a realistic view of a setup or a strategy and, in this case, my strategy. -------------------------------------------------------------------------------------------- Bearish Technical Perspective: a) The price had been moving in a range since the top in August 2020. b) 1 year later, in August 2021, we observed the beginning of a new bullish trend defined by the white ascending trendline c) Almost 300 days later, the price broke that trendline, and we observed a corrective formation. (A pullback) d) I never trade a structure without having a clear pattern. In this case, I see the ABC pattern. e) Another important element is that I never take a setup that I can not prove that the same concept worked in the past with the same or similar context. (Like this scenario in 2013)(It's important that you look for more than one scenario) QUESTION : Is this a guarantee that the setup will be successful? ANSWER: NO, it's not guaranteed. Let's take a second to speak about a good principle in trading. You can find evidence that something should evolve in a certain way; you can see a perfect scenario, literally a 10/10, and still have a stop loss. You are working with statistics. But don't get disappointed; if you only focus on 10/10 setups, you will see over a good sample that there's a clear edge. Final details about the setup: I'm risking 3% of my capital on the stop loss and aiming to make 6% in case of a take profit. The setup duration is expected to be 30 to 45 days if everything goes as planned. If I have a stop loss, that's it. So let your stop-loss gently take you out of the market. If the order is not executed and we observe bullish movements, I will change my perspective to trade long. Thanks for reading!I traded this setup on futures (MGC), and the price has already reached the target. Final Risk to reward ratio 2
ThinkingAntsOk
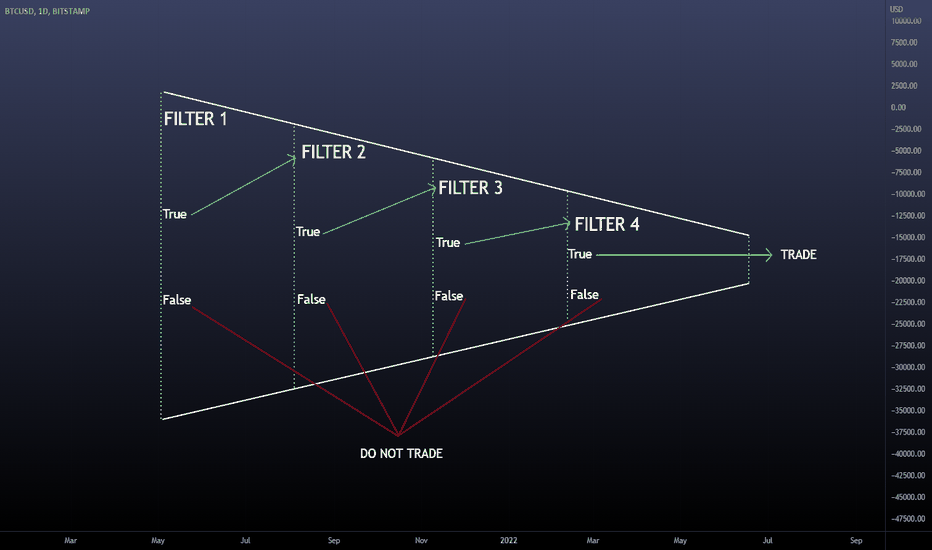
What are the parts of a trading strategy? I was doing a backtest on a new concept yesterday, and I realized the different parts of my testing strategy. At that moment, I became aware that the way I see any trading strategy is like an algorithm with several filters or steps. When those filters become "TRUE," we can check the following filter until we have a valid setup. Another way of understanding a trading strategy is like a funnel with different filters. At the end of the funnel, we have two possible outcomes. Outcome 1. You are allowed to set pending orders. Outcome 2. Do not place orders because one or more filters are not "TRUE." Why am I writing about this? Because it was clear to me that even if you are doing it consciously or not, every strategy is like an algorithm; it doesn't matter if you trade manually. In the end, your brain is taking the price and making it go through a funnel of filters. So my intention today is that by putting together those different filters/stages/steps I realized yesterday, you can try to see them in your strategy and make improvements to your system or maybe become aware of something you have been doing. It's important to say that this is a template, maybe you are using 2 filters, or perhaps you are using 5. The key point is understanding the step-by-step process that systematic strategies follow every time a setup is developed. -------------------------------------------------------- FILTER 1: GENERAL CONTEXT The most probable thing is that your first filter is about general context. What we are trying to answer here is, "Are we in a valid place for the strategy or not?" Some examples can be: - The price must be in contact with a support/resistance zone. - The price must be above/below (a certain technical level) - The price must be on a drawdown of (time) (TRUE / FALSE)?. IF true, proceed with the following filter; IF false, you are not allowed to trade. -------------------------------------------------------- FILTER 2: SPECIFIC CONTEXT. Now that your first filter is TRUE, the most probable thing is that you are using the 2nd filter regarding context; this is pretty similar to the previous filter but happens after the first one is true. Example: - Moving averages should be in the following order... - The price must be above/below (a certain secondary technical level) - On a lower timeframe, the price must be (technical condition) (TRUE / FALSE)?. IF true, proceed with the following filter; IF false, you are not allowed to trade. -------------------------------------------------------- FILTER 3: FINAL CONTEXT BEFORE THE TRIGGER. Here you will be paying attention to the final filter before the trigger; this is the last thing that, if TRUE, you will be able to wait for your trigger. Example: - A technical indicator must be overbought/oversold. - Volume at a certain level should be... - I need to see a divergence. (TRUE / FALSE)?. IF true, proceed with the following filter; IF false, you are not allowed to trade. -------------------------------------------------------- FILTER 4: THE TRIGGER All the filters are TRUE, and we are allowed to wait for the last thing before executing a setup, "The Trigger." Your trigger is a set of parameters that will enable you to place pending orders. Let's take a look at some of them: - Candlestick Patterns - Technical Structures (like Zig-Zag, Triangles, Irregulars, Flat, etc.) (TRUE / FALSE)?. IF true + Risk to Reward ratio is aligned with the minimum requirements. Then set, Entry level / Stop level / Break-Even level / Take Profit level. -------------------------------------------------------- My conclusion: If I understand the different filters I'm using on my strategy, from general to specific ones, it becomes straightforward to make improvements or detect elements that require fixing. Instead of saying "My strategy is not working" or "My strategy requires improvements," we can say: My trigger is excellent. However, my filters regarding general context are not on point so I will work on that. Understanding the parts of your trading strategy, like parts of an engine, will bring you insights into what you are doing. Try to see your system as a series of gears working together. Thanks for reading!
ThinkingAntsOk
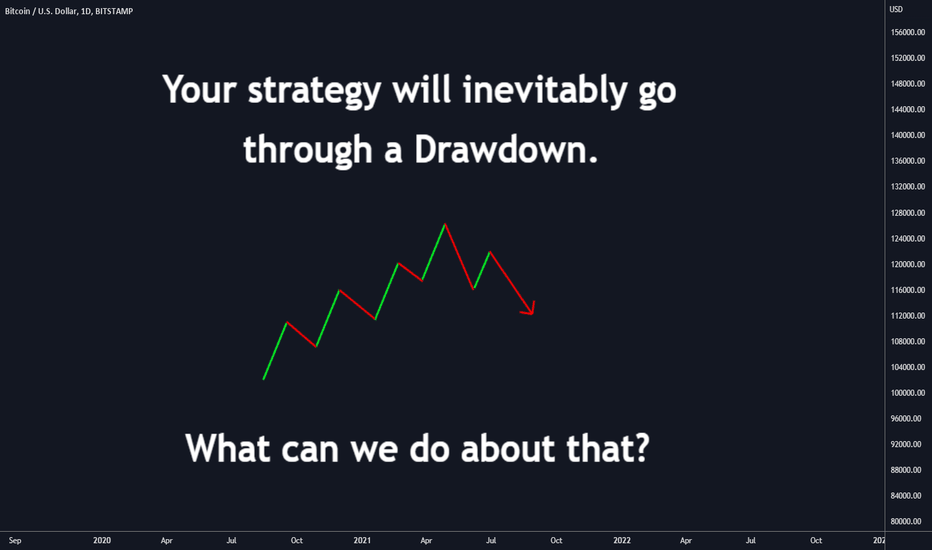
Your strategy will inevitably go through a Drawdown. And there's nothing you can do about it to stop that. However, you can learn how to survive it! Today I will give you actionable steps, that you can use for the next time the market hit your strategy and you feel that everything is going wrong. Let's start with an idea of what a drawdown is, and why drawdowns happen. There are an infinite amount of trading strategies and tools that people use to trade and take advantage of specific market conditions. Some traders are better in trending markets, they trade breakouts. Other traders feel more comfortable in ranging markets, where they trade quick reversals on key levels. The Math is simple here. Trending strategies will have a poor performance on ranging markets, while reversal strategies will have a poor performance on trending markets. Detecting the beginning and end of trending cycles or ranging cycles, is blurry. So, if you agree with that, as I do, you can expect your strategy to start failing at some point. And that's the beginning of the drawdown. (This is true for the best traders in the world, as for the worst traders in the world. Nobody scape drawdowns, the quickest you accept this, the faster you can learn how to handle them properly) So let's start by saying that drawdowns are situations where your strategy experiences a lasting decline in performance, even if you are doing everything perfectly. Drawdowns, happen because strategies are made to take advantage of specific anomalies that can be found in one part of the market cycle, and when that market cycle finishes, or changes, your strategies become less accurate. -------------------------------------------------------------------------------------- It's important that you become aware of the Psychological consequences of Draw Downs , so you can have a countermeasure for this. Let's take a look at the most common ones: 1) Decrease in confidence (constant negative thoughts about your system) 2) Fear of entering the next trade. 3) Thinking about changing things in your strategy (deviations from the original plan) 4) Thinking about modifying the risk you are using to cover losses quicker. 5) Ceasing your trading execution, and looking for a new strategy. ALL THESE ITEMS, are the main situations you may start feeling when going through a drawdown. IF you are going through that, it's important that you understand that you are under a delicate emotional state, where your confidence is low, and you are prone to make more emotional decisions that 99% of the time, tend to increase the drawdown. So the way we handle drawdowns is by having logical and systematic processes in place instead of emotional ones. -------------------------------------------------------------------------------------- Here you have actionable steps to handle drawdowns: STEP 1 : You handle drawdowns by getting ready before they happen, not when they are happening. This is true for almost all disciplines, not only for trading. Airplanes have clear plans in case things start going wrong, instead of figuring out the problem at the moment, pilots go to the manual book, and use the template for this situation, plus the fact that they trained those situations several times in simulations. So, if you want to understand what a drawdown situation looks like in your strategy, you MUST go into the past, and when I say this, I'm not saying making a 3 week backtest. You need to go as far as you can in the past, to find that exact moment where your strategy is not working as expected. How many consecutive stop losses do I have? 3? 5? 15? 20? How long does this period last until everything goes on track again? 1 month? 3 months? or a year? These are the kind of answers you are trying to solve. When doing a backtest you are trying to understand two things. The first one is if your strategy has an edge. The second one is how hard you get hit when things go wrong! STEP 2: Work your risk management around the stats of your system. Imagine we reach the following conclusion "I have a system, that executes 10 setups per month" and the worst-case scenario I have found is 20 consecutive stop losses during 2 months. What I would personally assume is that 20 consecutive stop losses can be 30. So how much capital percentage should I risk on this system so I don't get knocked out if this TERRIBLE scenario happens. The answer for me would be 1% per setup. Under the assumption of this unique scenario, I would be 30% down, which is something acceptable, compared to the drawdown of conventional investment vehicles like S&P500 where we observed those kinds of declines, in the last years. The main point here is that you need to adapt the risk you are using on the strategy, to the stats of it, and your risk tolerance. -------------------------------------------------------------------------------------- Let's recap the key aspects of this post. 1) Drawdowns are inevitable, your strategy will be hit by this scenario eventually. 2) Drawdowns cause an emotional disturbance and are the main reason why people make really bad decisions. 3) We handle drawdowns by getting ready in advance. Through backtest, we can understand the edge of our strategy and the worst-case scenarios. 4) We adapt the risk of our strategy, by considering a terrible scenario, like 30 consecutive losses. This will not eliminate the feeling during this period, but it will bring you a work frame to make logical decisions based on data, instead of emotions. Implementing this type of thinking will make your strategy more robust, it will help you go through these situations, and most importantly it will protect you from making stupid things with a strategy that has an edge, and actually works! Thanks for reading!
ThinkingAntsOk
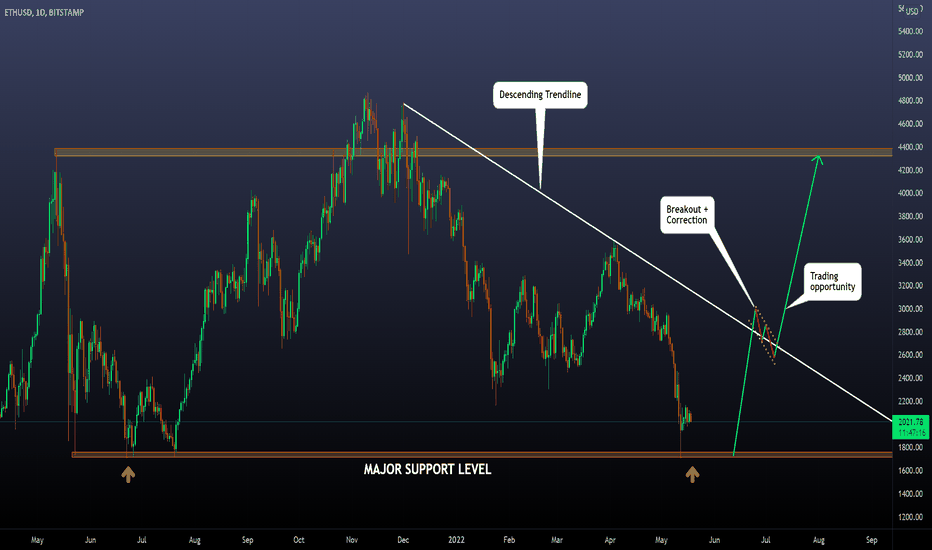
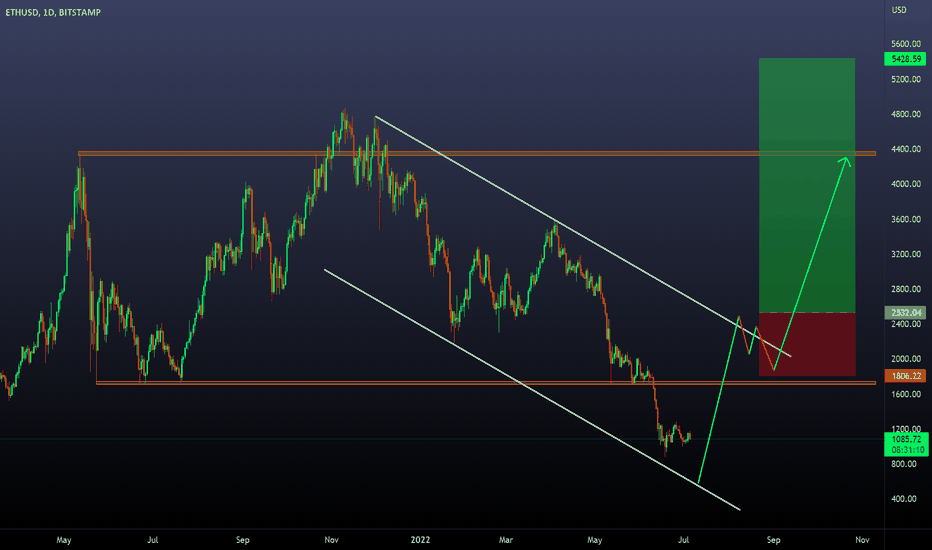
IMPORTANT: I'm not saying that this scenario will be the same. As a trader, I consider my job, to find objective patterns in historical data, and define if those patterns are happening right now so I can create a trading setup before that situation is happening. IF the situation is not evolving as expected, I must try to avoid opening positions on the market, and in case I do open positions on the market and the situation goes against me, is also my job to cut losses and protect my capital. With all that said, let's start with today's post. The title of today's post is "All bull runs in ETHEREUM started with a double bottom" . To see if that's true, let's take a look at the logarithmic chart. There we can see 3 clear bullish waves , but now we will focus on the conditions before that happened. The conclusion that I can make is that is a consistent pattern, to observing double bottoms before new bull runs, and that's the same scenario that is happening right now. Does that mean that we will observe the same resolution? Let me write the answer in capital letters: NO IT DOESNT MEAN THAT . Remember that nobody knows what the price will do next, so my objective with the 2nd part of this post is: In case the price evolves in the same way. How can I trade that? and IF the price does not evolve in the same way. How can I avoid entering the market? Let's start with the 2nd part of the post: Possible Setups. So, what I did was go through all the situations that were defined before, and I created a template for the setup I'm planning to take. It looks like this: It's composed of 4 filters: 1) We need to observe a double bottom 2) We need to observe the most relevant trendline of the current broken. 3) We need to observe a correction that retraces around 0.38% of the previous impulse 4)IF that happens, I will set pending orders on a new local high, stop loss below the end of the correction, and as a minimum target, I will define the previous ATH zone. The risk I will be using on this setup is 3% of my trading capital on the stop loss. It's very important to say that I don't care what the price will do next. I'm sure that if the filters that I have defined before happen, I will trade, otherwise, I will not develop new positions. I hope this post was useful, feel free to share your view and charts in the comments! It's always great to have a positive discussion about ideas. Long life, to the tradingview community :D
ThinkingAntsOk
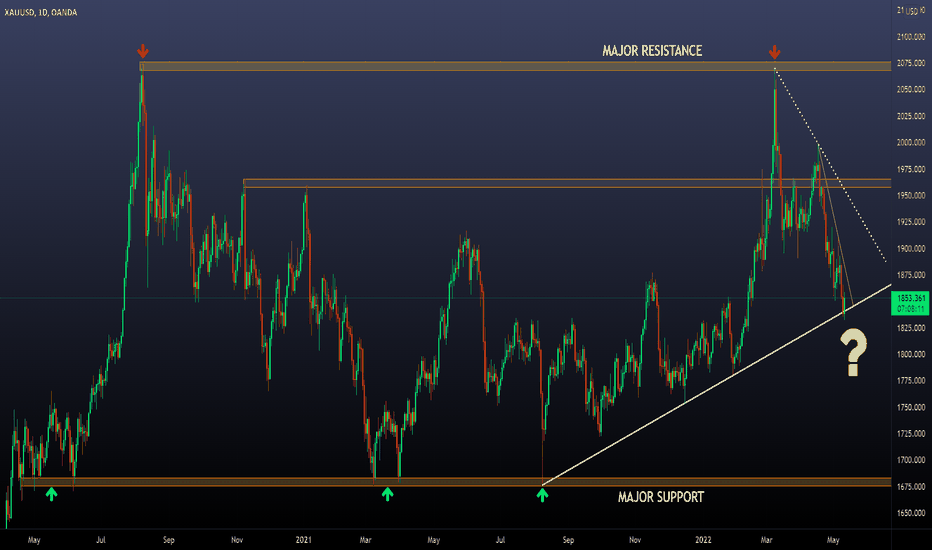
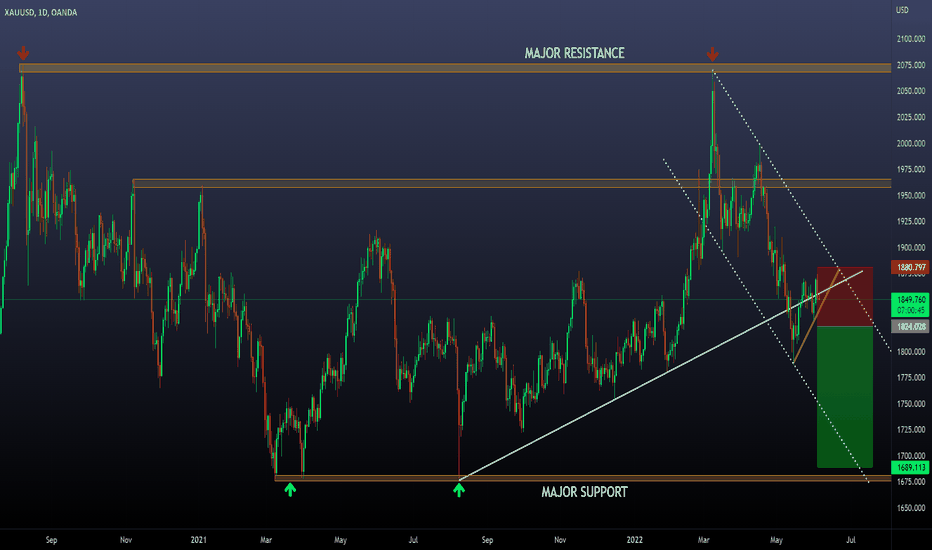
On gold, we have observed contact with a daily trendline. What's next from here? Today's post is about understanding the importance of thinking in terms of multiple directions and outcomes. Most of the time we focus only on one direction. "I think this is Bullish" or, "I think this is Bearish" But what if that's not the case? Do you have a plan to follow in case the price does not move in your main direction? It's important to develop this because if we have a strong bias for one side of the chart, we may miss great opportunities that come in the other direction. The title of today's post is 3 possible outcomes I'm expecting on XAUUSD. Let's go one by one. Scenario 1: Bearish Resolution Scenario 2: Bullish Resolution A Scenario 3: Bullish Resolution B -------------------------------------------------------------------------- All these scenarios are situations that I tested in the past and that which I found an edge on them. But remember this: NEVER trust me, it's your job to look into historical data, and confirm these anomalies. Confidence in trading comes when you see things on your own. Thanks for reading! Feel free to share your ideas, charts, and doubts in the comments.
ThinkingAntsOk
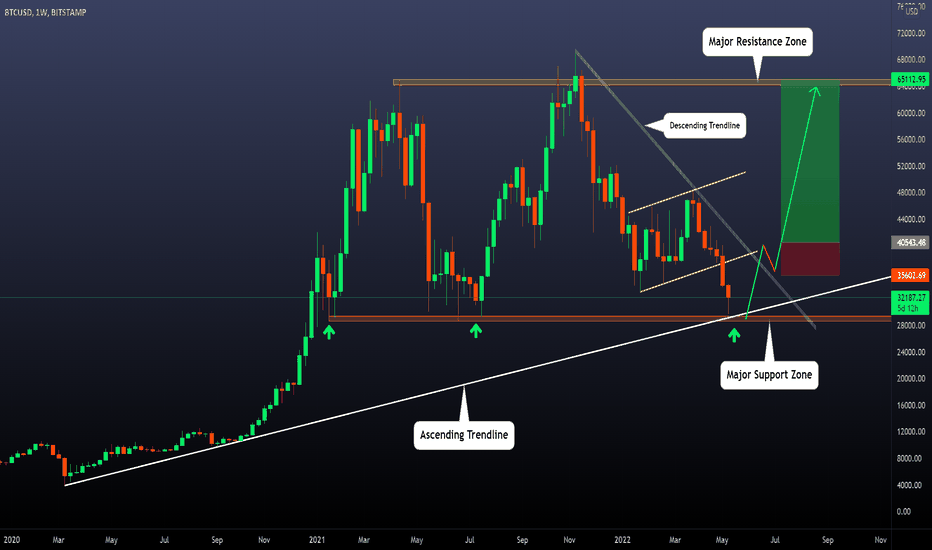
I have been waiting several months for the price to reach the major support zone, as the main target for the bearish movement. This creates a clear ABC pattern as you can see in the next picture. But, what does this mean? It means that the price has reached a level where we observed bullish pressure and that caused the beginning of the previous bullish wave. Is this any guarantee that the price will behave in the same way? ABSOLUTELY NOT. However, what we are trying to do here is something like this: - IF the price behaves in the same way as before. How can I develop a setup that takes advantage of that movement? - IF the price does not behave in the same way as before. How can I avoid opening positions in bitcoin? To answer both questions, I have defined the following filter to develop bullish setups: a) The price reaches the Major support zone (Checked) b) The price breaks the descending trendline (Pending) c) The price makes a correction (3 to 5 daily candlesticks) after the breakout of the trendline (Pending) d) IF the price makes a new high after the correction I will open positions as you can see on the main chart of this post. (Pending) As you can see I need to wait for a lot of factors before risking my money. The pros of this are that you engage in high-quality setups once all the filters happened. The negative thing is that sometimes you will miss setups. However, you can optimize this if you study past behavior. Let's dig into the last 3 important details. How did I come up with that filter? What's the risk I will be using on that setup? How much time am I expecting for the execution of the setup, and the evolution of it? The filter: When I define a filter what I do is: FIRST, understand the current context in terms of shape, % decline, and duration. With that clear, I go into the past and look for similar situations, IF I can see a clear pattern in all those situations, then I define it, and then I wait for it. The main tool I use for this is the logarithmic chart which allows you to see all the historical movements in terms of % movements. The Risk: I will be using 3% of my capital on the stop loss. That means that if my entry is executed and everything goes wrong, I will assume a 3% loss on that setup. However, I'm looking to make almost 5 times what I'm risking. (That's my edge) The time: I think we are at least 1 month away to see the breakout of the descending trendline. And for the evolution of the setup in case, everything goes as planned. I expect a two-three months evolution. Alright, thanks for reading! My idea was to share with you my processes when I develop setups. If you have any doubt feel free to ask in the comments or share your charts and opinions as well.
ThinkingAntsOk
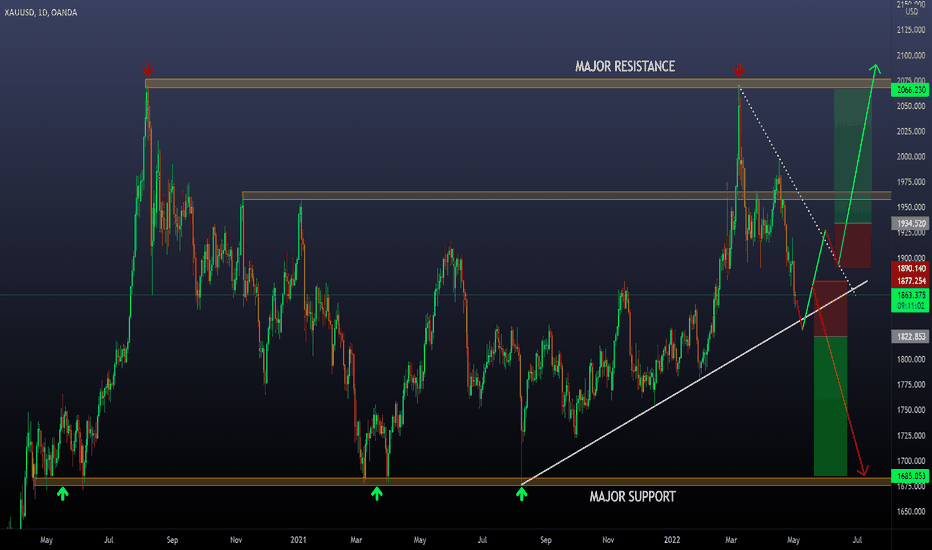
Last month I was stopped out on a bullish setup on gold, that was looking to get exposure to a new bullish movement above the previous all-time high zone. However, the setup didn't go as expected and my stop loss was triggered. Remember, always let your stop loss gently take you out of the market, and assume that controlled loss. Now is time to redefine the next possible setup I will be taking on the precious metal. Current context: a) The price is between a major Support and resistance zone, with inner support & Resistance level. b) Regarding trendlines we can see two. A bullish trendline, and a bearish trendline. Both represent the levels where we can start thinking about new setups. In the meantime, while the price is between them, I will avoid trading. Let's understand the possible two swing setups I'm interested in taking. Bearish Setup: Bullish Setup: As you can see, both scenarios wait for the breakout of the descending trendline, followed by a retest. Positions get open on a new high/low. Stop loss is defined on the high/low of the retest. Target is defined on the next major support/resistance zone. All of them provide a risk to reward ratio above 2. At the moment none of the two scenarios is defined, and patience is a key element to apply here. AVOID trading, if the price is not following the filters you have defined. That will help you improve the quality of the setups you get exposure to. Thanks for reading!
ThinkingAntsOk
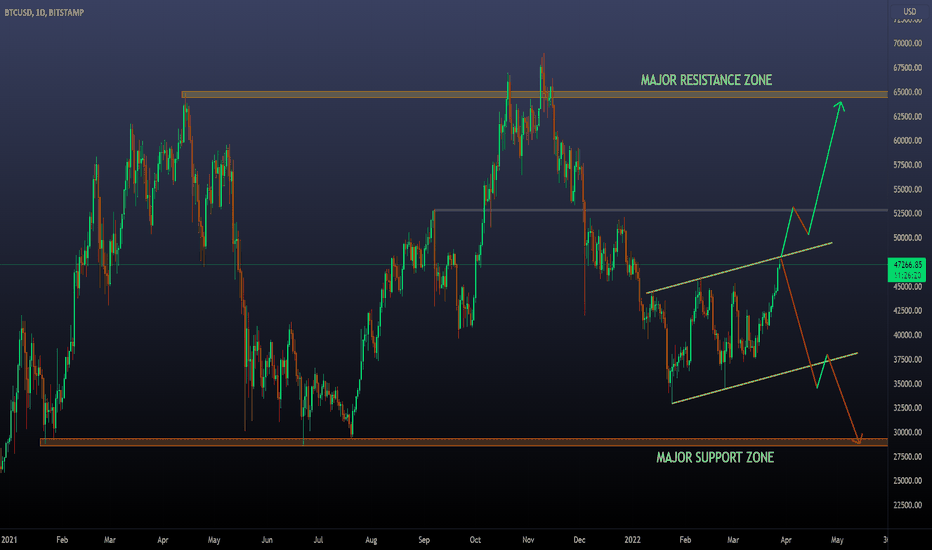
Today I will analyze the two most relevant assets in the crypto world. Bitcoin and Ethereum. Let's start with the Bitcoin chart. When analyzing a chart, the main thing I look at is answering the question, "What are the main levels on the chart?" I try to answer this first because the price tends to move from one level to another in the same hierarchy, making retracements or corrections on minor levels. Generally speaking, this rule tends to work pretty well. The answer to this is the major support and resistance levels; the price has been inside that range since January 2021. For the last 2 to 3 months, the price has been moving sideways between 46K and 33K, and now we are observing bullish pressure that is interesting to analyze. So what am I expecting from here? From a textbook perspective, the price should reach the major support zone before starting new long-term bullish movements (Following the principle that the price moves from level to level). However, as you already know, the market gives a .... about what the price "should" do. That's why it is also important to understand what may happen if the price does not reach the support level. IF that's the case, I think we may observe a movement towards the previous major resistance zone, with corrections happening around 52.500, where we had a minor resistance level in the past. Alright, this is my analysis. Now, what about the trading opportunities I'm waiting for . Regarding setups, I will only develop setups in two scenarios. Scenario 1: The price reaches the major support zone; if that happens, I will be allowed to define bullish filters and trade towards the Major resistance zone or beyond. Scenario 2: IF the price makes a new ATH, I will wait for a corrective pattern, and I will trade, assuming that a new long-term bull run will come. What if nothing of this happens? I don't trade. Now let's see an analysis on Ethereum to finish today´s post: Here I will be using the exact same logic as BTC. So no further explanation is required Thanks for reading, feel free to share you view and charts on the comments.
Disclaimer
Any content and materials included in Sahmeto's website and official communication channels are a compilation of personal opinions and analyses and are not binding. They do not constitute any recommendation for buying, selling, entering or exiting the stock market and cryptocurrency market. Also, all news and analyses included in the website and channels are merely republished information from official and unofficial domestic and foreign sources, and it is obvious that users of the said content are responsible for following up and ensuring the authenticity and accuracy of the materials. Therefore, while disclaiming responsibility, it is declared that the responsibility for any decision-making, action, and potential profit and loss in the capital market and cryptocurrency market lies with the trader.