
Theperfectionist
@t_Theperfectionist
What symbols does the trader recommend buying?
Purchase History
پیام های تریدر
Filter
Signal Type

Theperfectionist
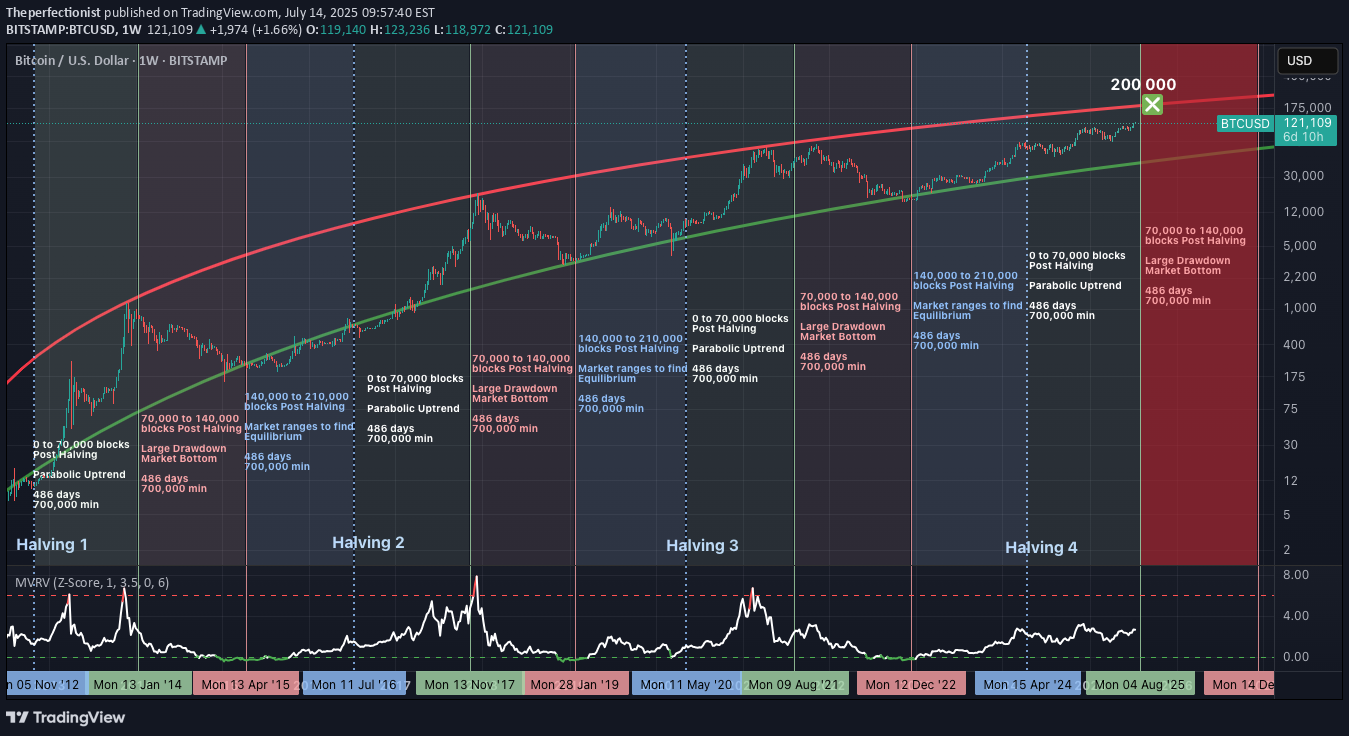
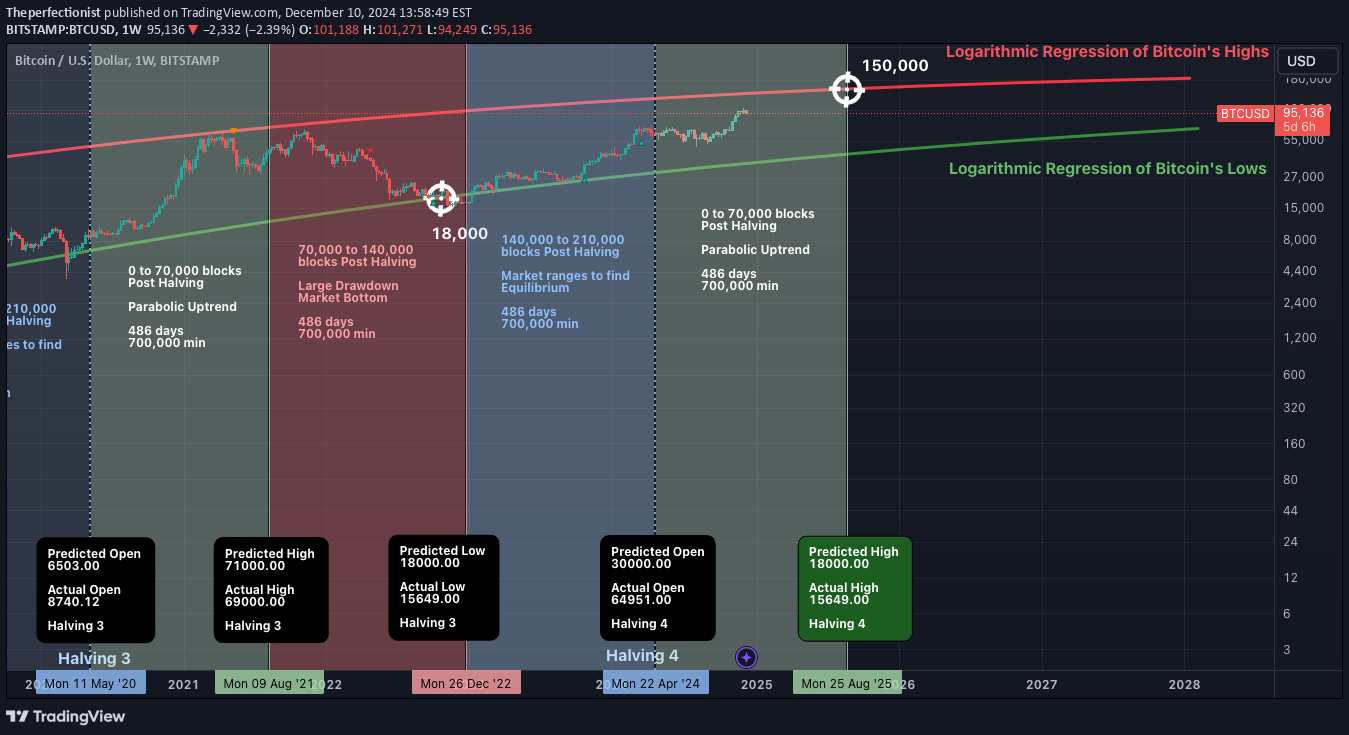
Summary Bitcoin’s price consistently follows a 3-phase structure after each halving, with ~486 days per phase. If history repeats, we are nearing the end of the parabolic phase, with a potential peak around $200,000, before entering a structured drawdown. Halving Cycles: The Real Clock Behind Bitcoin Bitcoin’s monetary policy is pre-programmed. A halving occurs approximately every 210,000 blocks (~4 years), and market behaviour after each halving follows this repeating pattern: Phase 1: Parabolic Rally (0 to 70,000 blocks post-halving). Phase 2: Major Drawdown (70,000 to 140,000 blocks). Phase 3: Equilibrium Phase (140,000 to 210,000 blocks). Each phase lasts approximately 486 days, and this structure has repeated reliably since 2012. Phase 1: The Parabolic Rally (Current Phase) We are currently in the growth segment of the cycle: Price rising rapidly. Miner profitability at highs. Hashrate and network security increasing. MVRV Z-Score steadily climbing, but not yet overextended. Roughly 700,000 BTC are mined during this period, creating a supply shock as issuance is halved while demand accelerates. Phase 2: The Drawdown (Expected Next) Historically begins between block 70,000 to 140,000 post-halving. Market peaks and begins to correct. Miner margins compress. Hashrate may plateau or decline. Forced selling and miner capitulation drive volatility. Price retraces significantly from the peak. This phase resets the market and eliminates unsustainable excess. Phase 3: The Equilibrium Phase Occurs between block 140,000 to 210,000 post-halving. Price enters consolidation. Realized value and market price converge. Ideal accumulation period for long-term investors. Network fundamentals stabilize ahead of the next halving. This phase is critical in building the base for the next cycle. MVRV Z-Score: Market Thermometer The chart includes the MVRV Z-Score, a key metric showing how far price deviates from realized value: Readings above 6.0 have consistently marked cycle tops. Readings near or below 0 have marked major bottoms. Current value is around 2.67 — indicating a rising trend, but not overheated. This metric reflects market-wide profitability and speculative pressure. Why $200,000 Is in Sight The projected resistance curve on the chart suggests that: $200,000 aligns with the top of the long-term parabolic channel. It corresponds with the expected end of the parabolic phase (Q1–Q2 2026). It fits prior extension patterns following each halving. It is a strong psychological target, likely to trigger heavy profit-taking. This price level is not arbitrary—it is derived from the same structure that defined previous peaks. What Comes After If the historical cycle structure remains intact: The peak should occur before mid-2026. A deep correction phase follows, likely into 2027. True bottoms tend to occur as miner capitulation concludes and difficulty adjusts downward. This is where conviction and preparation matter most. Final Thoughts Bitcoin cycles are not random. They are structured around block height, issuance, and miner economics. Every cycle since 2012 has followed this 486-day framework, divided across parabola, crash, and reset. This model has outperformed calendar-based predictions and technical narratives. Disclaimer This content is for educational and informational purposes only and does not constitute financial, investment, or trading advice. Past performance is not indicative of future results. Always do your own research and consult with a qualified financial advisor before making investment decisions. The author holds no responsibility for any losses incurred as a result of using the information presented herein.

Theperfectionist
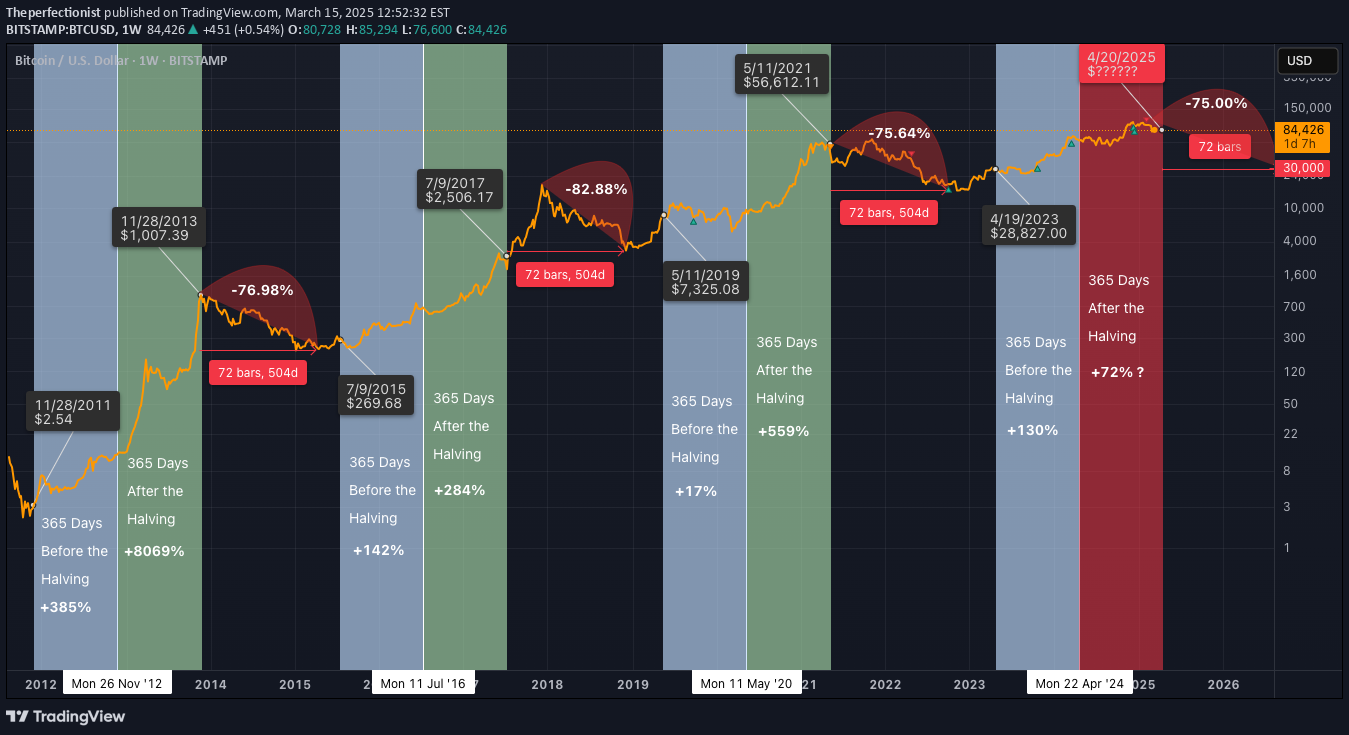
Bitcoin Halving Cycles: What History Tells Us About 2025 The Bitcoin halving is a highly anticipated event that occurs approximately every four years, reducing the block reward by 50% ⛏️. This supply shock has historically been a major catalyst for price movements. By analyzing previous cycles, we can attempt to forecast what might happen in the upcoming halving cycle of 2025. Historical Performance of Bitcoin Halving Cycles First Halving (2012) 365 Days Before Halving: 📈 +385% 365 Days After Halving: 🚀 +8069% Peak-to-Trough Decline After Peak: 🔻 -76.98% Second Halving (2016) 365 Days Before Halving: 📈 +142% 365 Days After Halving: 🚀 +284% Peak-to-Trough Decline After Peak: 🔻 -82.88% Third Halving (2020) 365 Days Before Halving: 📈 +17% 365 Days After Halving: 🚀 +559% Peak-to-Trough Decline After Peak: 🔻 -75.64% Current Cycle and 2025 Halving Expectations - Last Halving Date: 📅 April 15, 2024 - 365 Days Before Halving: Bitcoin gained 📈 +130% from $28,827 (April 2023) to around $65,000. - Projected 365 Days After Halving (April 2025): If history rhymes, we could see a price increase of around 📊 +72%, with a potential closure at the current Peak of $110,000. - Post-Peak Decline Estimate: Previous post-halving peaks saw declines of 📉 75%–82%. With Bitcoin's all-time high around $110,000, a 🔻 75% drawdown would target a bottom of ~$30,000 before the next recovery cycle. Key Takeaways Bitcoin's price tends to rally leading up to the halving, but the largest gains historically occur in the year following the halving. 📊 Post-bull run drawdowns are severe with past declines ranging from 🔻 -75% to -82%. While the Pre and Post-Halving theory suggests that the decline starts around 365 days after the halving, the full bear market typically unfolds between ⏳ 486 to 510 days post-halving. This aligns with the ⛓️ 70,000-block mark post-halving, as Bitcoin halvings occur approximately every 210,000 blocks. This means that while the peak may occur within a year after the halving, the deep bearish phase historically becomes evident around 1.3 to 1.4 years after the halving, reinforcing the long-term cyclical nature of Bitcoin’s market trends 🔄. Final Thoughts Bitcoin halving events are pivotal moments in the crypto market cycle 🔥. The data suggests that 2025 could see significant gains, but we should also be prepared for the inevitable correction that follows 📉. What are your thoughts on the upcoming cycle? Share your insights in the comments! Disclaimer This article is for informational and educational purposes only and does not constitute financial, investment, or trading advice. The historical performance of Bitcoin halving cycles does not guarantee future results, and past trends may not necessarily repeat. Cryptocurrency markets are highly volatile, and investing in Bitcoin or any other asset carries risks, including the potential loss of capital. Readers should conduct their own research, assess their risk tolerance, and consult with a licensed financial advisor before making any investment decisions. The information provided is based on publicly available data and historical observations, which may be subject to change. Sources: Nakamoto, S. (2008). Bitcoin: A Peer-to-Peer Electronic Cash System. Bitcoin block time and halving data: Blockchain.com Historical Bitcoin price data: CoinMarketCap Bitcoin halving cycles and trends: Messari Market performance metrics: Glassnode By reading this article, you acknowledge that you are solely responsible for your own financial decisions and that the author assumes no liability for any losses incurred from trading or investing. 🚀

Theperfectionist
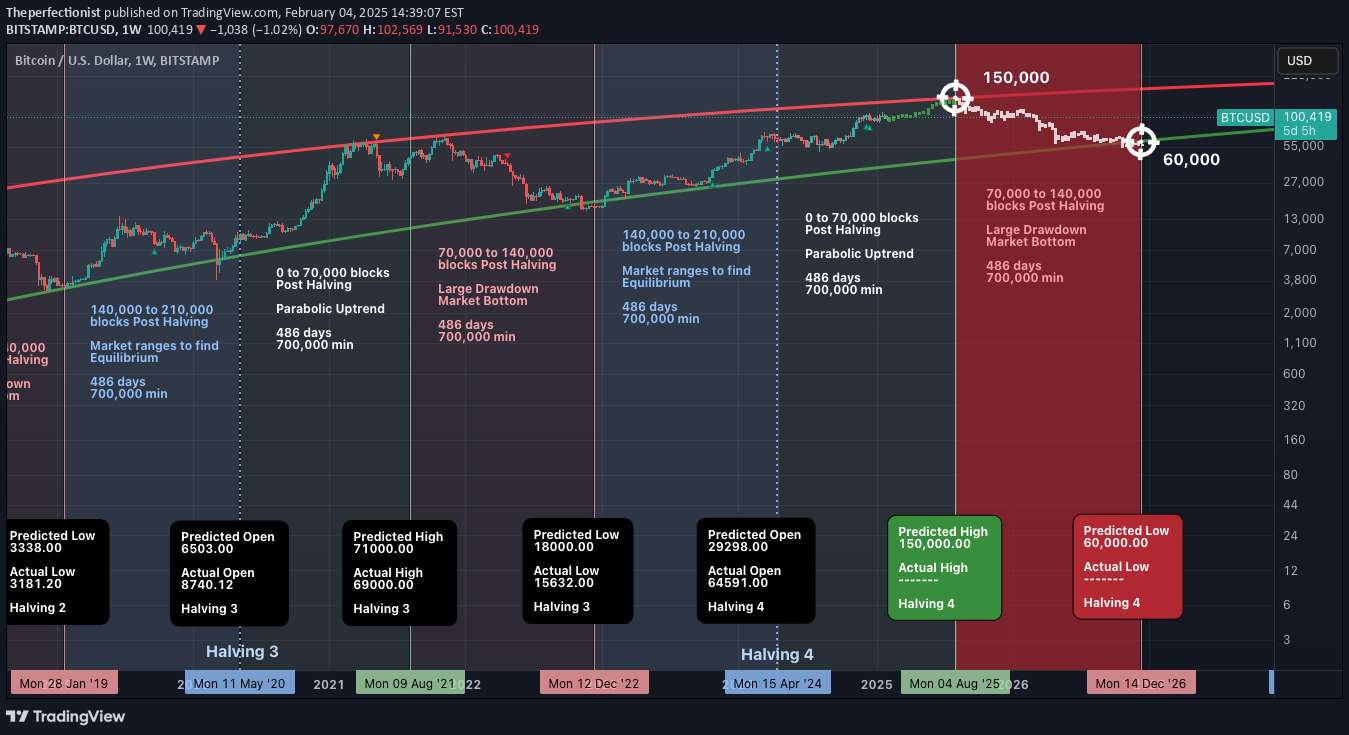
🚀 Bitcoin’s Bullish Phase: The Final Push Before the Fall? Bitcoin is currently in the parabolic uptrend phase of its halving cycle, with price action closely following historical patterns. Since the last halving on April 15, 2024, Bitcoin has mined approximately 42,480 blocks, pushing the market closer to the 70,000-block threshold where the trend historically reverses into a deep bear market. Based on historical patterns, Bitcoin’s next major bull market peak is expected around 150,000 USD, approximately 70,000 blocks post-halving (projected for August 2025). However, investors must prepare for what follows—a severe bear market fuelled by miner capitulation. 🔥The 70,000-Block Bearish Reversal: Why It Happens Every Cycle 1. The Mining Difficulty Trap & Rising Costs Bitcoin’s mining difficulty adjusts every 2,016 blocks (~2 weeks) to maintain the 10-minute block interval. As BTC price surges in the bull market, more miners join the network, driving competition and difficulty higher. This raises mining costs and squeezes profit margins, making it harder for smaller miners to stay afloat. ✅ Bull Market (~0-70,000 Blocks Post-Halving) High BTC prices offset increased difficulty, allowing miners to hold rather than sell. Low sell pressure from miners keeps Bitcoin in an uptrend. ❌ Bear Market (~70,000 Blocks Post-Halving) After BTC peaks, prices decline but difficulty remains high. Mining costs remain constant, while block rewards drop. Weaker miners can’t afford to mine at a loss and are forced to sell their BTC holdings to cover operational expenses. 2. The Snowball Effect: How Miner Capitulation Triggers a Crash Once inefficient miners begin selling, a chain reaction unfolds: 1️⃣ Bitcoin price starts declining after the cycle peak (~12-18 months post-halving). 2️⃣ Miners struggle to remain profitable due to high difficulty and lower block rewards. 3️⃣ Miners begin offloading BTC to cover expenses, increasing supply in the market. 4️⃣ More BTC supply leads to further price drops, triggering panic selling. 5️⃣ Additional miners shut down operations, selling off reserves, further flooding the market. 6️⃣ Capitulation accelerates, causing a cascading effect similar to leveraged liquidations seen in past bear markets. 🔄 This cycle repeats until enough miners exit, difficulty adjusts downward, and BTC stabilizes. 3. Historical Proof: How Miner Capitulation Has Marked Every Bear Market Each Bitcoin bear market aligns with major miner capitulation events. Here’s how past cycles have played out: 📌 2012 Halving: Bull top in late 2013, miner capitulation in 2014, BTC fell -80%. 📌 2016 Halving: Bull top in late 2017, miner capitulation in 2018, BTC fell -84%. 📌 2020 Halving: Bull top in late 2021, miner capitulation in 2022, BTC fell -78%. 📌 2024 Halving: Expected bull top in late 2025, miner capitulation likely in 2026?, BTC decline TBD but estimated to be around -60%. 🔹 In all cases, BTC topped ~70,000 blocks after the halving, followed by a deep drawdown driven by miner capitulation. 🔹 The selling pressure from miners perfectly aligns with the start of major market crashes. 4. The Accumulation Phase: What Follows the Crash? After miners capitulate and difficulty adjusts downward, Bitcoin enters a sideways accumulation phase (~140,000-210,000 blocks post-halving). Weaker miners have already exited, reducing sell pressure. Surviving miners adjust to lower rewards and stop mass selling BTC. Smart money (whales & institutions) begin accumulating at undervalued prices. The MVRV ratio drops below 1, signalling a market bottom. Bitcoin stabilizes, setting the stage for the next bull cycle. This predictable recovery cycle lays the groundwork for Bitcoin’s next exponential rally into the next halving period. The Bitcoin Bear Market Prediction for 2025-2026 ✅ Bitcoin is currently on track to peak near ~$150,000 around 70,000 blocks post-halving (August 2025). ✅ Following this, BTC is expected to enter its bear market, with prices potentially falling to ~$60,000 (by December 2026). ✅ The primary catalyst for this crash will be miner capitulation, just as it has been in every prior cycle. Final Thoughts If history repeats, the Bitcoin market is set to follow a sharp parabolic rise to ~$150,000 before undergoing a 70,000-block miner-driven selloff into a multi-month bear market. Investors should be aware of this pattern and plan accordingly. Sources & Data Validation The insights presented in this article are based on historical Bitcoin price cycles, on-chain analytics, and mining difficulty trends from various sources, including: Blockchain Data (Glassnode, CoinMetrics) Historical BTC Halving Data (Bitcoin Whitepaper, Blockchain Explorers) Market Analysis Reports (Messari, Arcane Research) Macroeconomic Influences (Federal Reserve Reports, Global Liquidity Cycles) Disclaimer: Not an Investment Recommendation This article is for informational purposes only and should not be considered financial or investment advice. Bitcoin and cryptocurrency markets are highly volatile, and past performance is not indicative of future results. Conduct your own research and consult with a financial professional before making any investment decisions.BTC just reached 120,000 while the MVRV ratio stays far below 7. The Bull phase is ongoing and we still have an upside potential.

Theperfectionist
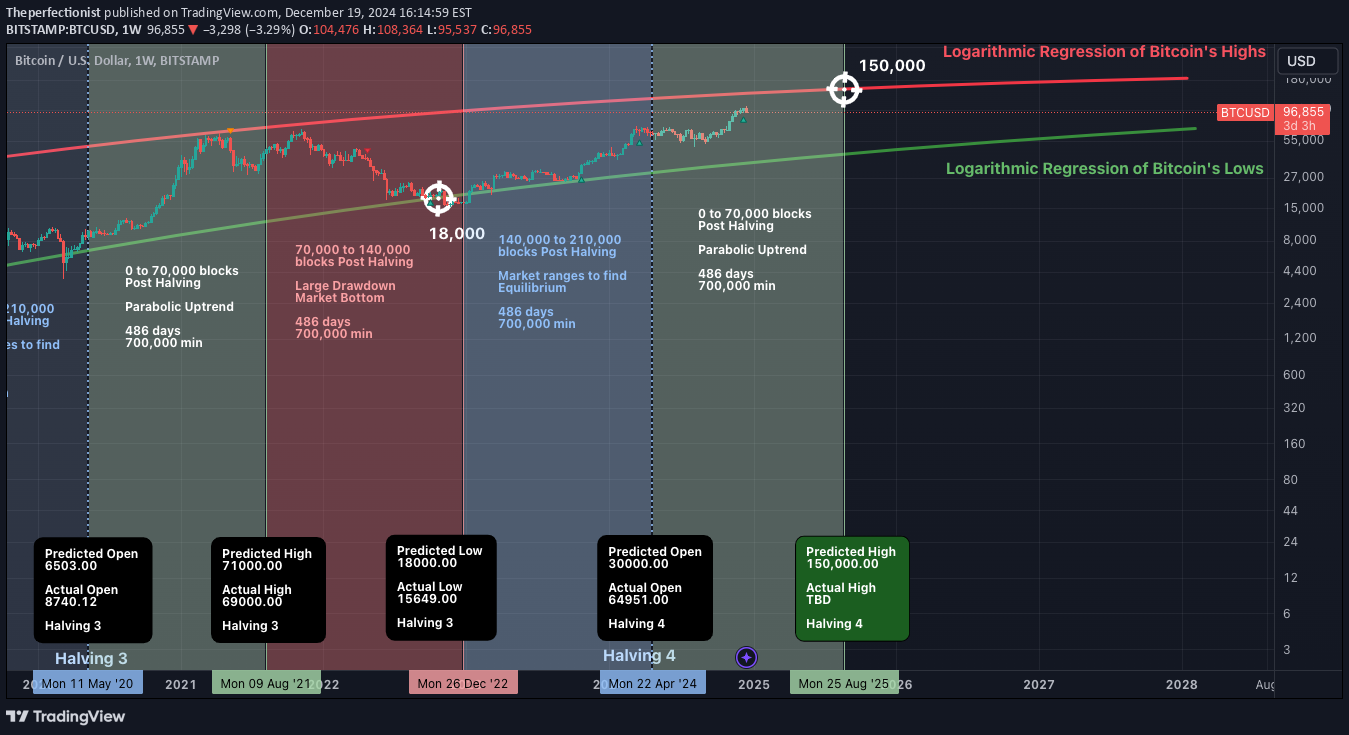
Bitcoin Halving 2024: A New Era The fourth Bitcoin halving, expected on April 15, 2024, will cut the block reward to 3.125 BTC, increasing scarcity and reinforcing its deflationary nature. Historically, halving cycles drive three phases: a bullish uptrend in the first 70,000 blocks, a bearish retracement in the next 70,000, and sideways consolidation before the next halving. This cycle points to a potential peak of $150,000, supported by historical trends, logarithmic regression, and metrics like the MVRV ratio. Current Market Position Bitcoin has emerged from the sideways phase of the third halving era (2020–2024) and is poised for a bullish run. The MVRV ratio, currently at 2.24, signals fair value, with room for growth. Historical patterns show Bitcoin dominance surges above 70% during bullish phases, supporting price appreciation. Halving Cycles and Projections Bitcoin's logarithmic regression model aligns with these price phases: Bullish Phase (0–70,000 blocks): Exponential growth; projected high of $150,000. Bearish Phase (70,000–140,000 blocks): Retracement of 80%, with lows around $55,000. Sideways Phase (140,000–210,000 blocks): Consolidation before the next cycle. MVRV Ratio Insights The MVRV ratio (Market Value to Realized Value) serves as a key valuation tool: MVRV > 3.7: Overbought, market tops. MVRV < 1: Undervalued, market bottoms. The current reading of 2.24 reflects equilibrium, signaling potential upside. Timeline Overview April 2024 (Halving): Demand rises, supply tightens, sparking bullish momentum. 2025–2026: Peak at $150,000 as the bullish phase matures. Post-Bullish Phase: Retracement to $55,000, consistent with historical patterns. Conclusion Bitcoin’s cyclical dynamics, driven by halving mechanisms, position it uniquely in financial markets. Historical data and on-chain metrics suggest a bullish trajectory to $150,000, with an 80% drawdown to $55,000 post-peak. While short-term volatility remains, Bitcoin’s long-term appeal as a store of value persists. Disclaimer: This analysis is educational and not financial advice. Cryptocurrency investments are volatile, and past performance does not predict future results. Sources Coin Metrics CryptoQuant TradingView Data Analysis

Theperfectionist
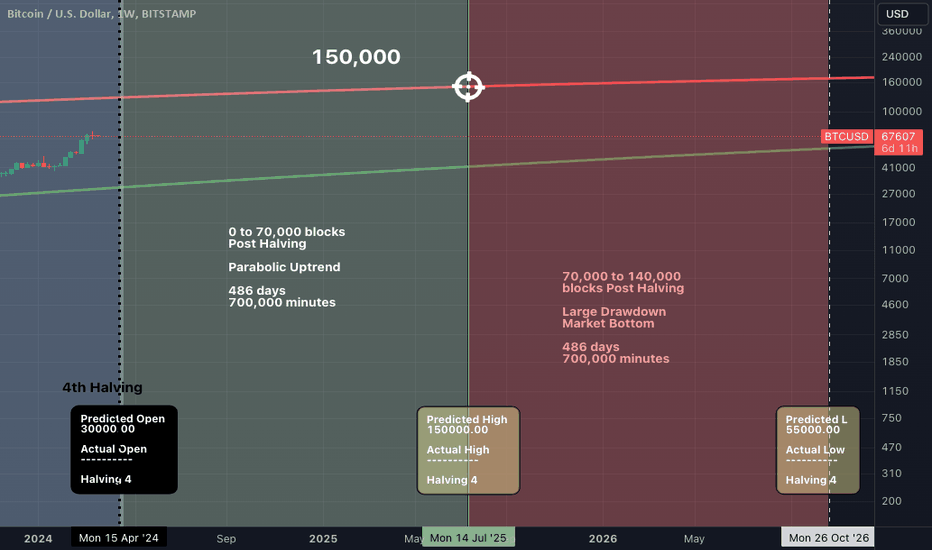
Introduction The fourth Bitcoin halving, anticipated on April 15th, 2024, marks the beginning of a new era, reinforcing Bitcoin's deflationary narrative and catalyzing its cyclical market dynamics. With 90% of Bitcoin's supply already mined and a reduced block reward of 3.125 BTC, scarcity is set to increase, setting the stage for a bullish trajectory. Historically, Bitcoin’s halving cycles have driven predictable phases: bullish trends in the initial 70,000 blocks, bearish retracements in the next 70,000 blocks, and sideways consolidation in the final stretch before the next halving. As we step into the bullish phase of Halving 4, this analysis explores Bitcoin’s trajectory toward a potential peak of $150,000, supported by historical patterns, logarithmic regression models, and on-chain metrics like the MVRV ratio and z-score. Where Are We Today? Having experienced the lows of the third halving era, which began on May 11th, 2020, Bitcoin has successfully weathered the sideways phase characterized by market equilibrium. With the MVRV ratio at 2.24, Bitcoin is signaling fair value, poised for the bullish uptrend expected in the fourth halving era. Historically, Bitcoin’s market dominance reflects this cyclical behavior. During bearish and sideways phases, dominance often falls below 40%, but as the bullish phase takes hold, dominance surges to 70%, bolstering its influence over the entire cryptocurrency market. These dynamics suggest that Bitcoin is primed for significant price appreciation. Halving Cycles and Price Projections The logarithmic regression model shown in the chart encapsulates Bitcoin’s historical price patterns. The projected target of $150,000 aligns with the intersection of Bitcoin's parabolic uptrend and its logarithmic regression of highs. Key milestones include: Post-Halving Bullish Phase (0 to 70,000 blocks): Historically marked by exponential price growth. Bearish Phase (70,000 to 140,000 blocks): A retracement period, with average drawdowns of 80% from cycle highs. Sideways Phase (140,000 to 210,000 blocks): A period of consolidation, setting the stage for the next halving. For Halving 4, projections suggest: A high of $150,000 during the bullish phase. An 80% drawdown, positioning the bearish-phase low at $55,000. The MVRV Ratio: A Key Indicator The MVRV ratio (Market Value to Realized Value) serves as a robust tool for assessing Bitcoin’s valuation. Current metrics indicate that Bitcoin is fairly valued, with room for substantial growth in the coming phase: Historical Extremes: MVRV > 3.7: Overbought conditions, signaling market tops. MVRV < 1: Undervalued conditions, signaling market bottoms. As Bitcoin transitions into the fourth halving era, the MVRV ratio’s current reading of 2.24 suggests equilibrium, with significant upside potential. Projected Timeline April 2024 (Halving): Bitcoin enters the bullish phase, with increasing demand outpacing diminishing supply. 2025-2026: Price targets of $150,000 are achievable as the cycle matures. Post-Bullish Phase: Expected retracement to $55,000, aligning with historical drawdowns. Conclusion Bitcoin’s cyclical nature, driven by its deflationary halving mechanism, positions it as a unique asset in the financial markets. As we enter the fourth halving era, the combination of historical data, on-chain metrics like the MVRV ratio, and market dynamics underscores the potential for Bitcoin to reach $150,000. This analysis highlights Bitcoin's enduring appeal as a store of value and a driver of innovation in the digital asset space. While short-term volatility is inevitable, the long-term outlook remains bullish. Disclaimer: This article is for educational purposes only and does not constitute financial advice. Cryptocurrency investments are inherently volatile, and past performance does not guarantee future results. Sources: Coin Metrics CryptoQuant TradingView Data Analysis

Theperfectionist
The Basics of Bitcoin's Analysis As we approach the anticipated fourth Bitcoin halving on April 15th, 2024, the mining of Bitcoin’s 19,656,962nd coin is a testament to the network’s enduring strength, bringing the circulating supply to 90% of the total. The ‘rainbow chart’ remains a popular model for visualizing Bitcoin’s logarithmic growth and its cyclical price patterns. The halving events, pivotal in Bitcoin’s economic model, systematically reduce the block reward, thereby constraining the new supply of Bitcoin. The current reward stands at 6.25 BTC per block, which will decrease to 3.125 BTC post the fourth halving. This deflationary mechanism has historically triggered bullish market sentiments as the reduced flow of new coins amplifies scarcity. Analyzing the cycles between halvings, a clear pattern emerges: the initial 70,000 blocks post-halving often usher in a bullish phase, succeeded by a bearish phase up to the 140,000th block, and culminating in a sideways market until the next halving at the 210,000th block. Bitcoin’s market dominance is also subject to cyclical fluctuations. Since 2016, its dominance has dipped below 40% during bearish phases and soared to around 70% during bullish periods, significantly influencing the broader cryptocurrency market. The average drawdown observed between halvings is approximately 80%. Currently, in the sideways phase of the third cycle, projections based on the intersection of the 210,000th block and the lower logarithmic regression boundary suggest a valuation of $30,000 per Bitcoin. The forthcoming era could witness a peak of $150,000, with an 80% drawdown positioning the potential low at $55,000 during the bearish phase, commencing 486 days after the halving. Where are we Today? Recent market analyses align with these projections, indicating a minor retracement a month after the 2024 halving, followed by a significant rally to new heights. Analysts advise caution as the market nears the halving event, with some predicting a pre-halving sell-off. Despite short-term volatility, the long-term outlook for Bitcoin remains bullish, with predictions of a new all-time high price in each 4-year period between Halving dates. The only indicator to consider: The MVRV Ratio and Z-score The MVRV ratio was created by Murad Mahmudov & David Puell hot on the heals of the invention of the Realized Cap concept by the Coinmetrics team of Nic Carter and Antoine Le Calvez. Realized Cap is an alternative approach to Market Cap as a measure of network valuation. Rather than using the last traded price and multiplying by the coins in circulation as seen in Market Cap, Realized Cap approximates the value paid for all coins in existence by summing the market value of coins at the time they last moved on the blockchain. MVRV is simply the ratio comparing the two, i.e. MVRV = Market Cap / Realized Cap. It’s useful for getting a sense of when the exchange traded price is below “fair value” and is also quite useful for spotting market tops and bottoms (Source: Coinmetrics.com). The MVRV ratio is calculated by dividing the total bitcoin market value (MV) by its realized value (RV). Therefore, the metric represents the extent in which the current bitcoin market valuation is overextended beyond (values >1) or actually at a discount (values <1) compared to the holders’ aggregated cost base. From the MVRV ratio we obtain the MVRV z-score, which first calculates the difference between the total bitcoin market value and its realized value, and then divides that by the standard deviation of the market valuation — a common statistical procedure called “standardization.” The MVRV z-scores, therefore, represent the number of standard deviations that each bitcoin market valuation is increased or decreased against its realized value (Remember z-score >1 means overextended and z-score <1 discount) What do indicators say? We are currently at the dusk of the 3rd halving era which occurred on May 11th 2020, more precisely the END of the sideways phase. The MVRV ratio is at 2.24 giving sights of a Fair Value. Historically, Values over '3.7' indicated price top and values below '1' indicated price bottom.(Source: CryptoQuant) (It is crucial to note that these insights are for educational purposes and should not be considered financial advice. The cryptocurrency market is inherently volatile, and while historical data can provide guidance, it does not guarantee future performance).We crossed the 100k mark for the first time in November. More upward movement to come.BTC just crossed the 120k mark.

Theperfectionist
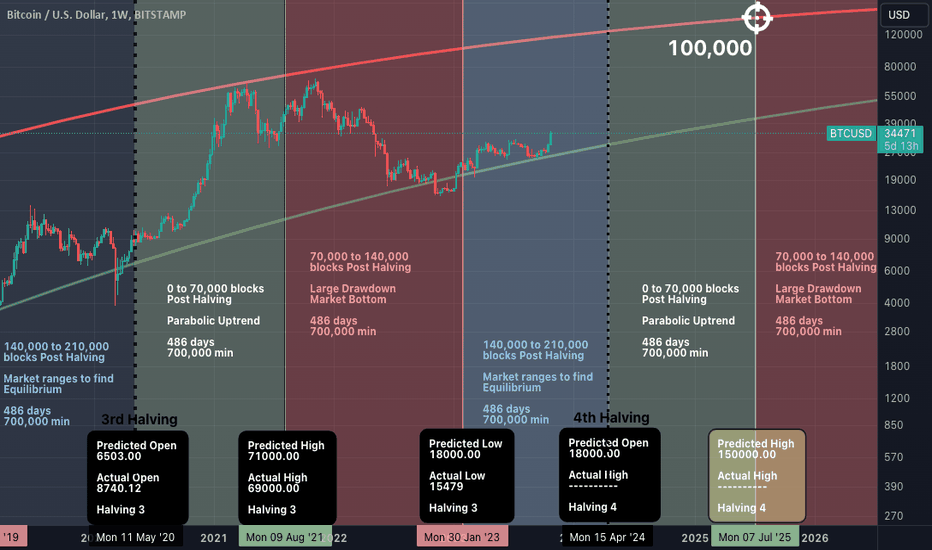
BTCUSD BTCUSD BTC1! BTCUSD What’s Bitcoin? Bitcoin is a decentralized digital currency that operates on a network of computers, eliminating the need for intermediaries or central authorities. It was introduced in 2009 by an anonymous individual or group known as Satoshi Nakamoto, who outlined the concept in a white paper describing a peer-to-peer electronic cash system. Since then, Bitcoin has emerged as the leading and most valuable cryptocurrency globally, with a market capitalization exceeding $580 billion as of October 2023. A notable characteristic of Bitcoin is its limited supply of 21 million coins, a threshold estimated to be reached around the year 2140. The creation of new bitcoins is regulated through a process called mining, which involves solving complex mathematical problems using specialized hardware and software. Miners compete to discover valid solutions that meet a specific difficulty level, adjusted approximately every two weeks to maintain an average block time of 10 minutes. The miner who successfully finds a valid solution for each block is rewarded with freshly minted bitcoins and transaction fees. As of October 2023, the Bitcoin network has witnessed the mining of 813,378 blocks, with a current reward of 6.25 bitcoins per block. Key Insights on Bitcoin's Price: Recently, the mining of the 19.5 millionth bitcoin increased the circulating supply to 93% of the total. Additionally, a logarithmic regression analysis known as the rainbow chart illustrates the historical path of Bitcoin's price movement. This cyclic behaviour can be attributed to several factors: Bitcoin tends to exhibit an overall bullish trend due to its limited supply and the halving of coins entering circulation approximately every four years. Historically, the Bitcoin halving has been a significant catalyst for price movements as it influences the supply-demand balance. The halving reduces the rate of new bitcoins being introduced into circulation while demand typically remains steady or grows over time. This creates a supply shock that often drives the price upward, particularly before and after the halving event. Each halving period encompasses the mining of 210,000 blocks and exhibits distinct phases. The bullish phase spans from the first block to the 70,000th block, followed by a bearish phase from the 70,001st block to the 140,000th block, and finally a sideways phase from the 140,001st block to the 210,000th block. As previously mentioned, the halving diminishes the inflation rate of bitcoin and preserves its scarcity. Bitcoin holds great influence over the entire cryptocurrency market due to its dominant market capitalization. This dominance follows a cyclical pattern, with the market share falling below 40% during bearish phases (after mining more than 140,000 blocks) and rising to around 70% during bullish phases. During each era (between two halving periods), Bitcoin experiences an average drawdown of 80%. Current Analysis: We are currently in the third halving era, which commenced on May 11th, 2020, specifically within the equilibrium phase. The intersection of the mining of the 210,000th block and the lows of the logarithmic regression suggests a value of $30,000 USD per bitcoin. The next Bitcoin halving is expected to take place in April 2024, at block number 840,000. This event will reduce the block reward from 6.25 bitcoins to 3.125 bitcoins, consequently lowering the annual inflation rate from approximately 1.8% to 0.9%. As a halving typically ushers in a bullish phase, it is predicted that the price of bitcoin will surpass $100,000.00 during this era. Technical Analysis Using the MVRV Indicator: One of the tools that can help investors and traders assess the value and potential of bitcoin is the MVRV ratio, which stands for market value to realized value. The MVRV ratio compares the current market capitalization of bitcoin (the total value of all coins at their current price) with its realized capitalization (the total value of all coins at their last moved price). The MVRV ratio can indicate whether bitcoin is overvalued or undervalued relative to its historical average cost basis. The MVRV ratio can also be used to identify periods of extreme market sentiment, such as euphoria or panic. When the MVRV ratio is very high (above 4), it means that bitcoin is trading far above its realized value, implying that most holders are sitting on large unrealized profits and may be tempted to sell. This can signal a market top or a bubble territory. When the MVRV ratio is very low (below 1), it means that bitcoin is trading far below its realized value, implying that most holders are sitting on large unrealized losses and may be reluctant to sell. This can signal a market bottom or a buying opportunity. As of October 2023, the MVRV ratio of bitcoin is about 2.110, which is slightly above its long-term average of 2. This suggests that bitcoin is fairly valued and not in a danger zone. The MVRV ratio has been trending up since November 9th 2022, when it reached a low of 0.75, indicating a recovery in the market sentiment and the lowest price of the 3rd Halving era. As we are far from the overbought level of 4, this suggests that there is still room for further growth in the price of bitcoin. (These illustrations are just for educational purposes and are not financial advices). Sources: 1. trustwallet.com 2. ieeexplore.ieee.org 3. nber.org 4. buybitcoinworldwide.com 5. bitinfocharts.com 6. nerdwallet.com 7. investopedia.com 8. buybitcoinworldwide.com 9. kitco.com 10. coinwarz.com 11. datawallet.com 12. blockchain.com 13. lookintobitcoin.com 14. bing.com 15. bitcoinmagazine.com 16. stopsaving.com 17. decentrader.com 18. trustwallet.com 19. bitinfocharts.com 20. nber.org 21. buybitcoinworldwide.com 22. cryptonews.com 23. finbold.com 24. inferse.com 25. buybitcoinworldwide.com 26. blockchain.comTarget was reach on December 4th, 2024. BTC surpassed 100,000 for the very first time.

Theperfectionist
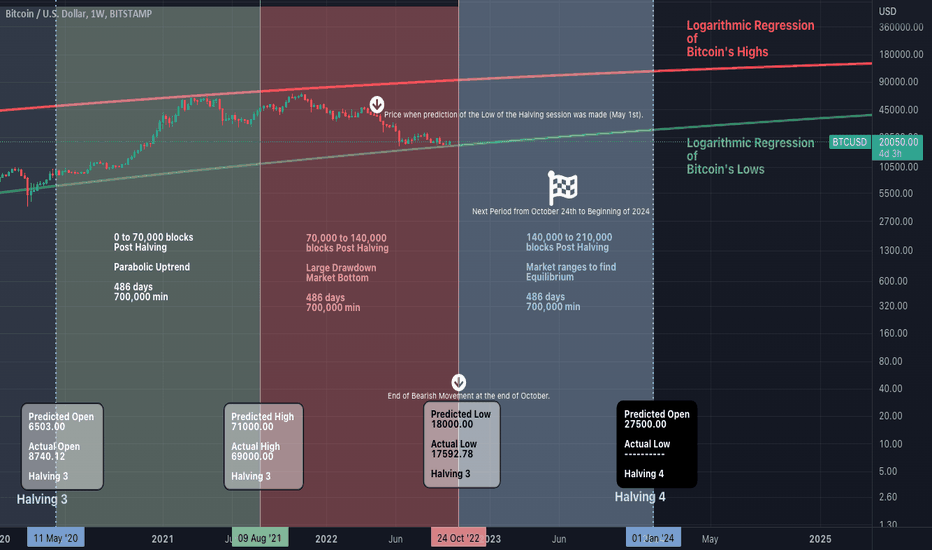
Speculations, Data analysis, well-known Patterns, Fundamentals, Daily News and more are several tools we use to predict what could be the next move of our favourite instrument : Bitcoin. Genesis Bitcoin (BTC) was invented by a pseudonymous individual or group named Satoshi Nakamoto in 2008 and is the world’s first enduring cryptocurrency that succeeded where decades of digital cash experiments failed. Bitcoin’s monetary policy is enforced through a unique blend of software, cryptography and financial incentives rather than the whim of trusted third parties. The Bitcoin network is powered by a cryptographically secure, verifiable database called the blockchain — itself a technological phenomenon. The Bitcoin ecosystem consists of a global network of stakeholders, including the miners that secure the network and drive the issuance of the Bitcoin currency, the traders who speculate on this radically market-driven asset, and the builders working to onboard people to the cryptocurrency paradigm. How Bitcoin was built influences its patterns Bitcoin's 19th million coin was mined recently, increasing the circulating coins proportion to 90% of the total supply. Besides, there is a common pattern known as the rainbow chart which displays the logarithmic regression path bitcoin follows. The cyclical behaviour of the security can be explained by the following facts : Bitcoin tends to be overall bullish because the supply is limited and the amount of coins being released in circulation is halved every four years. Each block mined now provides a reward of 6.25 BTC . A total of 210,000 blocks are mined between each halving dates, with a more visible aspect of the cycles : From the 1st block to the 70,000th block, Bitcoin appears to be in a bullish phase, from the 70,001st block to the 140,000th block a bearish phase and from the 140,001st block to the 210,000th block a sideways phase. Bitcoin is the most dominant cryptocurrency. Indeed, it influences the whole cryptocurrency market due to its market capitalization. It's dominancy is also cyclical and since 2016, it falls below 40% exactly when we are entering the bearish phase (>140,000 blocks being mined) while the bullish phase is catarterized by a dominance around 70% of the total market. The average drawdown during an era (Between two halving dates) is 80%. The only indicator to consider: The MVRV Ratio and Z-score The MVRV ratio was created by Murad Mahmudov & David Puell hot on the heals of the invention of the Realized Cap concept by the Coinmetrics team of Nic Carter and Antoine Le Calvez. Realized Cap is an alternative approach to Market Cap as a measure of network valuation. Rather than using the last traded price and multiplying by the coins in circulation as seen in Market Cap, Realized Cap approximates the value paid for all coins in existence by summing the market value of coins at the time they last moved on the blockchain. MVRV is simply the ratio comparing the two, i.e. MVRV = Market Cap / Realized Cap. It’s useful for getting a sense of when the exchange traded price is below “fair value” and is also quite useful for spotting market tops and bottoms (Source: Coinmetrics.com). The MVRV ratio is calculated by dividing the total bitcoin market value (MV) by its realized value (RV). Therefore, the metric represents the extent in which the current bitcoin market valuation is overextended beyond (values >1) or actually at a discount (values <1) compared to the holders’ aggregated cost base. From the MVRV ratio we obtain the MVRV z-score, which first calculates the difference between the total bitcoin market value and its realized value, and then divides that by the standard deviation of the market valuation — a common statistical procedure called “standardization.” The MVRV z-scores, therefore, represent the number of standard deviations that each bitcoin market valuation is increased or decreased against its realized value (Remember z-score >1 means overextended and z-score <1 discount) What do indicators say? We are currently at the 3rd halving era which occurred on May 11th 2020, more precisely the END of the bearish phase. The crossover between the 140,000th block mining date and the lows logarithmic regression indicated 18,000 USD per bitcoin, pretty close to the actual realized Low 17592.78. The MVRV ratio is at 1 giving sights of a FAIR VALUE (Source: CryptoQuant). The actual Drawdown of the bearish period was around 75% (80% average since inception). (These Explanations are just for educational purposes and are not financial advices)BTC actually bottomed on Nov 05 2022 by reaching 15,632, with an MVRV score of 0.75. The current price is 35,000, up about 133% with an MVRV score of 2.1, which means it is actually trading at fair value.

Theperfectionist
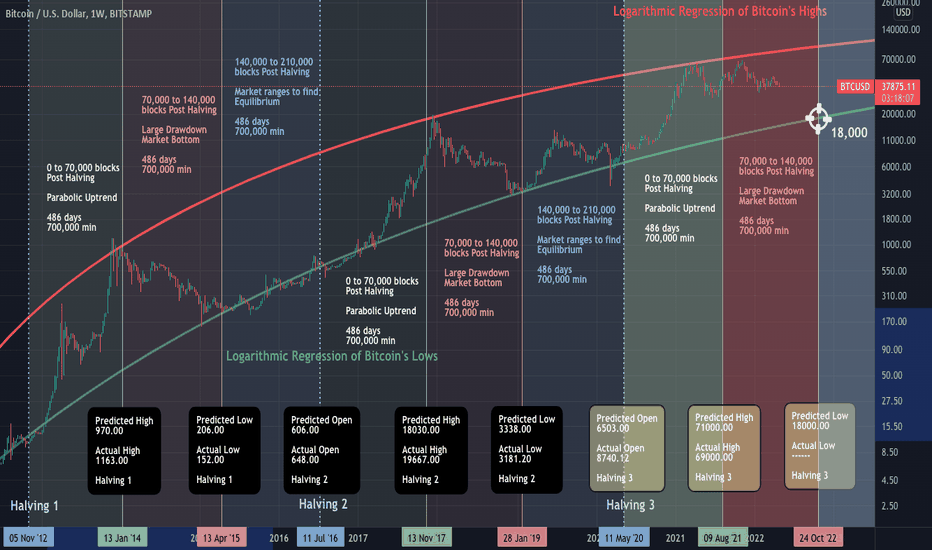
Bitcoin's 19th million coin was mined recently, increasing the circulating coins proportion to 90% of the total supply. Besides, there is a common pattern known as the rainbow chart which displays the logarithmic regression path bitcoin follows. The cyclical behaviour of the security can be explained by the following facts : Bitcoin tends to be overall bullish because the supply is limited and the amount of coins being released in circulation is halved every four years. Each block mined now provides a reward of 6.25 BTC. A total of 210,000 blocks are mined between each halving dates, with a more visible aspect of the cycles : From the 1st block to the 70,000th block, Bitcoin appears to be in a bullish phase, from the 70,001st block to the 140,000th block a bearish phase and from the 140,001st block to the 210,000th block a sideways phase. Bitcoin is the most dominant cryptocurrency. Indeed, it influences the whole cryptocurrency market due to its market capitalization. It's dominancy is also cyclical and since 2016, it falls below 40% exactly when we are entering the bearish phase (>140,000 blocks being mined) while the bullish phase is catarterized by a dominance around 70% of the total market. The average drawdown during an era (Between two halving dates) is 80%. We are currently at the 3rd halving era which occurred on May 11th 2020, more precisely within the bearish phase. The crossover between the 140,000th block mining date and the lows logarithmic regression indicate 18,000 USD per bitcoin. The high of the era was 69,000 USD and considering an 80% drawdown sets 13,800 USD as minimum price. The low of the era shall be in the interval between 10,000 - 20,000 USD with our prediction at 18,000. (These illustrations are just for educational purposes and are not financial advices) .Another explanation to bitcoin's cyclical behaviour painted by the rainbow chart are the MVRV bands which stands for Market-Value-to-Realized-Value. By leveraging the Bitcoin's time chain, which holds a public record of all Bitcoin transactions that were ever made, Realized-Value looks to quantify the total United States dollar (USD) value of all bitcoin that existed at the last time those coins were moved on-chain. The MVRV ratio is calculated by dividing the total bitcoin market value (MV) by its realized value (RV). Therefore, the metric represents the extent in which the current bitcoin market valuation is overextended beyond (values >1) or actually at a discount (values <1) compared to the holders’ aggregated cost base. From the MVRV ratio we obtain the MVRV z-score, which first calculates the difference between the total bitcoin market value and its realized value, and then divides that by the standard deviation of the market valuation — a common statistical procedure called “standardization.” The MVRV z-scores, therefore, represent the number of standard deviations that each bitcoin market valuation is increased or decreased against its realized value (Remember z-score >1 means overextended and z-score <1 discount) These “MVRV bands” show the price that bitcoin would have if it were to reach those MVRV z-score levels. The actual fair value (as today) of bitcoin (MVRV z-score = 0) is between 10,000 - 20,000 USD per coin. (Sources : Coin Metrics)The 18k target was reached sooner than expected. Many reasons explain this : - The collapse of Luna and its domino effect. - The stable coin crisis. According to the MVRV score ( lookintobitcoin.com/charts/mvrv-zscore/) Bitcoin is now trading at fair value. This could represent a great buying opportunity, however it is important to have in mind that past performances are not indicators of future results. The bear market based on halving cycles will end around October of this year therefor we still have enough room for more downward trend.
Disclaimer
Any content and materials included in Sahmeto's website and official communication channels are a compilation of personal opinions and analyses and are not binding. They do not constitute any recommendation for buying, selling, entering or exiting the stock market and cryptocurrency market. Also, all news and analyses included in the website and channels are merely republished information from official and unofficial domestic and foreign sources, and it is obvious that users of the said content are responsible for following up and ensuring the authenticity and accuracy of the materials. Therefore, while disclaiming responsibility, it is declared that the responsibility for any decision-making, action, and potential profit and loss in the capital market and cryptocurrency market lies with the trader.