
TheodoreSilas
@t_TheodoreSilas

What symbols does the trader recommend buying?
Purchase History
پیام های تریدر
Filter
TheodoreSilas
How to enter the market when gold is in an upward trend?
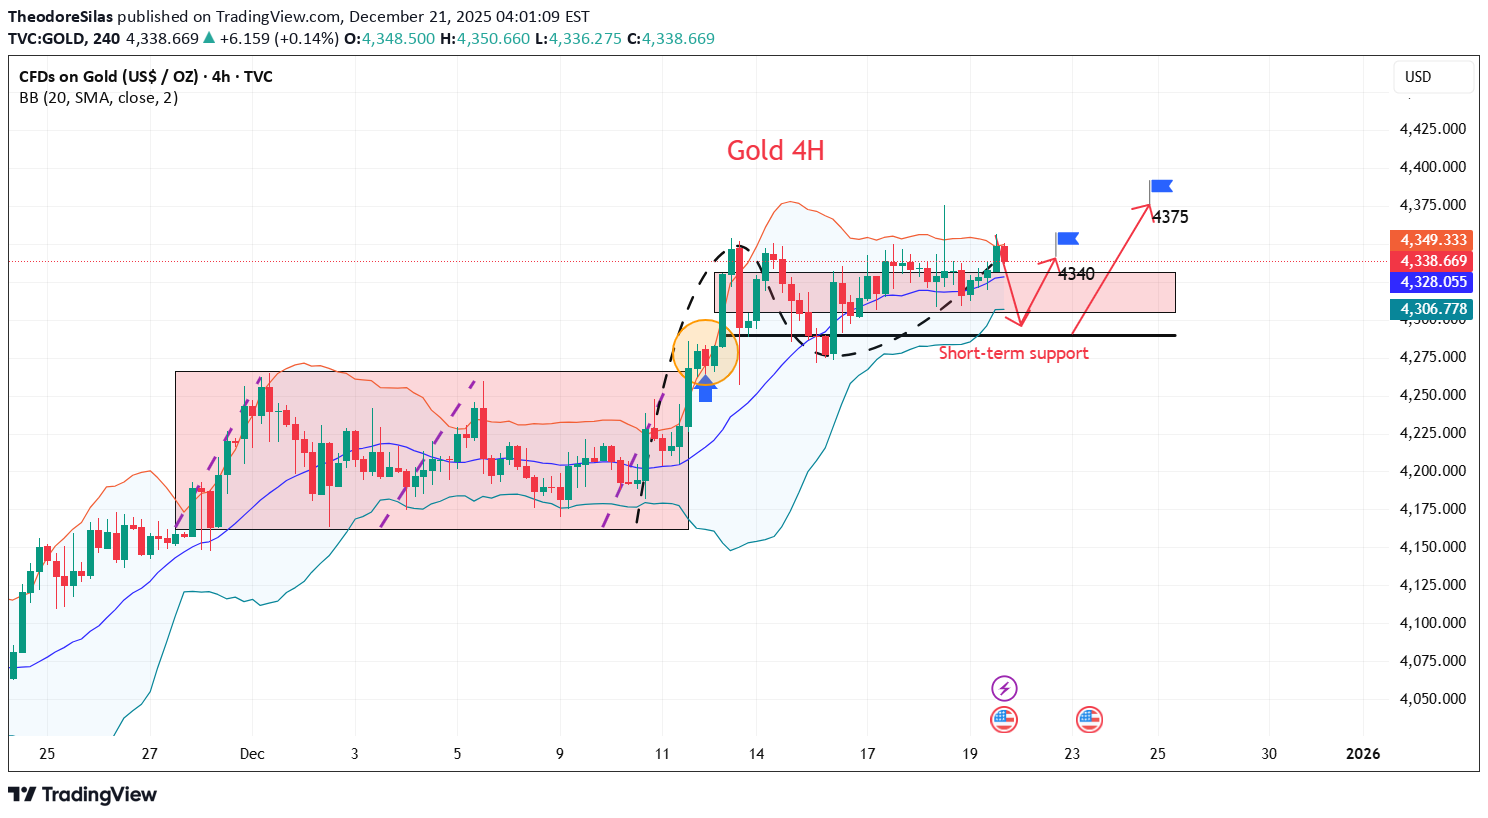
https://www.tradingview.com/x/VSDTWuD6/ news: Gold, considered the king of safe-haven assets by global investors, once again experienced a breathtaking rollercoaster ride in the financial markets at the end of 2025. This volatility was not an isolated event, but rather a product of the latest US Consumer Price Index (CPI) data. Lower-than-expected inflation data, on the one hand, stimulated expectations of a Federal Reserve interest rate cut, pushing down US Treasury yields and providing a temporary boost to gold prices; on the other hand, it weakened gold's appeal as an inflation hedge, leading to profit-taking by long positions. Combined with other precious metal market dynamics such as silver hitting a record high and palladium reaching a three-year peak, this gold price fluctuation reveals the uncertainty in the global economic recovery, providing investors with an excellent window to examine the future trend of gold. Technical aspects: From a technical chart perspective, spot gold remains in a clear bullish pattern. On the weekly chart, the price is trading above a 14-month-long upward channel, indicating a healthy overall structure. However, the Relative Strength Index (RSI) has been above 70 for an extended period, clearly suggesting the market is overbought. This doesn't necessarily mean a trend reversal is imminent, but rather that a cooling-off or correction is needed in the short term to release excess pressure. On the upside, $4380, as a historical high, has become a new resistance level. A successful break and hold above this level, without significant overbought conditions, could potentially trigger a new wave of momentum, targeting the psychologically important $5000 mark. But before that, the market is more likely to undergo a period of consolidation. After all, any asset needs time to consolidate its gains following such a sharp rise. Strategy Signals: Buy : 4290-4300, stop loss :4280, target: 4340,4375Gold in 2026: How far can the surge go?
TheodoreSilas
طلا منتظر چیست؟ تحلیل حرکت بزرگ بعدی در بازار پس از تثبیت قیمتی!
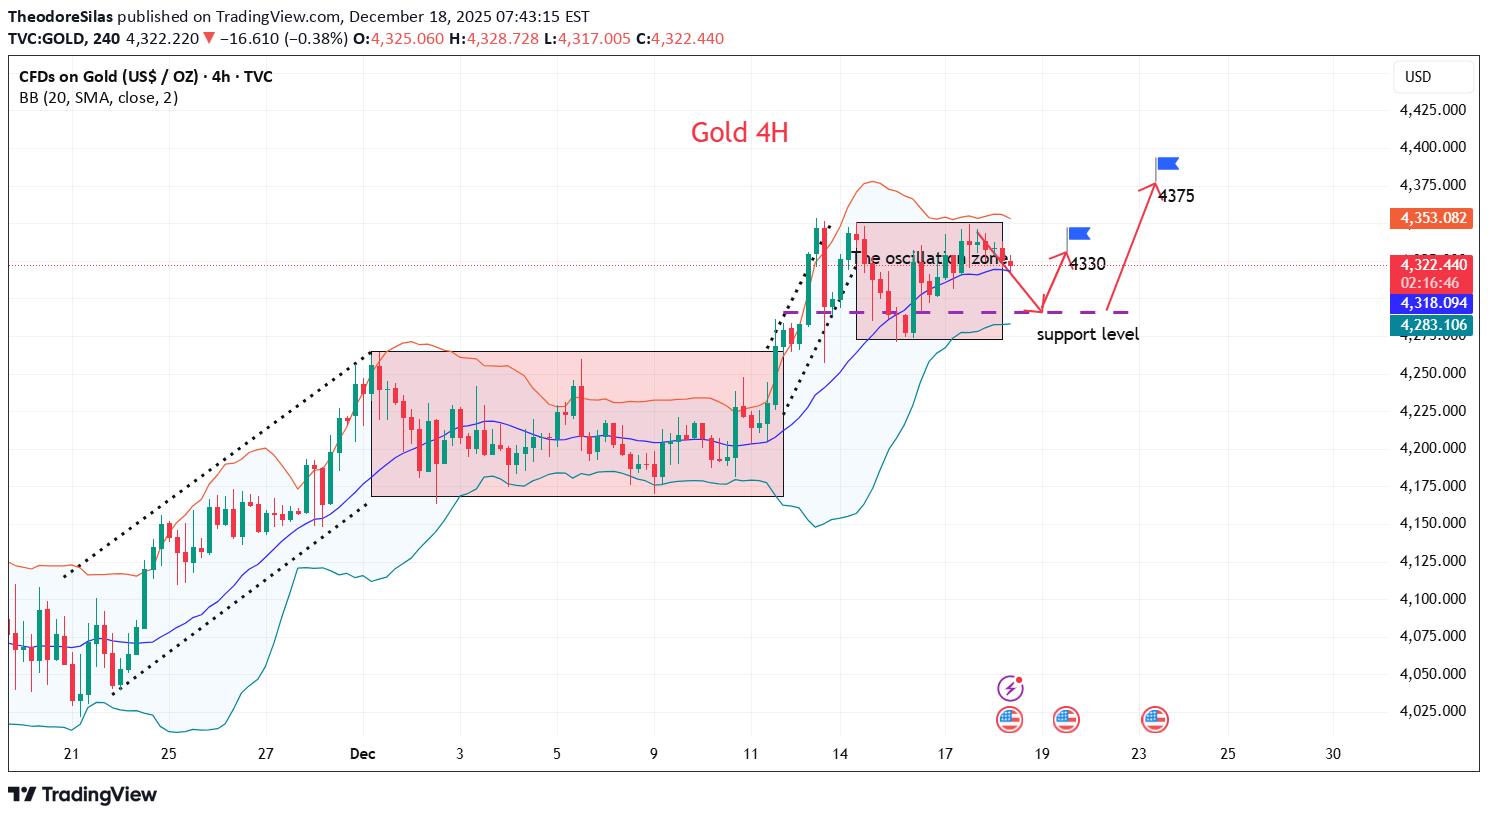
https://www.tradingview.com/x/sDWTRcJ0/ news: The US dollar index rose and then fell on Wednesday. Data released yesterday by the UK Office for National Statistics showed that the November Consumer Price Index (CPI) fell to 3.2% year-on-year, lower than October's 3.6% and also below economists' expectations of 3.5%. This is the lowest level for the index since March of this year. Affected by the unexpectedly low inflation, the pound sterling plunged against the dollar, with its intraday decline widening to as much as 0.69%. This data makes a rate cut by the Bank of England today virtually certain. The US's tough stance triggered safe-haven buying of gold and silver, while crude oil prices also rose after the US blocked oil tankers entering and leaving Venezuela. Technical aspects: Gold prices have been consolidating at high levels for a long time, with the Bollinger Bands narrowing and the MACD fast and slow lines converging and crossing, potentially forming a golden cross. The triangle pattern is poised to break, with the previous high serving as a key resistance level and the 4300 level as a crucial support. Currently, all indicators and moving averages are diverging upwards, suggesting a mysterious bullish force. If gold prices break through the short-term resistance at 4350, we must look towards the previous historical high of 4380-4385. This area previously formed a double top resistance level, leading to a significant pullback. If gold prices touch this historical high again, we need to be wary of another potential setback – could a triple top resistance form? This is one possible scenario. However, in terms of trading strategy, we should still adhere to the principle of buying on dips and corrections. Strategy Signals: Buy : 4290-4295, stop loss :4280, target: 4330,4375Did you notice the highest point of 4376?
TheodoreSilas
Gold rose instead of falling after non-farm payrolls data?
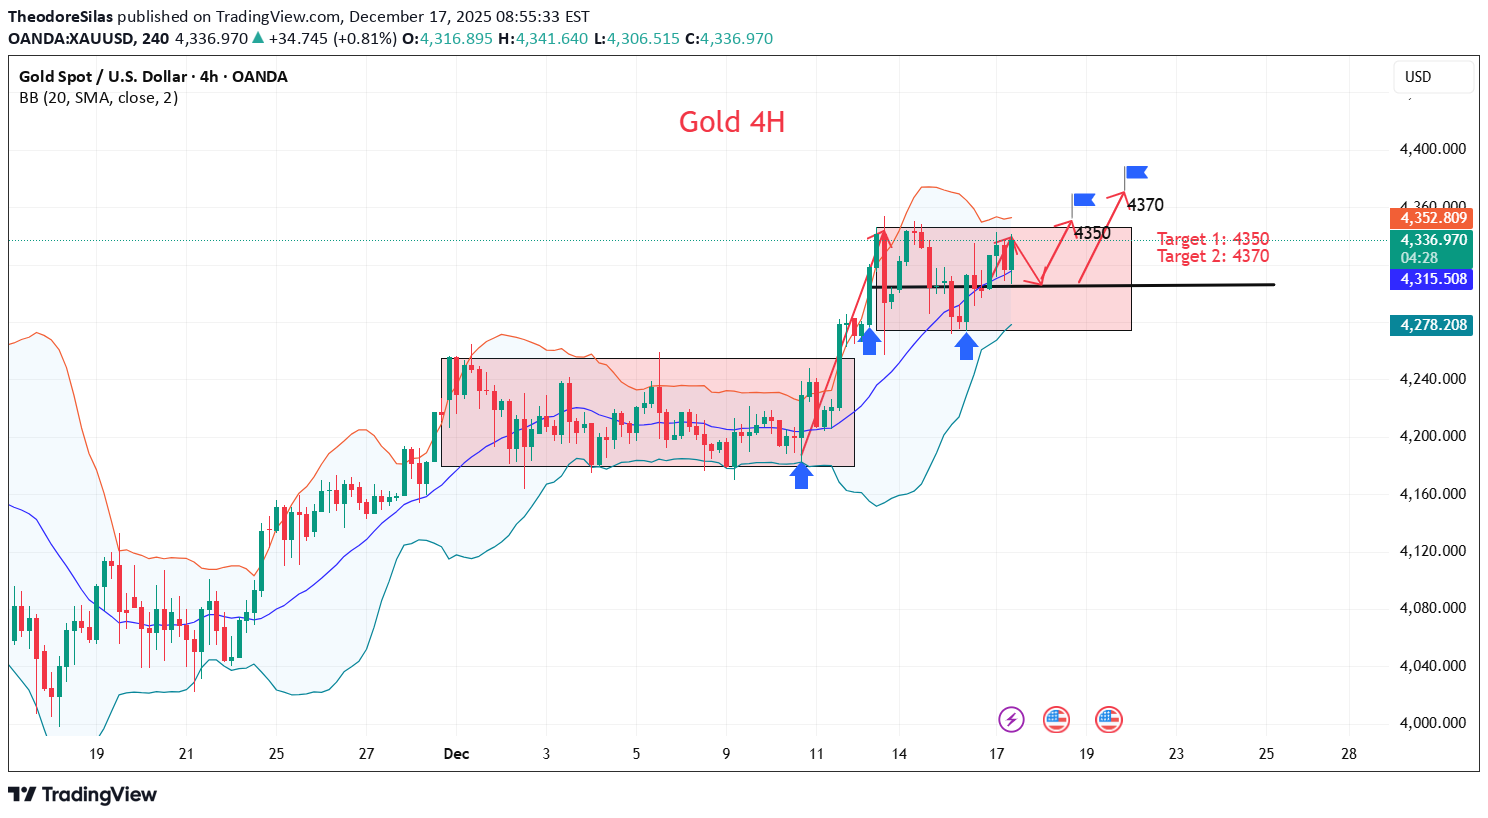
https://www.tradingview.com/x/92rF1Tmc/ news: The spot gold market has seen a frenzied surge in 2025, breaking historical records 50 times so far and currently holding a firm grip on the $4,300/ounce level. While the market is immersed in bullish euphoria, two opposing viewpoints are clashing fiercely: top investment banks like Goldman Sachs are proclaiming an aggressive target of $4,900 by the end of 2026, while Avi Gilbert, the veteran technical analyst who accurately predicted the 2011 gold price peak, is issuing a fatal warning—this decade-long bull market is nearing its end, and a multi-year bear market is about to begin. The Federal Reserve's interest rate cut cycle provides another layer of support for gold prices. Goldman Sachs predicts that the Fed will cut interest rates by a cumulative 100 basis points by 2026, with the federal funds rate expected to decline significantly before the second quarter. This will continue to enhance the attractiveness of gold as a non-interest-bearing asset. Coupled with global geopolitical risks and concerns about sovereign debt crises, gold's safe-haven properties are being continuously strengthened, making it a core choice for asset diversification. Technical aspects: Gold 4-hour chart: Yesterday closed with another doji candlestick, repeatedly testing 4350 before retreating, but the closing price remained firm above the 5-period moving average, indicating a strong sideways consolidation at high levels. However, caution is advised against a sudden upward surge after this consolidation. Therefore, in the short term, it's recommended to try a bullish approach within the consolidation range, maintaining a core position. A successful break above 4350 would target 4381 and 4400; the higher the price, the harder it is to fall. The current upward trend remains intact. Strategy Signals: Buy : 4305-4315 stop loss :4295 target: 4350,4370The 4350 resistance level is key to the upward movement.
TheodoreSilas
Will gold prices continue to rise following non-farm payrolls?
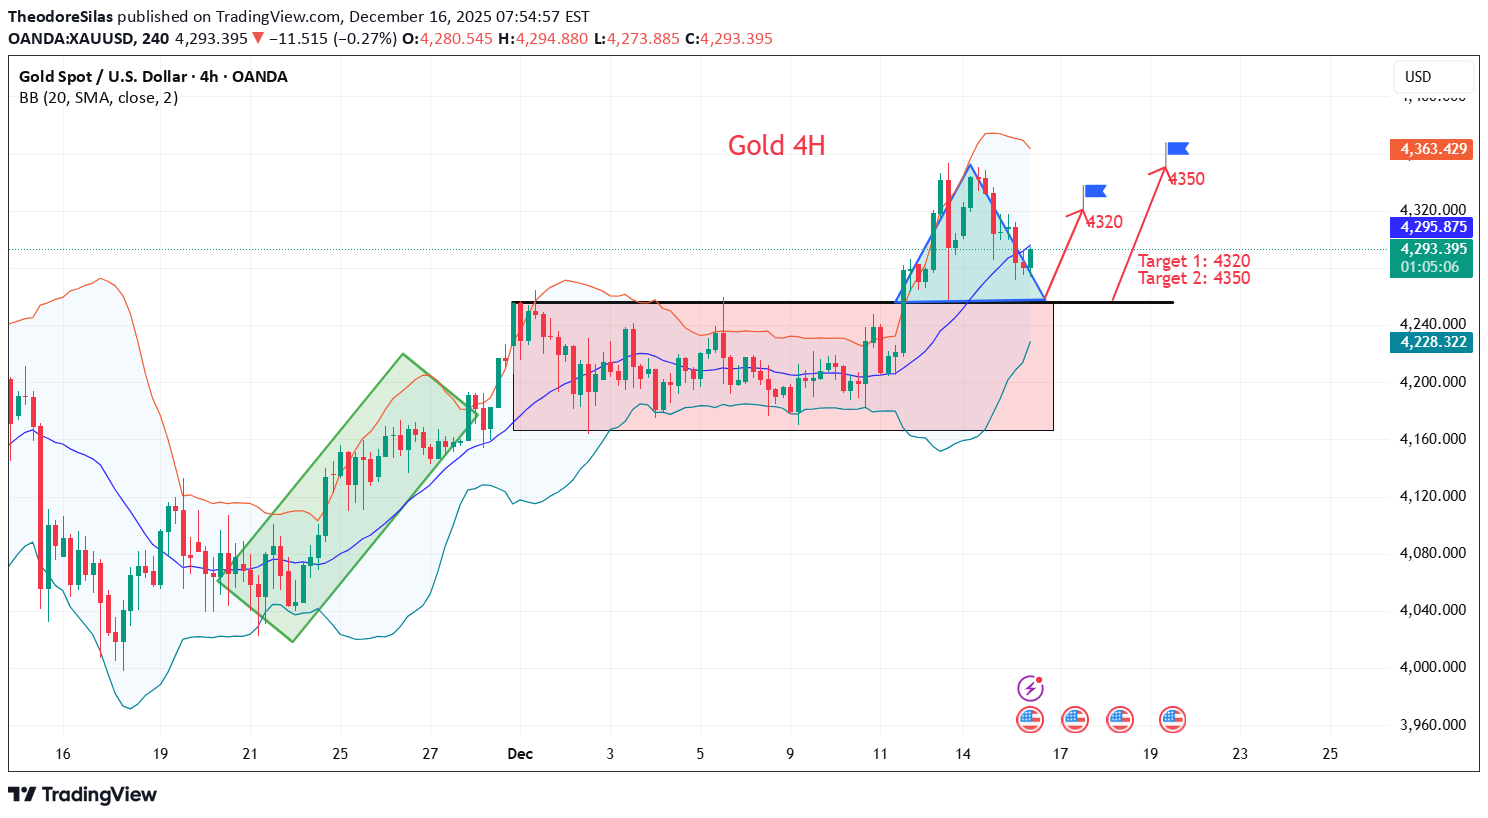
https://www.tradingview.com/x/xmOHdgfD/ news: Tuesday, December 16th. Spot gold traded around $4290 in early European trading, with the market consolidating near a key level. Recent macroeconomic developments have revolved around the monetary policy paths of major central banks, with the Federal Reserve's further softening of its policy stance being a core variable supporting precious metal prices. Against this backdrop, although gold prices experienced a brief pullback, the overall bullish trend remains intact, and it is approaching a significant technical breakout zone. Despite short-term pressures, the potential downside for gold prices is expected to be limited. Last week, the U.S. Federal Reserve implemented its third interest rate cut this year and clearly signaled that further rate cuts would continue into 2026. Lower interest rates will significantly reduce the opportunity cost of holding non-yielding gold, thus providing solid support for the precious metal. However, optimistic progress in the Ukraine peace negotiations may limit gold's upside potential, as this would reduce market demand for safe-haven assets. Technical aspects: After a continuous rise, gold's upward momentum has encountered resistance in the short term, and the price is now consolidating at high levels. Support for gold can be seen around $4260, the level broken last Thursday. A break below this level could increase the risk of a short-term pullback, with further support at the 10-day moving average around $4240, followed by the psychological level of $4200. Resistance for gold can be seen at the psychological level of $4300, and then at $4320, the level where gold rebounded on Monday but encountered resistance twice on Tuesday, which is also the intraday high. A break above this level could lead to further gains in the short term, with the $4350 high from Monday being a key level to watch. The 5-day moving average is in a golden cross and trending upwards, but the MACD golden cross is showing a clear slowdown, the RSI golden cross is turning downwards, and the KDJ indicator is beginning to form a death cross. Short-term technical indicators suggest that after a continuous rise, gold may need a correction, although the overall upward trend remains intact. Strategy Signals: Buy : 4250-4255, stop loss :4240, target: 4300,4320,4350Amid global turmoil, gold remains the preferred safe-haven asset.
TheodoreSilas
Expectations of monetary easing support gold price increases
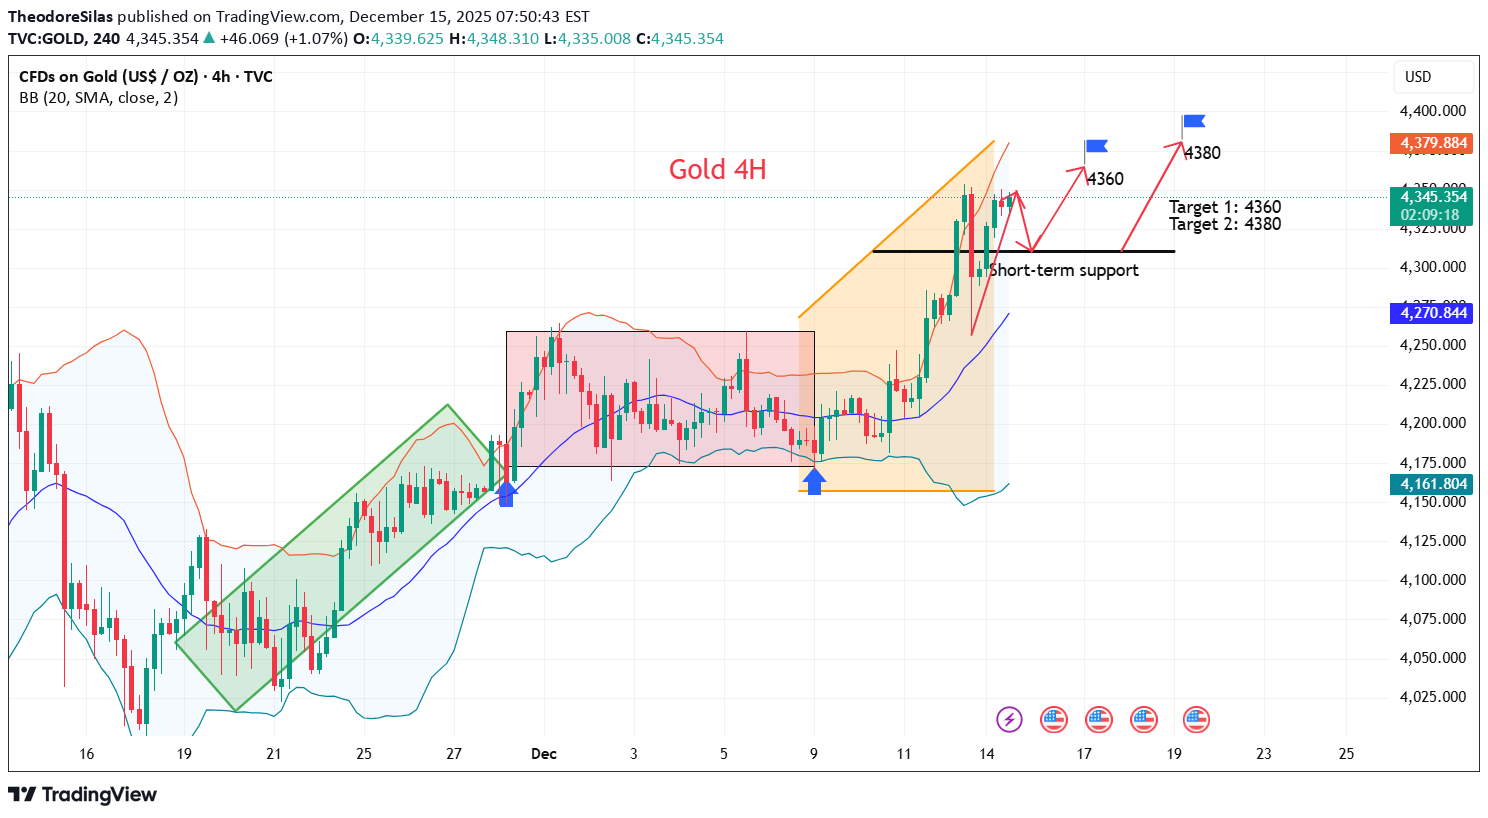
https://www.tradingview.com/x/SGhfvOgl/ news: Gold prices continued to fluctuate at high levels in pre-market trading on Monday (December 15), reaching their highest level in nearly seven weeks. From an overall market perspective, the uncertainty surrounding the Federal Reserve's monetary policy path, the ongoing geopolitical risks, and the temporary return of safe-haven funds are the main driving factors currently driving the precious metals market. The evolution of the Federal Reserve's monetary policy path has become the core variable dominating gold price movements. Federal Reserve Chairman Powell stated at a press conference that the current interest rate level puts the central bank in a comfortable position to await further developments in economic data. It is noteworthy that the interest rate decision was not unanimously approved; three policymakers voted against it, indicating a significant disagreement within the committee regarding the assessment of inflation and the health of the labor market. Technical aspects: On the 4-hour chart, gold broke out of its nearly two-week consolidation range last week, accelerating its short-term upward momentum and demonstrating strong performance. For support, watch the $4330 level, a key level for a short-term breakout during the Asian session, followed by the psychological level of $4310, where gold found support and rebounded earlier this morning. For resistance, watch the $4355 level, the high from last Friday. Gold has currently encountered resistance at this level; a break above this level would target the historical high of $4380. The 5-day moving average and MACD indicator are both showing a golden cross, as are the RSI and KDJ indicators. Short-term technical indicators suggest that gold has the potential for further gains after ending its consolidation phase. Strategy Signals: Buy : 4310-4315, stop loss :4300, target: 4360, 4380Gold is being repriced, poised for new highs?
TheodoreSilas
آیا روند صعودی طلا شکسته شد؟ آینده قیمت سکه پس از عقبنشینی از اوجها
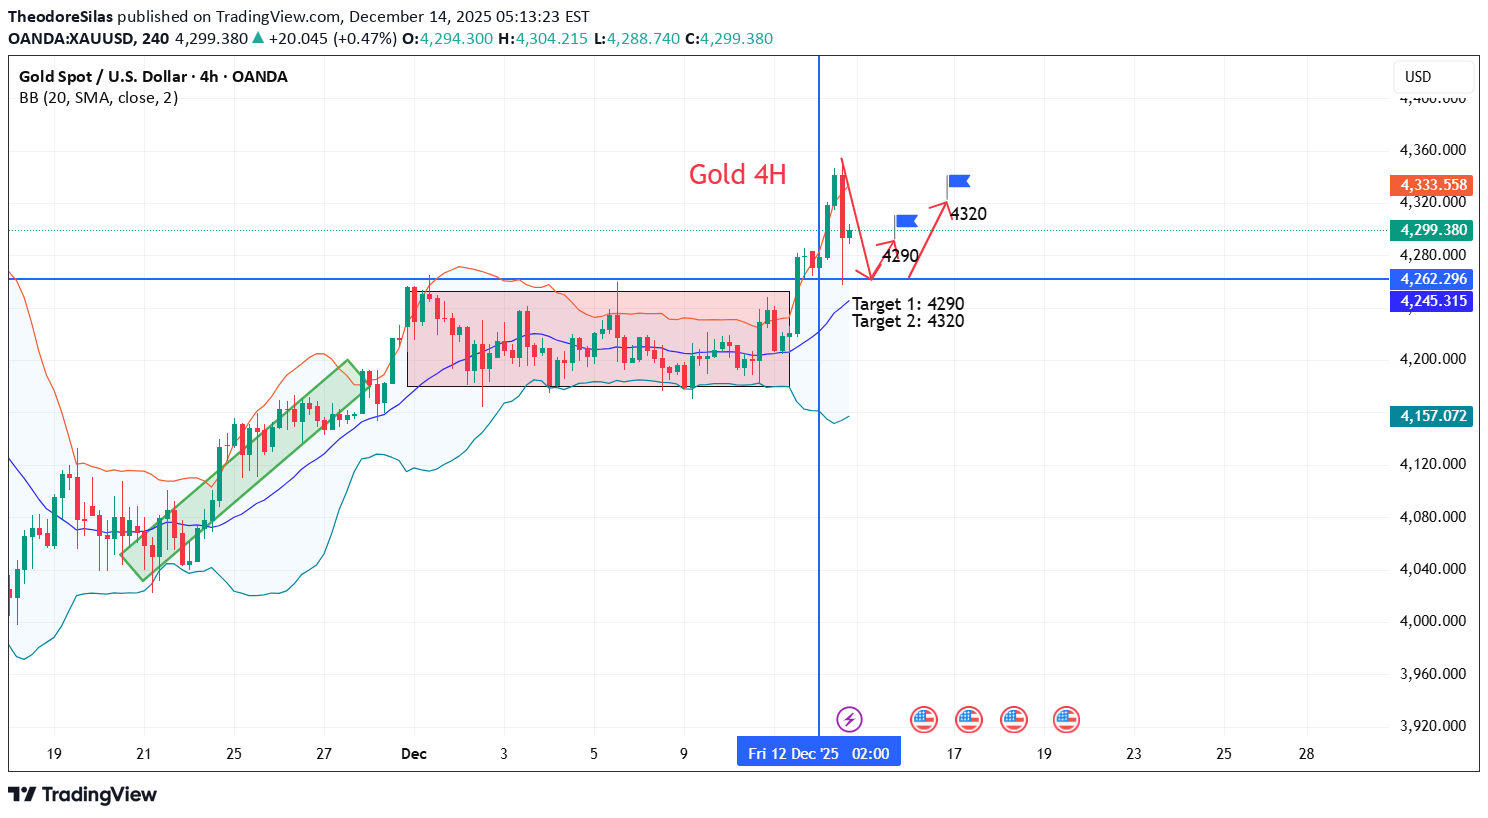
https://www.tradingview.com/x/GQ2gHaO5/ news: Following the Fed's rate cut this week, market expectations for further easing policies have continued to rise, directly driving gold's strong upward trend. The Fed's dovish tone has provided solid buying support for gold prices. Currently, it is trading around 4300. Although the Fed did not provide clear forward policy guidance, Chairman Jerome Powell clearly signaled a "very low probability of a near-term rate hike" after the decision. While reiterating its signature data-dependent policy framework, he also emphasized the balance of two-way risks facing the Fed's dual mandate. This dovish stance far exceeded previous market expectations. Meanwhile, the Fed's latest dot plot is very dispersed, indicating that voting members still have room to explore the path of future rate cuts. Technical aspects: Gold's 4-hour chart remains generally bullish, but strong selling pressure persists, ultimately causing it to retreat from its highs. Next week, the key level to watch is the resistance around 4340, the 4-hour high. If it holds above 4340, gold may enter a new large-range consolidation phase, with support around 4255. Gold is likely to trade within this large range at the beginning of the week, followed by the release of Tuesday's non-farm payrolls, Thursday's CPI data, and Friday's Bank of Japan interest rate decision to see if a rate hike will occur. With numerous data releases next week, market volatility is expected to be high. Strategy Signals: Buy : 4260-4265, stop loss :4250, target: 4290, 4320Gold prices rose and then fell on Friday, but the outlook remains bullish.As expectedAs expected
TheodoreSilas
سقوط ناگهانی طلا: دلایل ریزش قیمت پس از جهش کوتاه و تحلیل آینده بازار
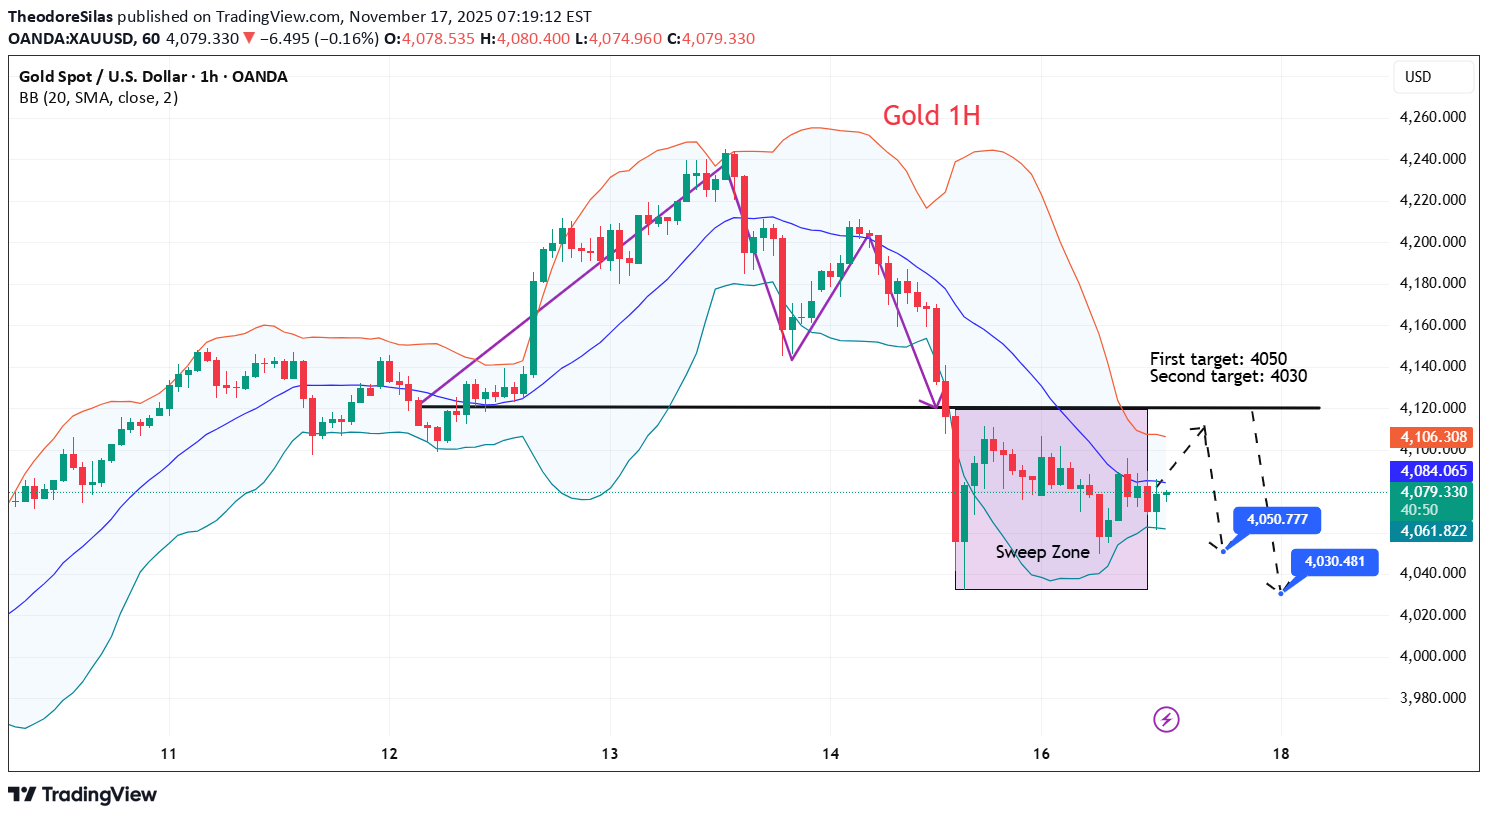
https://www.tradingview.com/x/0irhFXpu/ news: On Monday (November 17), spot gold rose and then fell back. It briefly broke through the $4,100 mark in early trading and rose moderately to $4,105 per ounce during the Asian session. It then fluctuated and weakened, falling back below $4,100 and touching a low of $4,050. It maintained a defensive posture for the third consecutive day on Monday. The highly anticipated October US non-farm payrolls report will be released on Thursday, followed by the FOMC minutes on Wednesday. These will play a crucial role in influencing short-term dollar price dynamics and providing some meaningful impetus to precious metals. Friday's preliminary manufacturing PMI figures for Europe and the US, along with the revised University of Michigan Consumer Sentiment Index, could amplify market volatility, especially if they indicate persistent inflation or weak consumption. Additionally, Friday will see the release of monthly US state employment and unemployment data for October 2025, which investors should also pay close attention to. Technical Analysis: The weakness below the 200-period SMA on the 4-hour chart may find some support near Friday's low of around $4,030. Following that is the psychological level of $4,000; a decisive break below this level could allow gold prices to accelerate their decline towards the $3,930 support level, then the $3,900 level, and finally the late October low of around $3,885. There are many negative signals on the 1-hour chart. The price is clearly constrained by the Bollinger Middle Band (4100). The RSI is converging at the 50 level and showing a downward trend. The MACD has entered the oversold zone, but there is still no clear indication of a rebound. Signal: Buy:4115-4110 SL:4125 TP:4030-4050Internal divisions within the Federal Reserve! 50% chance of rate cuts shattered, gold bulls paralyzed.
TheodoreSilas
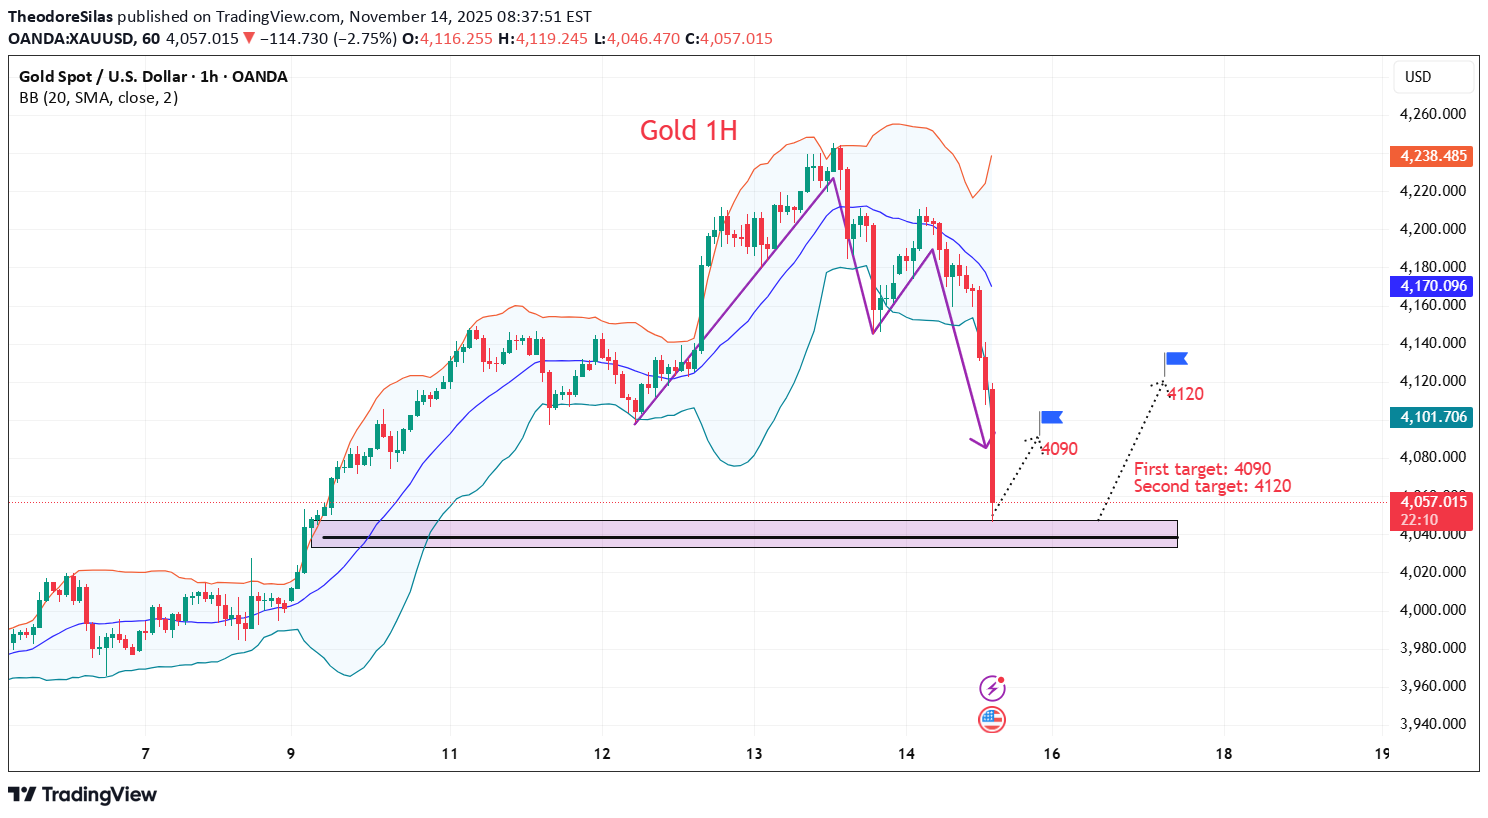
قیمت طلا پس از سقوط سنگین: آیا کفسازی آغاز میشود یا سقوط ادامه دارد؟
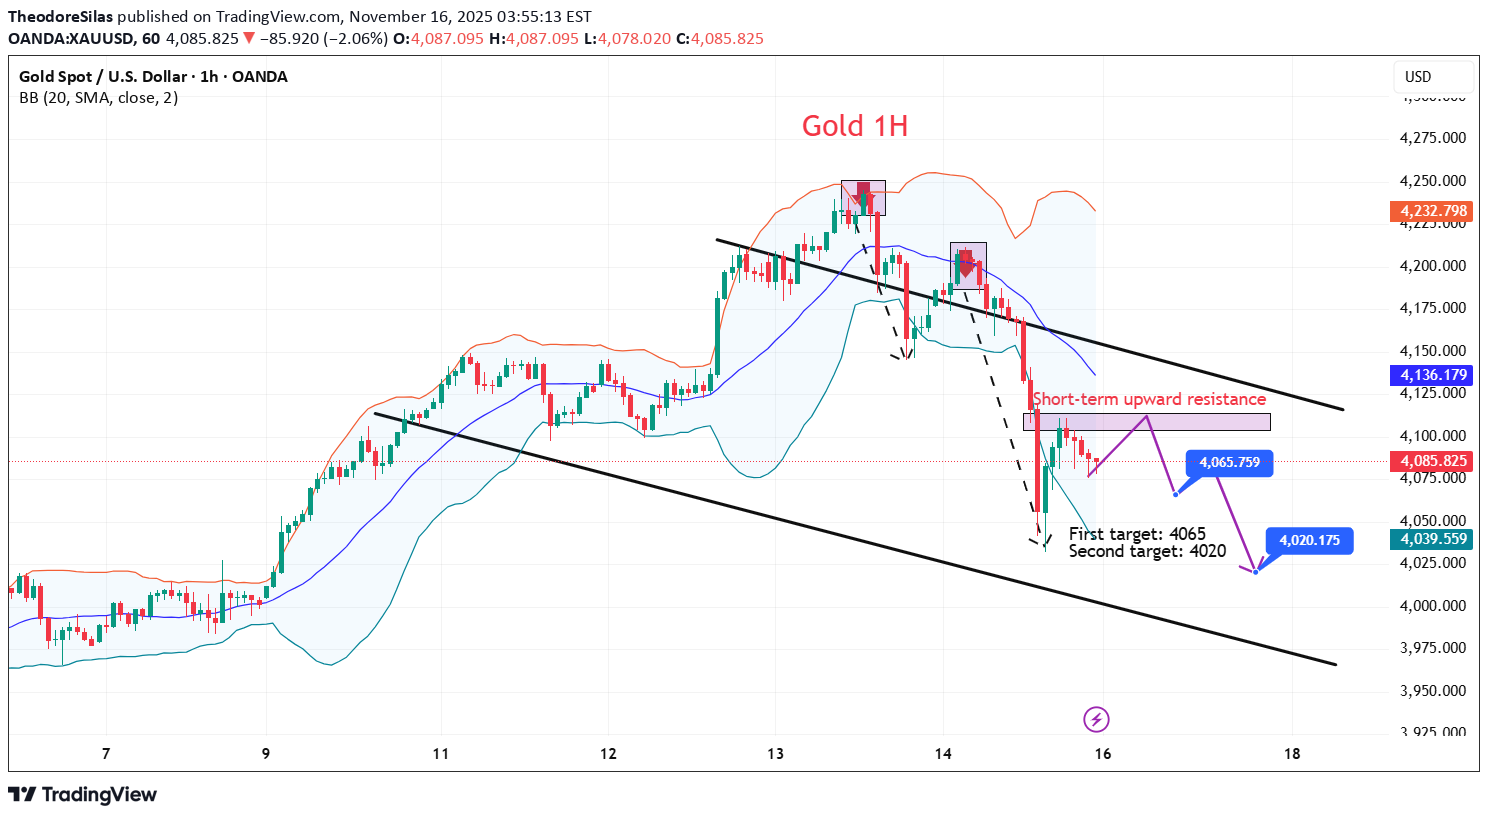
https://www.tradingview.com/x/NPcRawjU/ News: Spot gold prices plunged 2% on Friday (November 14th) as hawkish comments from Federal Reserve officials dampened market expectations for a December rate cut, triggering a massive sell-off. Gold itself does not earn interest and typically performs well in low-interest-rate environments, and is also seen as a safe haven during times of economic uncertainty. With the US government shutdown ending, investors are awaiting clearer information on how the backlog of economic data will be processed and how this data will reflect the state of the US economy. Technical aspects: From a 1-hour technical analysis perspective, the daily chart closed bearish, indicating a significant drop and strong short-term upward pressure. Market sentiment is less optimistic, and the 4000 level is crucial. If it holds, the price may consolidate for a while; however, a break below this level could see gold prices fall to around 3930 or even lower, potentially finding support near 3885. On the 4-hour chart, the price is in a consolidation phase. If it can recover lost ground and reclaim key moving averages, the bulls still have some hope; otherwise, the bears may continue their aggressive selling. Trading strategy: Buy:4115-4110, SL: 4125, TP: 4065-4020If gold prices remain below short-term moving averages, it will strengthen the downward momentum and allow for further declines.
TheodoreSilas
سقوط طلا: اصلاح موقتی است یا آغاز روند نزولی؟ (تحلیل و استراتژی خرید)
https://www.tradingview.com/x/MGyUWUi4/ News: Gold struggled to gain traction above the $4,200 level, with a cautious stance on further easing in the absence of economic data prompting traders to reduce their bets on another rate cut in December. This, in turn, is seen as a key bearish factor for the non-yielding yellow metal. The reopening of the US government has shifted market focus to a deteriorating fiscal outlook. Furthermore, market participants now seem to believe that delayed US macroeconomic data will show some economic weakness and support the rationale for further easing by the Federal Reserve. Technical aspects: In a continuously rising market, a single bearish pullback may be a correction in the bullish trend, not a reversal of the downtrend. Support lies around 4045-50, which is equivalent to the short-term moving average on the daily chart. A break below this level would confirm a potential bearish reversal. The intraday price action is crucial. If the bulls have rallied, the current pullback would confirm a bullish correction. Consider establishing positions around the 4045-50 area. Trading strategy: Buy:4050-4045, SL: 4035, TP: 4090-4120Gold, now is the time to seize the opportunity!
TheodoreSilas
پس از جهش قیمت طلا: تحلیل جدید و استراتژی خرید در بازار!
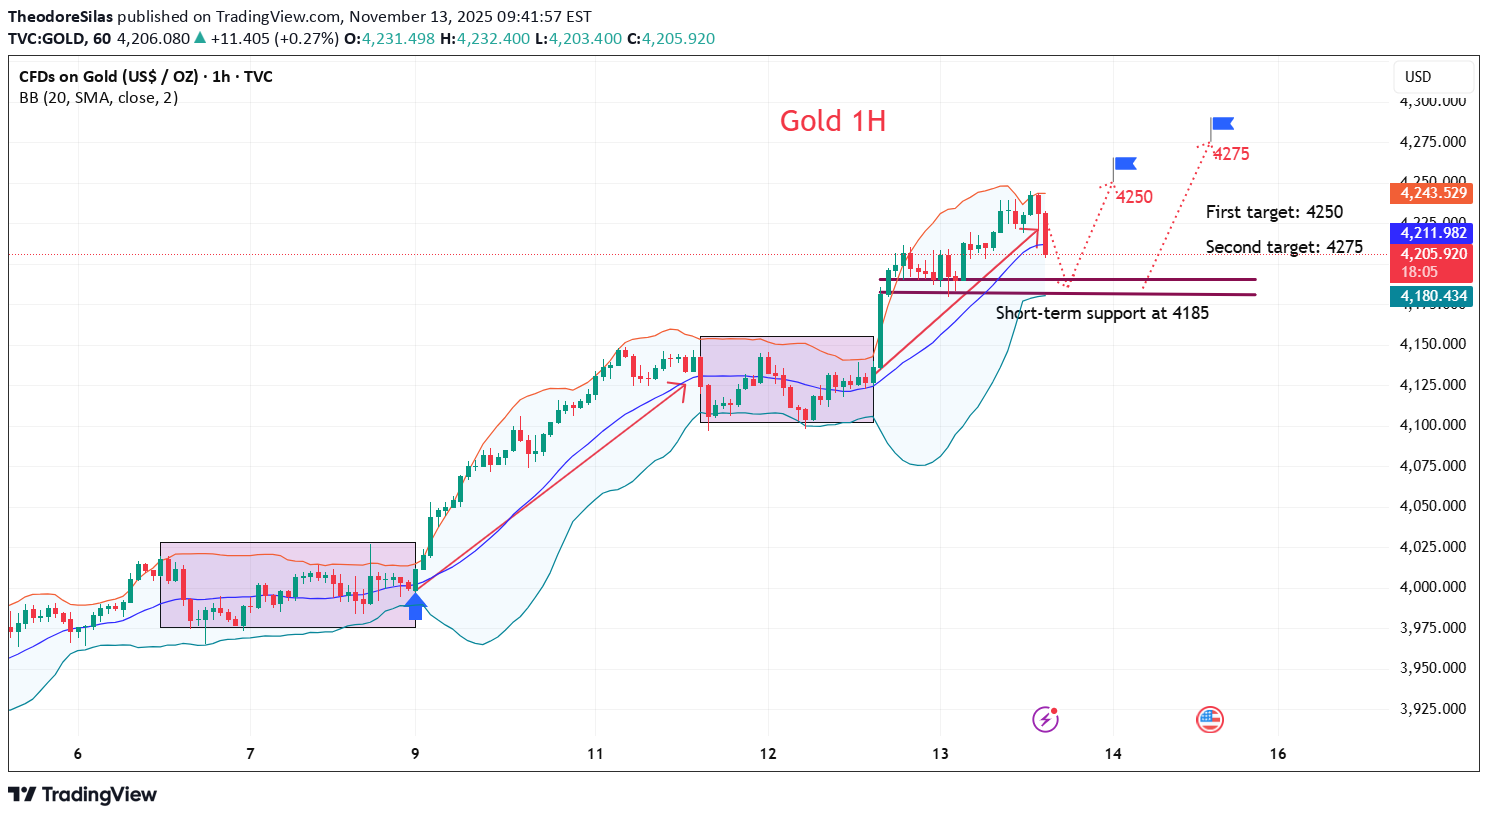
https://www.tradingview.com/x/Yp8goDJm/ News: On Thursday (November 13) in Asian trading, spot gold remained relatively stable after yesterday's surge, currently trading around $4,200 per ounce. On Wednesday evening local time, US President Trump signed a temporary funding bill, ending the longest government shutdown in US history. The bill will provide continued funding for the federal government, ensuring most government agencies have operating funds until January 30, 2026. The end of the US government shutdown means that official economic data will resume being released, paving the way for a Federal Reserve interest rate cut in December. Technical aspects: On the daily chart, after stabilizing last week, gold has continued its rebound this week, showing short-term strength. Support levels to watch are around $4210, near Wednesday's high, and then the intraday low of $4185. Resistance levels to watch are the intraday high around $4240; a break above this level would indicate further strength, with the upside target at the psychological level of $4300, which also coincides with the upper Bollinger Band on the daily chart. The 5-day moving average is trending upwards in a golden cross, the MACD indicator has formed a golden cross, and the KDJ and RSI indicators are also trending upwards in a golden cross, suggesting short-term technical indicators indicate a potential for further gold price rebound. Trading strategy: Buy:4190-4185, SL: 4175, TP: 4250-4275Technical buying in gold has driven the price up, maintaining a bullish trend; buy on dips.
Disclaimer
Any content and materials included in Sahmeto's website and official communication channels are a compilation of personal opinions and analyses and are not binding. They do not constitute any recommendation for buying, selling, entering or exiting the stock market and cryptocurrency market. Also, all news and analyses included in the website and channels are merely republished information from official and unofficial domestic and foreign sources, and it is obvious that users of the said content are responsible for following up and ensuring the authenticity and accuracy of the materials. Therefore, while disclaiming responsibility, it is declared that the responsibility for any decision-making, action, and potential profit and loss in the capital market and cryptocurrency market lies with the trader.