
TheTradeBorough
@t_TheTradeBorough
What symbols does the trader recommend buying?
Purchase History
پیام های تریدر
Filter
Signal Type

TheTradeBorough
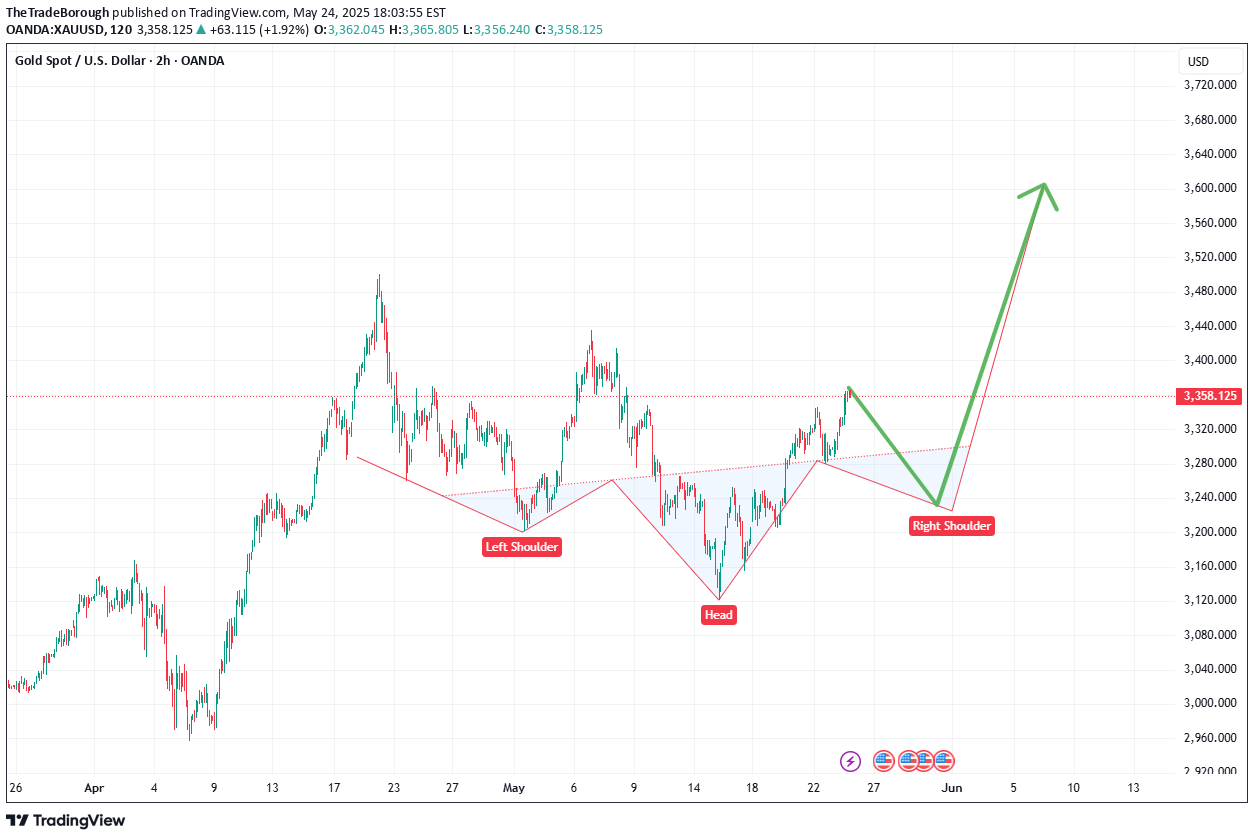
Gold appears to be setting up for a BIG run.....a very simple Inverted Head & Shoulders pattern appears to be in play. A pullback will be needed to kick this off. Let's see what happens...I’m now seeing a dip, pullback then drop!

TheTradeBorough
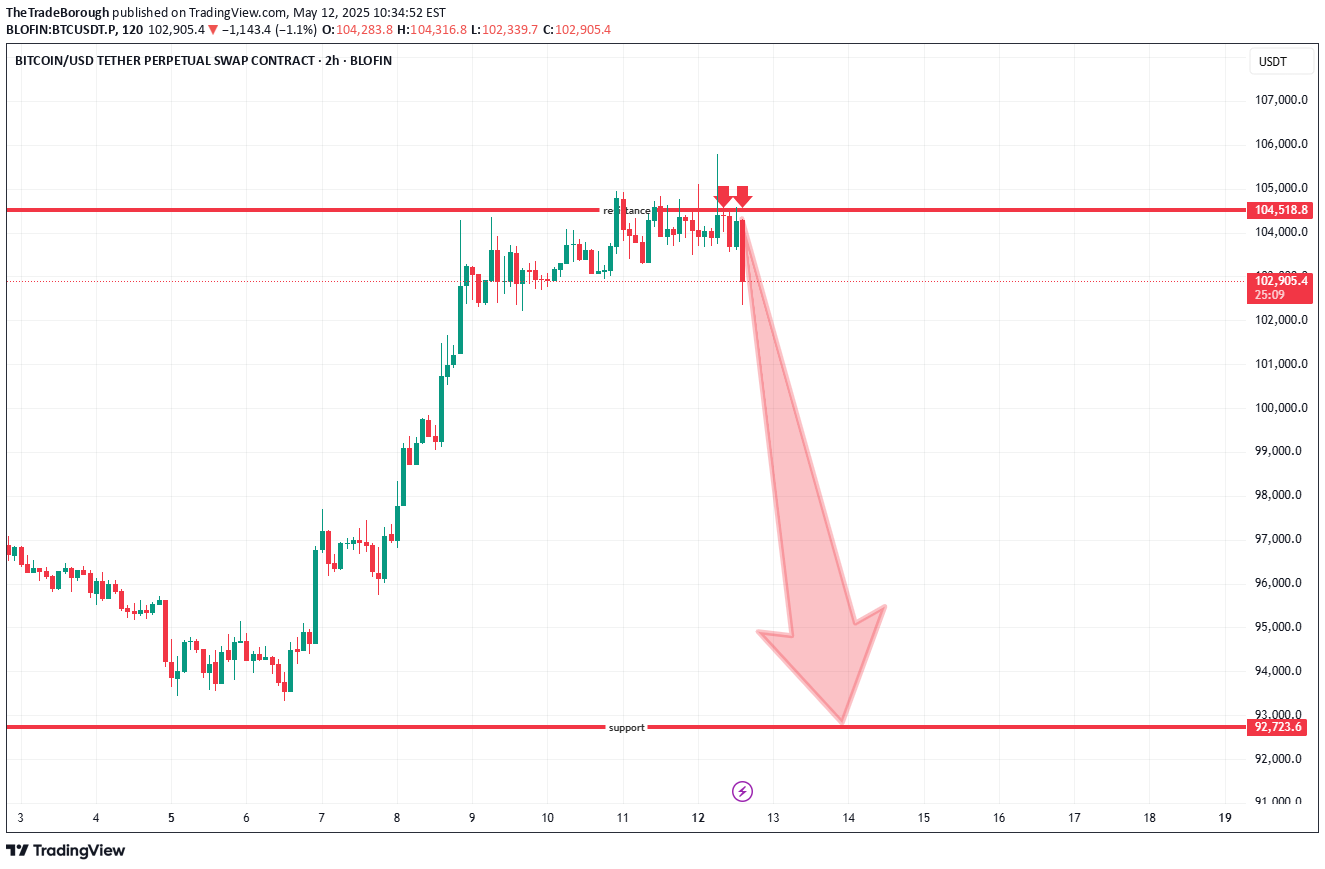
After retracing more than 78.6% from the 74k low, a BTC local top appears to be in. Expecting prices to fall to the local support of 92K initially...

TheTradeBorough
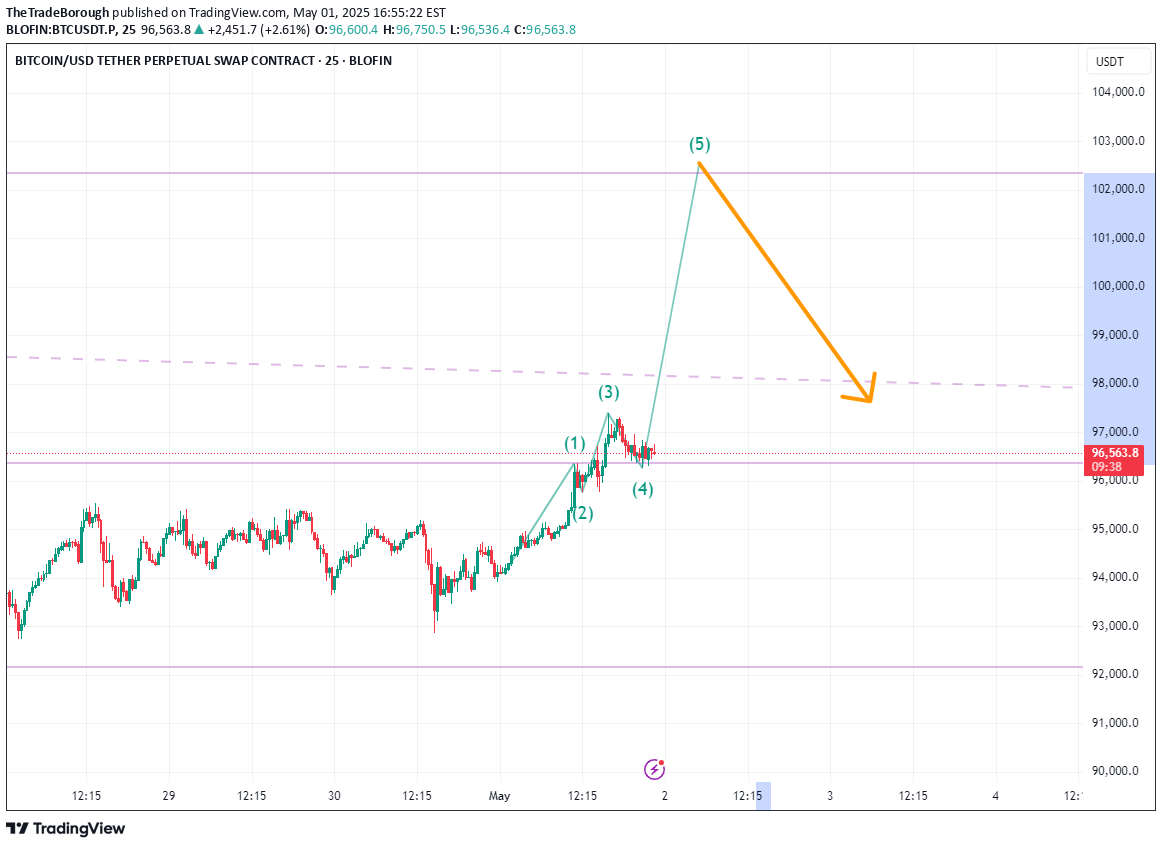
This idea is super concise! Bitcoins price appears to have found support on a 3M 0.618 retracement level. The logical next step would be a leap to the 0.786 retracement level at 102,000. Looks like BTC is loading its canon..

TheTradeBorough
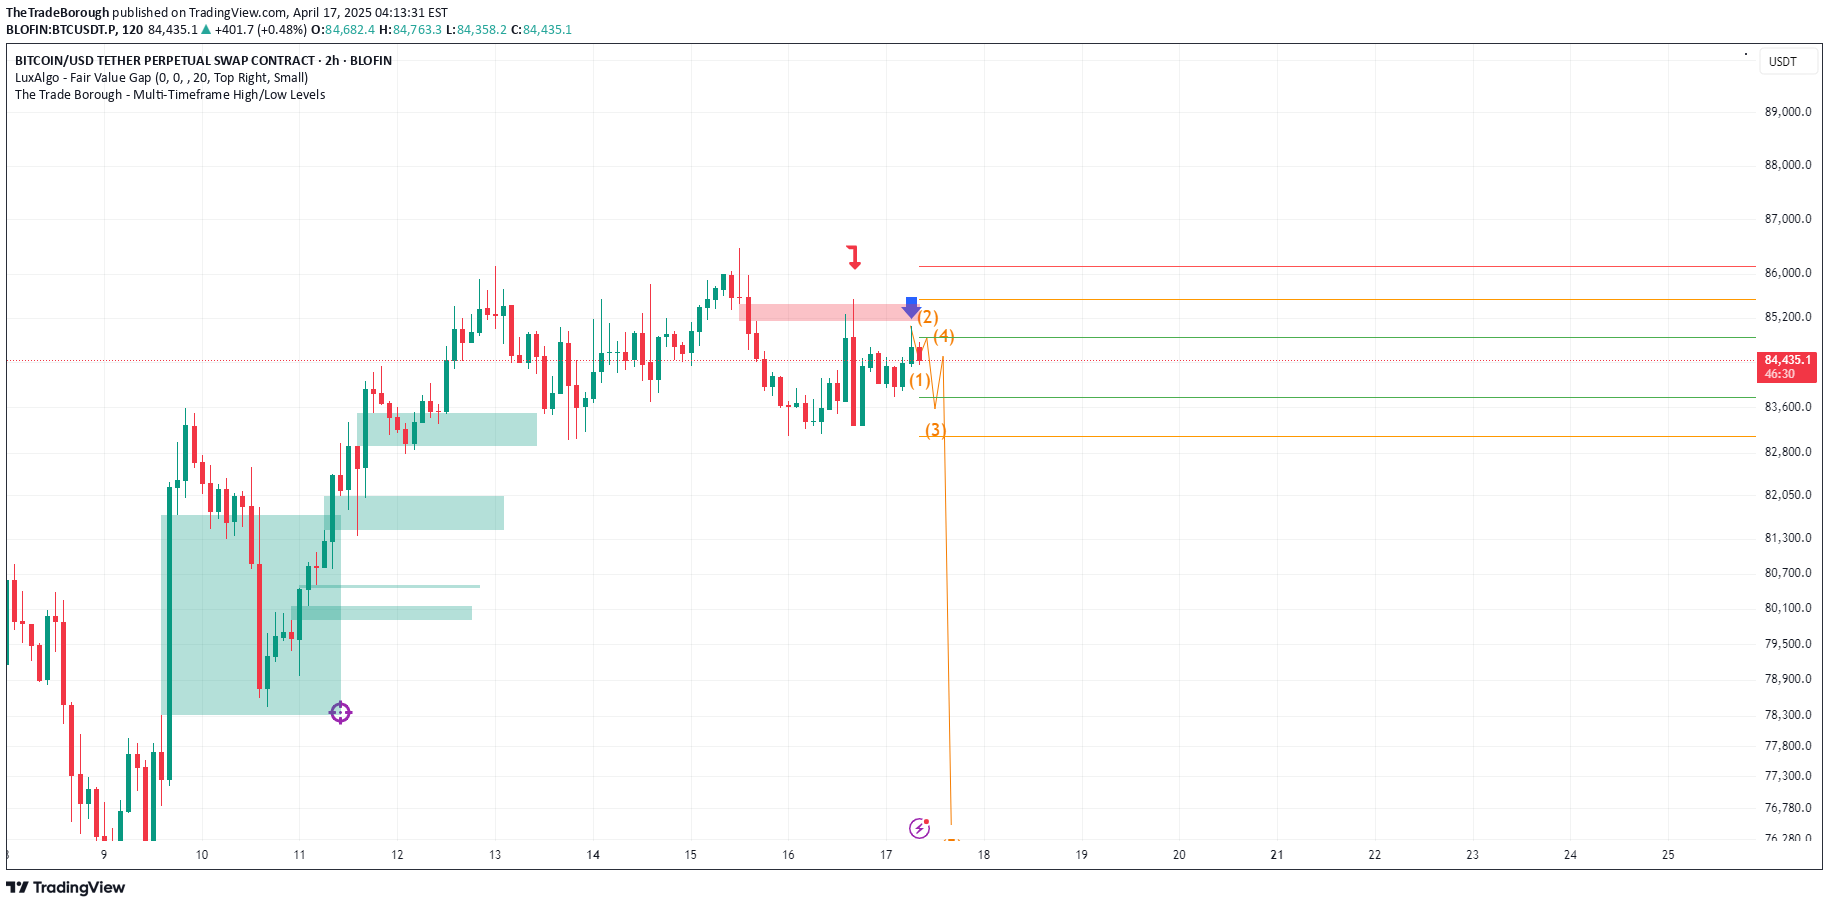
BTC has been ranging since last Friday and therefore the price action has been very tight but one candle has given us a clue about the possible next direction. This has been highlighted by the red arrow. This 2H candle is a bearish engulfing candle, which as a single candle is bearish. Since that candle was printed, the price has currently retraced into that candles range but has failed to break over it. I am speculating that this is a failed high. The blue arrow points to a wick on a subsequent 2H candle which signifies bullish exhaustion and a rejection of that 85000 price level. The Green lines represent the High and Low price of the most recent 7H candle. The Orange lines represents the High and Low price of yesterday's Daily candle. The Red line represents the High and Low price of last week's candle. There is a purple target beside a 2h FVG that I believe that market could be targeting alongside last weeks low.

TheTradeBorough
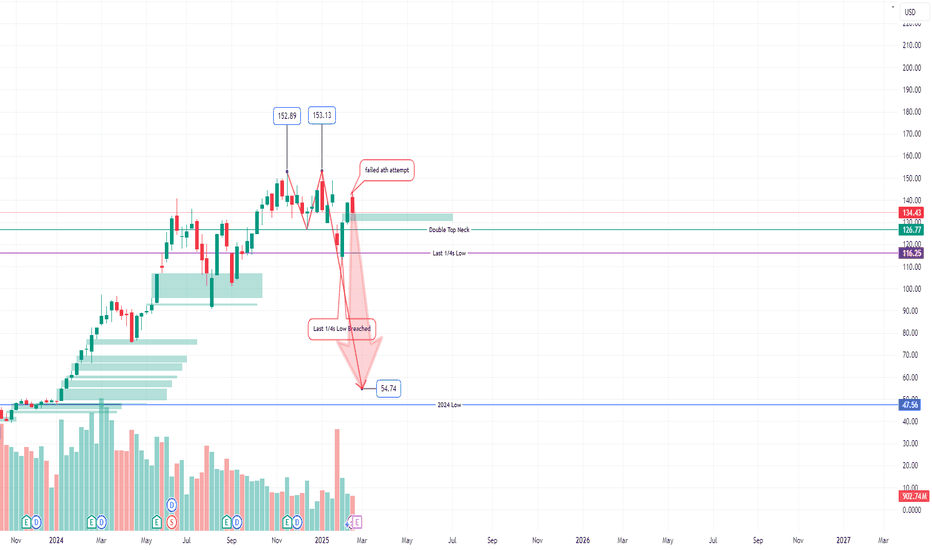
I hadn't looked at the NVDA chart for months until today and I simply can't unsee this. NVDA appears to be in the final stages of a Weekly Double Top pattern. You can clearly see two near equal highs from November 24 and January 25. After the neck of the Double Top was breached, the price attempted to reach a new high but failed. The failed high was powered by 3 consecutive weeks of declining volume which suggests momentum exhaustion. If NVDA price drops through $126, it is very possible that the price could fall towards $55. Why is the price projection so low? The last 1/4 low has already been breached, so this level is unlikely to serve as strong support, leaving the price to potentially falls freely towards 2024's low. The green areas highlight the Bullish Fair Values Gaps for NVDA on the Weekly time frame. As you can see there are numerous and they are all underneath the current price! Won't Earnings push it to ATH? It's of course it's possible. And if it did, it wouldn't necessarily invalidate this set up! Let's see what happens!

TheTradeBorough
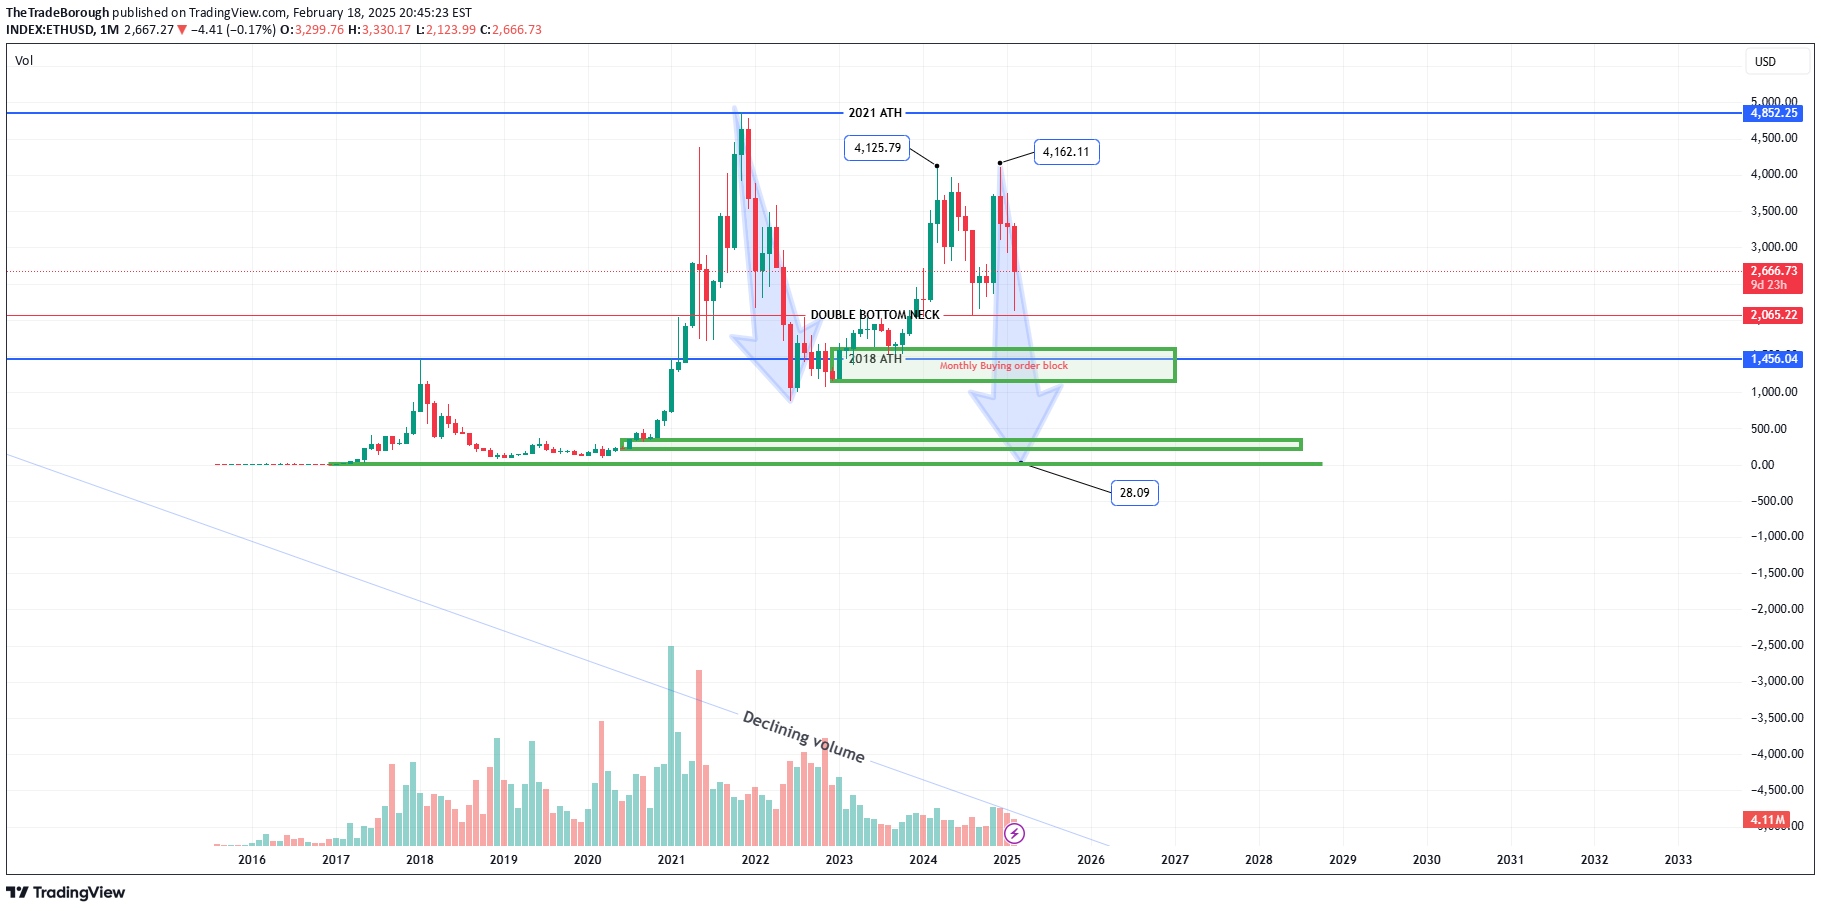
So....I noticed something very odd about the Ethereum chart a couple of weeks ago. I've compared it other to a few other crypto's but I could only see it on Ethereum. A basic technical analysis concept is the breakout and retest. For an asset to keeping pumping, you need of breakout over a new high, eventually come back to the breakout price and then strongly bounce off it. As you can see, Ethereum broke out of the 2018 ATH in March 21, subsequently making a new ATH of $4852 in November 21 and eventually came back to retest the 2018 ATH between June and December 2022. Unlike BTCUSD which tested and smashed the 2021 ATH to pieces in 2024, Ethereum never even tested the 2021 ATH, leaving a lot of traders and investors confused due to the perceived strong correlation with Bitcoin. Ethereum failed twice to make a new ATH after notable rallies. This happened in March 24 and December 24. This is bearish. On top of this fact, the two highs Ethereum made in 2024 were near equal highs making it a double top on the Monthly TF. This is ULTRA BEARISH and very uncommon IMO to see a perfectly formed double top on the Monthly TF. Monthly Trading volume has also been declining since January 2021. There are also large buying fair value gaps, underneath the current price, left behind from all of the previous crypto cycles. If this Monthly double pattern top plays out, there are three natural 'TP' zones based around three Monthly Bullish Order Blocks. These are areas where significant buying support existed previously on the MONTHLY timeframe. The lowest bullish order block starts at $6.74! Ethereum has effectively spent over THREE YEARS consolidating between the 2018 ATH and 2021 ATH, which leads me to believe that the eventual distribution will be violent, powerful and fast. IMO there is nothing remotely bullish about this chart at all from a purely technical basis. Couldn't Ethereum just randomly pump and break the ATH? Anything is possible, but based on the last three years, it is highly unlikely before a huge fall. $2062 is the Double Top Neck. If the prices breaks underneath this price, the oblivion move will be on. The only question then would be how low will it go?!?! Zero may very well be on the cards. Think this is impossible? I'm sure most people thought that about USOIL ETHUSD

TheTradeBorough
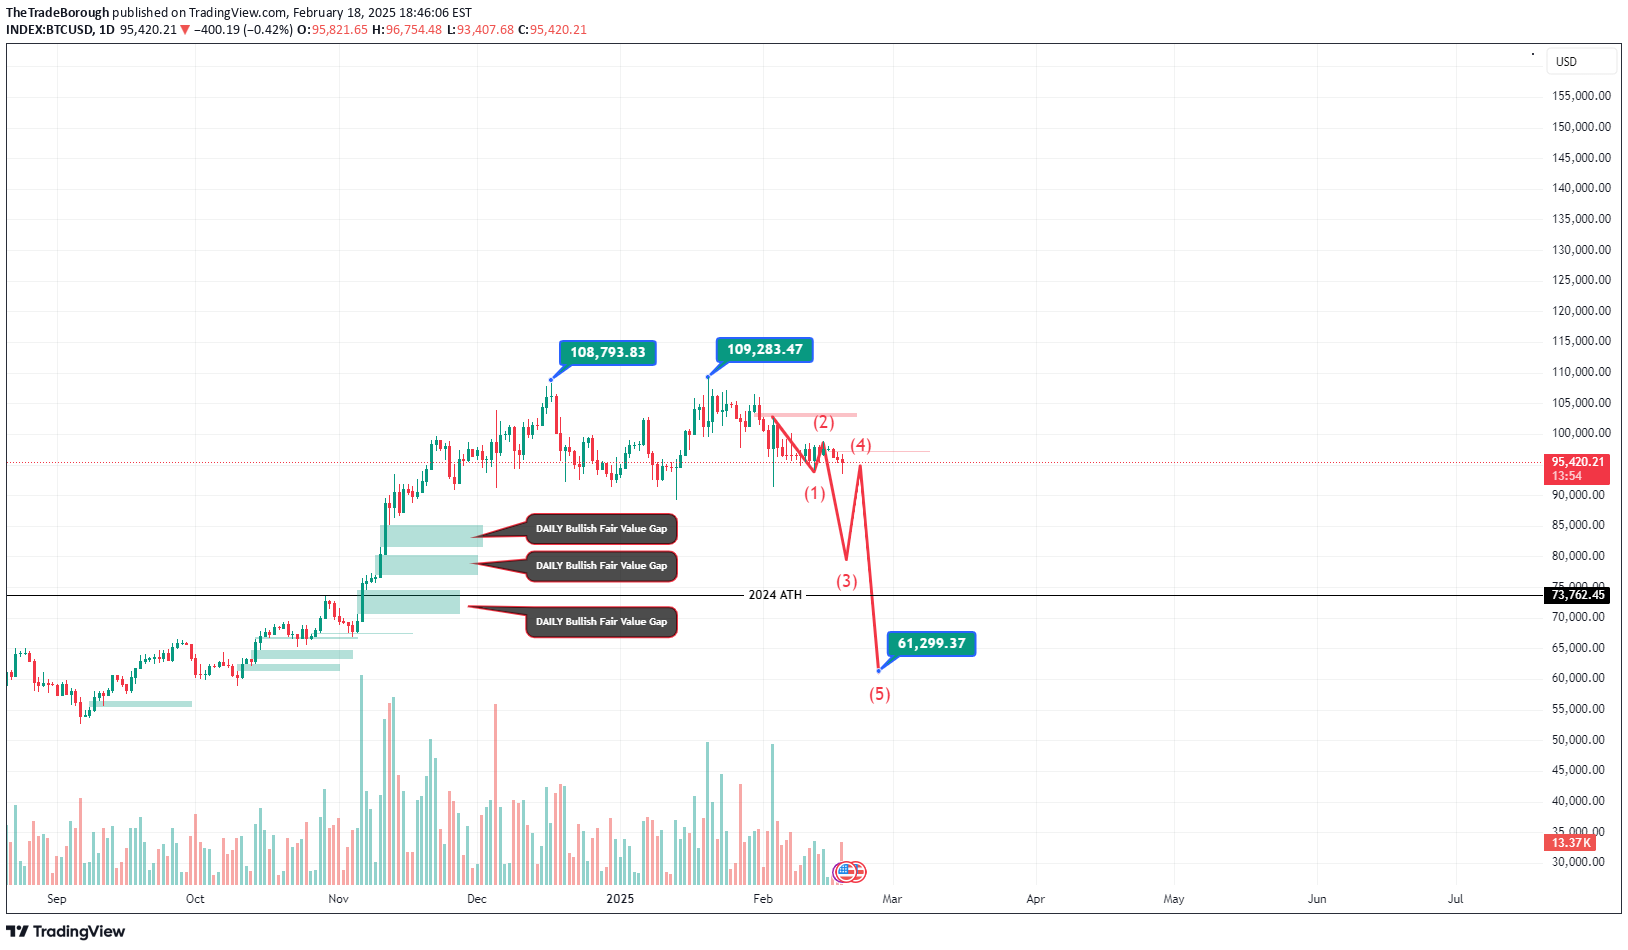
Whenever you have a breakout, for the breakout to be confirmed, it needs to be retested. This is a basic technical analysis concept. We broke out from the 2024 ATH of $74k but it has not been retested yet. After topping at $108k and hitting a near horizontal $109k, Bitcoin has quietly completed a Double Top pattern on the weekly chart which is extremely Bearish. There are Daily and Weekly fair value gaps running down to $61k. The chart shows a simple, logical path of how we could potentially arrive at $61k, including the inevitable pullbacks along the way. This is based 100% on technical analysis. BTCUSDT BTCUSDAfter a period of consolidation, it appears that BITCOIN could reverse sharply to take some small pockets of liquidity above the current price before making the final move back down.... This means that BTC could go as high as 103k before dumping HARD. The pink areas on the chart highlight the selling Fair Value Gaps areas on the Daily chart. High volatility expectedI now believe that this will hit $74k then reverse sharply to 102-104k, invalidating a classic double top

TheTradeBorough
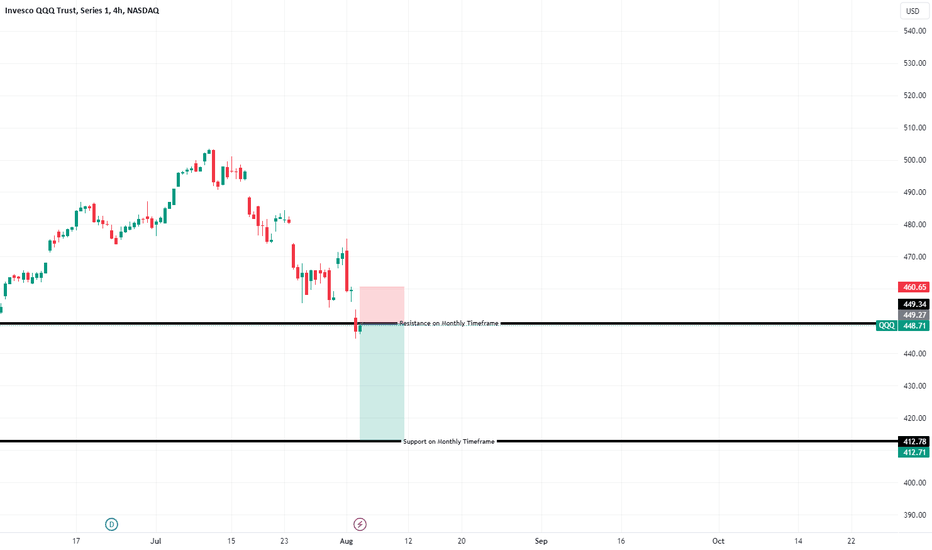
QQQ appears to have retested a Monthly resistance at 449, and we're now expecting a violent bearish move to towards our target of 413. Our Stop Loss, Entry and Target levels are on the chart. What do you think?The move didn't take place when expected

TheTradeBorough
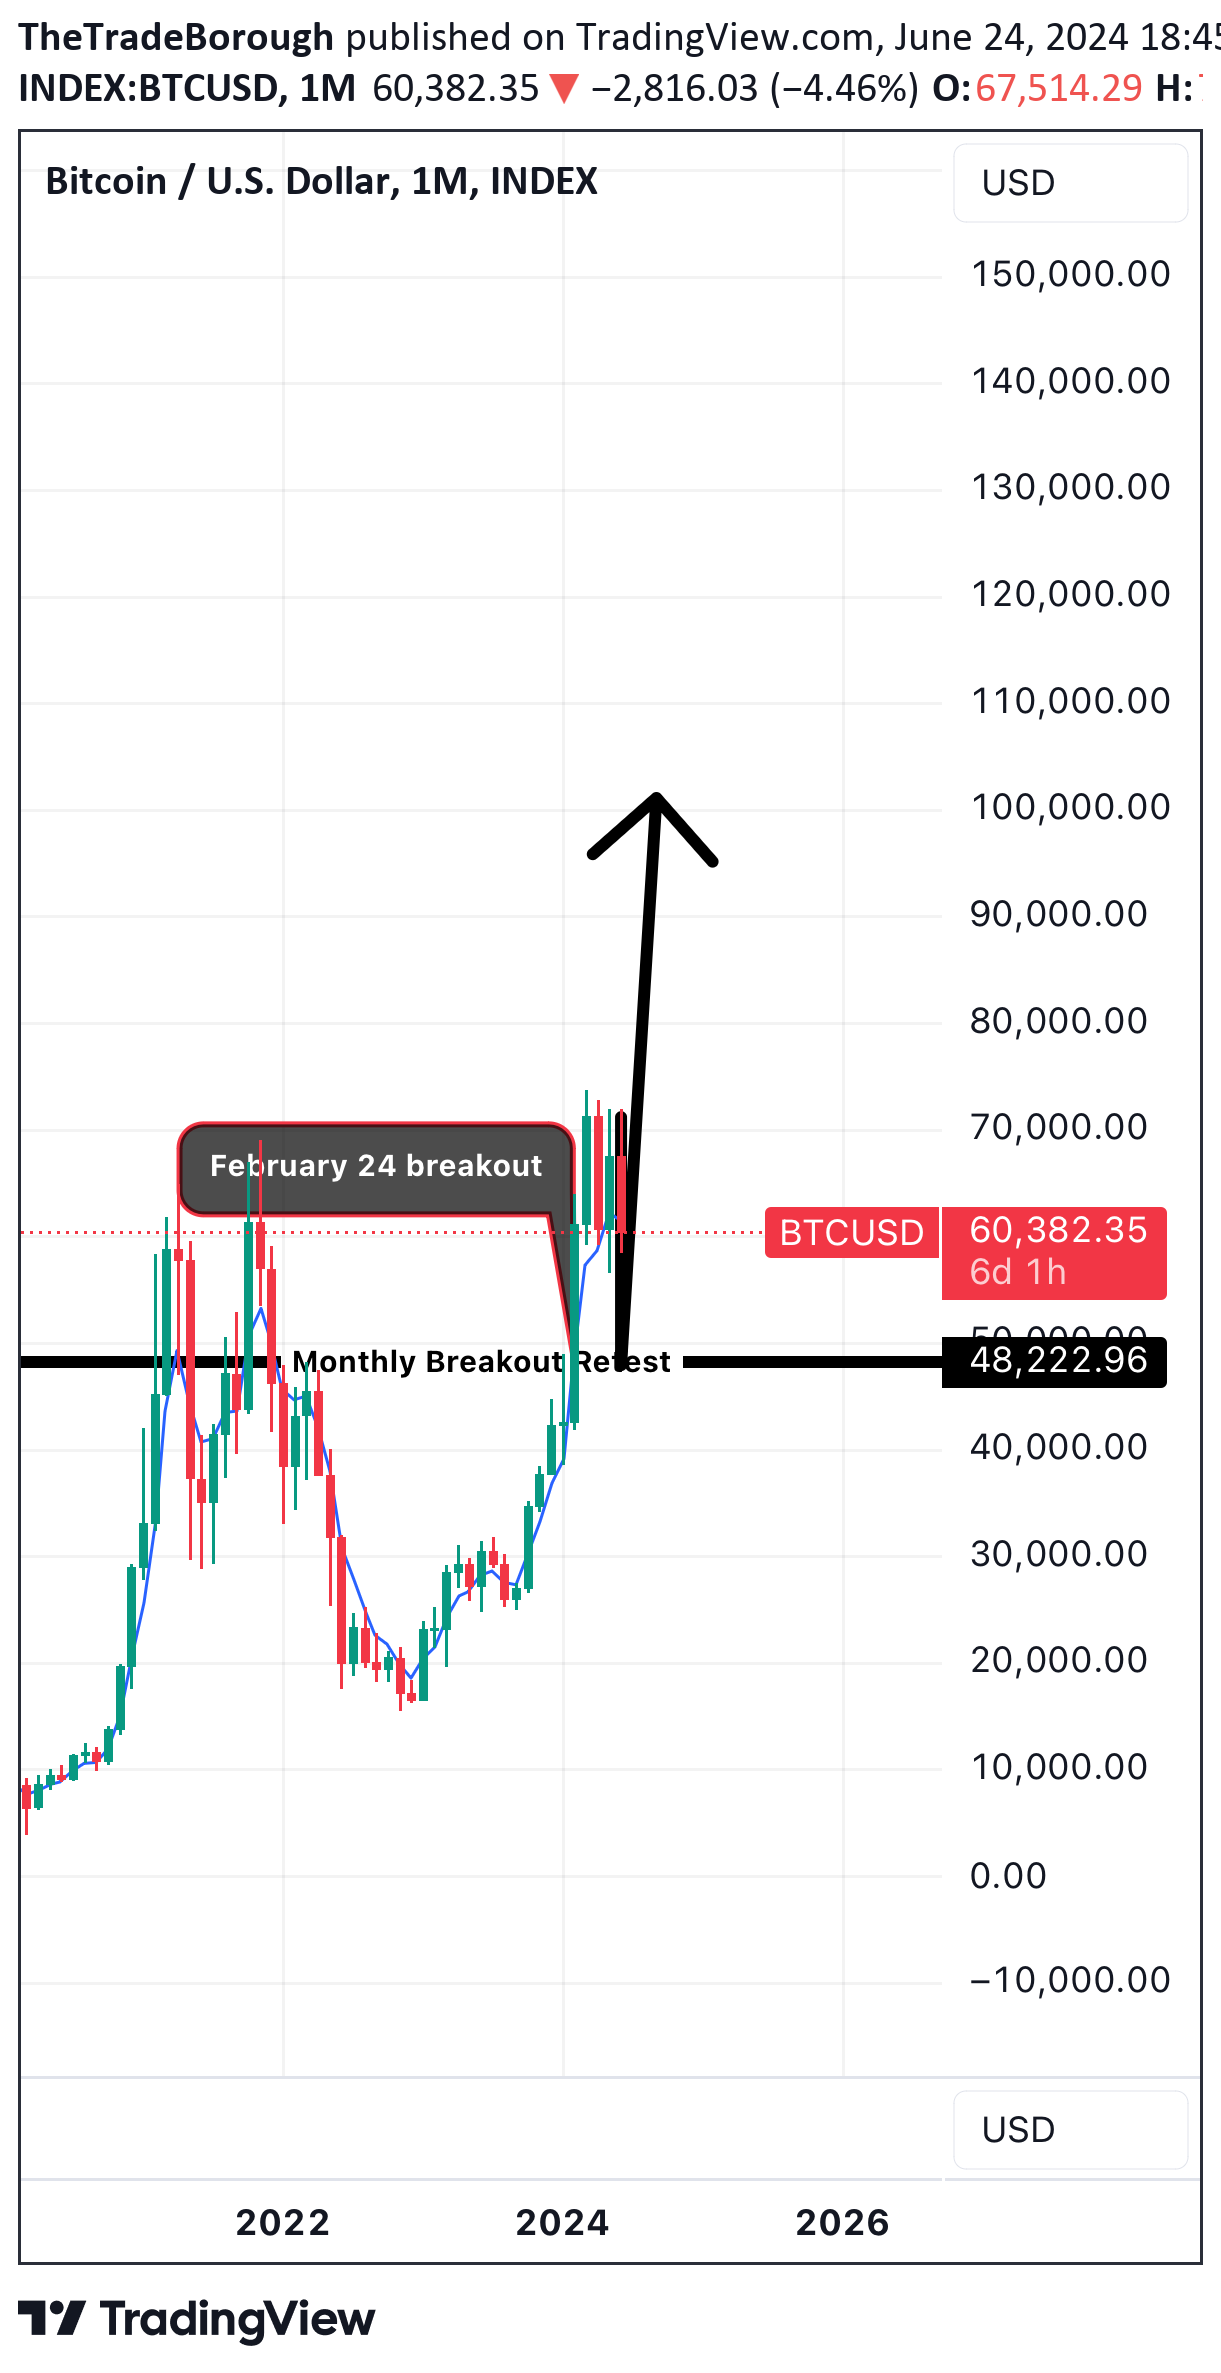
It appears that Bitcoin is setting up for a powerful, parabolic rally. We are anticipating a slide to the $50k support area, then a strong bullish run to $100k.The slide is in full effect. We expecting the $50k support area to be reached in the next few weeks.If we get a 4hr candle that closes completely underneath $59,333, Bitcoin is very likely to dump again to around $48,000We got the 4hr candle close underneath $59,333!Our long term bias has changed. We currently do not believe that Bitcoin will reach $100,000
Disclaimer
Any content and materials included in Sahmeto's website and official communication channels are a compilation of personal opinions and analyses and are not binding. They do not constitute any recommendation for buying, selling, entering or exiting the stock market and cryptocurrency market. Also, all news and analyses included in the website and channels are merely republished information from official and unofficial domestic and foreign sources, and it is obvious that users of the said content are responsible for following up and ensuring the authenticity and accuracy of the materials. Therefore, while disclaiming responsibility, it is declared that the responsibility for any decision-making, action, and potential profit and loss in the capital market and cryptocurrency market lies with the trader.