
TV288
@t_TV288

What symbols does the trader recommend buying?
Purchase History
پیام های تریدر
Filter
TV288
ETH - Double-bottom or lower low? What's next
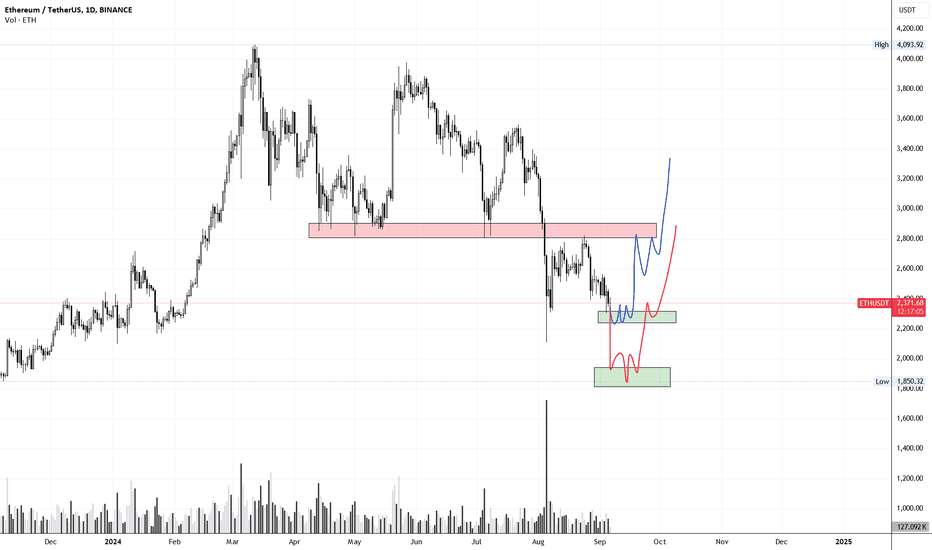
So, in hindsight it is obvious that the 2.8k level acted as a strong resistance and can be seen as a bearish retest of the breakdown we had on the 4th of august. I must admit that I leaned towards a break above with ETH going for a lower high around 3k, but it is what is is. Now ETH is back at the lows of abovementioned breakdown around ~2300$, so there is a slim chance of a double-bottom being formed, usually a very strong pattern, although I must say I'm not fully convinced about it playing out. Reason being the long wick we had into low 2k's and the overall weakness of the market. So there is also a chance of a bearish scenario, which would be an aggressive drop below 2k coming days, might even go as low as 1800 but that's REALLY just guessing at this moment. Right now I would say it's 50/50. IF this double-bottom is real, ETH should hold ~2300$ coming days. Usually the longer it takes for a move it goes the other way. So think if ETH can hold here for another 5-8 days chances increase greatly. Unfortunately it all depends on the stock market and of course BTC right now. So if the stock market sees a correction later this day, ETH might lose current levels and probably drops below 2k coming days/next week. Obvious key level to the upside would be 2.8k. If you want to be safe you should wait for a clean break above and long on retest. Bit more aggressive approach would be longing current levels with a tight stop. Ideally you should not use any stops at all IMO. If you trade spot I believe these are decent levels to start buying as you should not worry about a 15-20% correction anyway. See it as a discount if it happens haha. Stay safe!For reference look at the price action between 10-17 of may, when ETH was trading at the lows of the range and held the ~2.8k level for a week. This is what I mean with "usually if it's taking too long for a move it goes the other way" but surely this is a different scenario here.
TV288
SOL - 100$ or 80$, what is next?
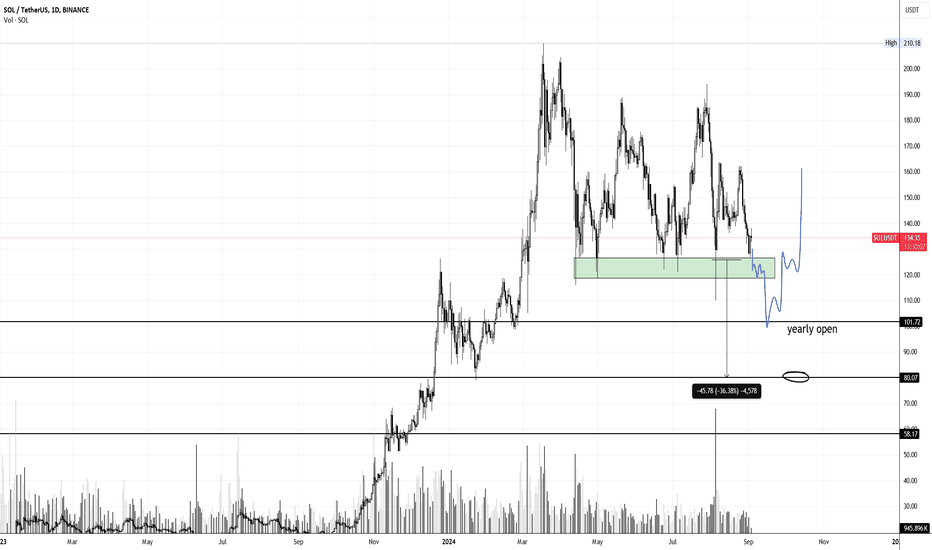
SOL has been defending this huge support around ~120$ for several months now but I'm afraid we are going to see a drop below this area very soon. The price action of the last few weeks clearly have the characteristics of a SHS pattern, with the head located around 184-190$. So this would give us a target of ~80$ but really not sure if it's going to drop that low. However, pretty sure we are going to see at least 100$ getting tested, there is just too much liquidity resting below 120$ (triggered stops and liquidations that is), so it could drop to 100$ and see a quick recovery above 120$. From there I won't dare to predict what could happen next. So, if we see SOL approaching the green zone again and not see a big bounce but rather see momentum slowing down, it's just a matter of time until it's going to drop IMO. Timing this can be difficult, especially if you want to short this (which I would NOT recommend). Better play would be to wait for a long entry around 100$ on low leverage and build your position throughout a possible bottom formation and add on a clean break and retest of 120$. Stay safe!So far it's following my idea. Dropped to 120$ followed by a weak bounce. Now, if SOL stays below ~127$ over the next few days we should see another, probably much larger drop. As I said, 100$ is likely but could go as low as 80$.Bounced a bit higher than expected, but if you are a bear, this is where you short. Risk/Reward still is in favor for bears, think a strong push above 140-142 would confirm a bear trap.
TV288
New BTC analysis - Lower highs and lower lows, what is next?
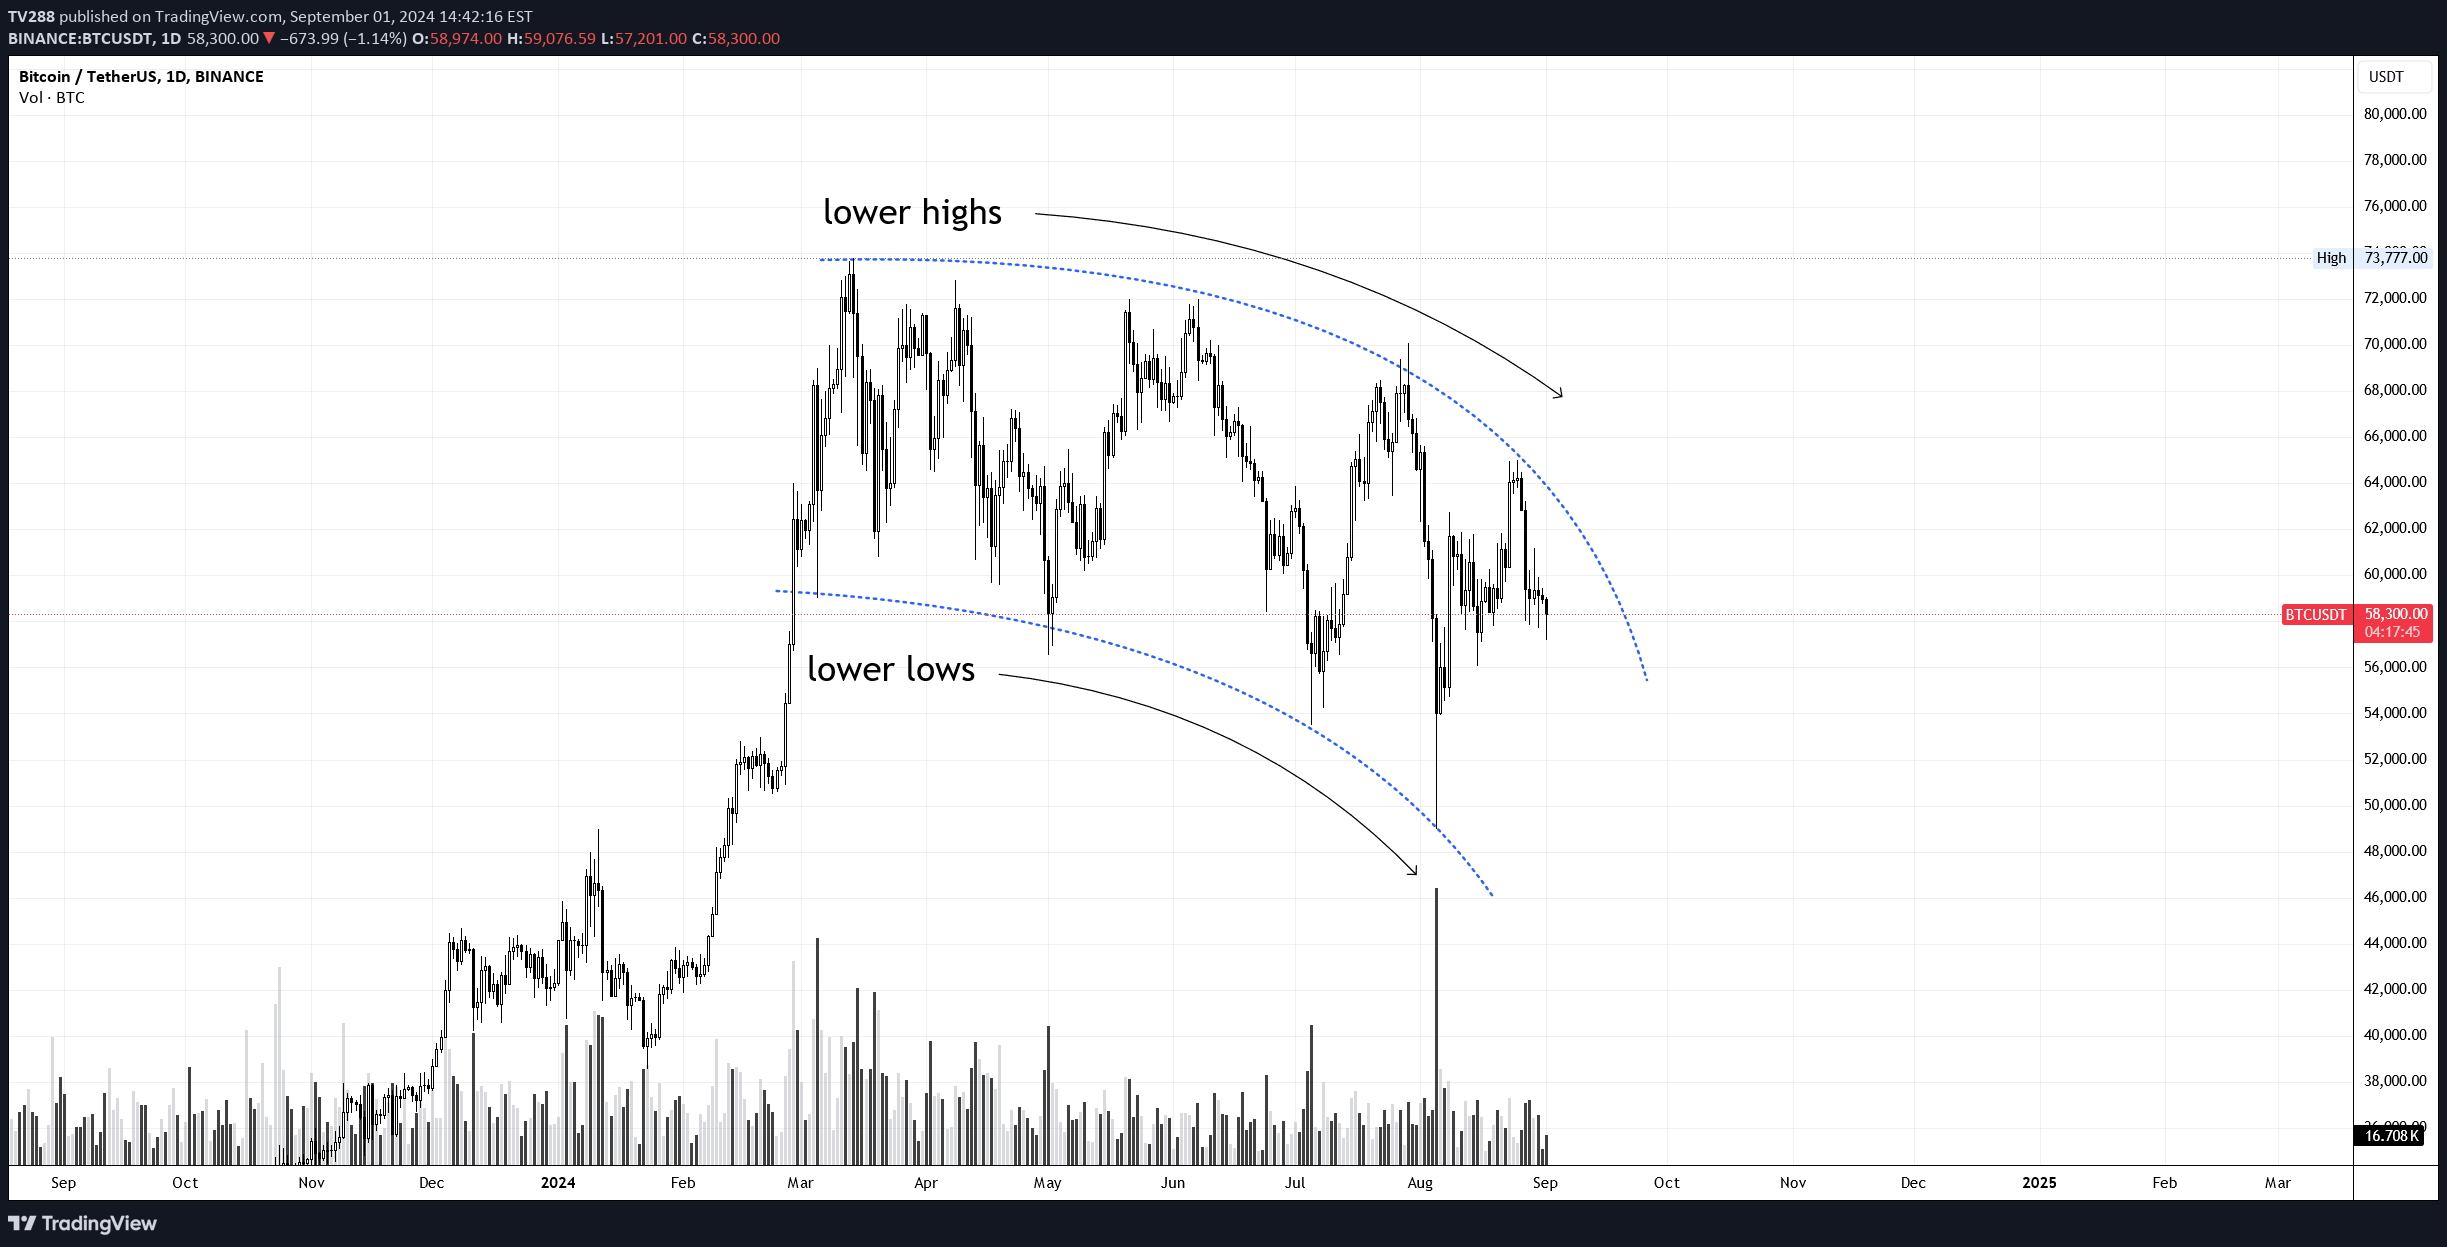
So, bulls recently missed a decent chance to gain control over the market by holding the 61k level but failed miserably. Now just want to put things into perspective, keep in mind, this analysis is NOT backed by usual TA rules, so this is rather a out-of-the-box approach on what is going on. As you can see I tried to highlight the obvious series of lower highs and lower lows on the daily chart. The lines are curved which is by no means the standard approach but it makes sense looking at the overall market structure. So one could assume we are in a mid-term downtrend, given BTC has been trading like this for the last 6 months already. One thing is certain: This structure is going to end at some point. The question now is, what are we going to see first: A lower low or a higher high to finally break out of this downtrend? Few days ago I was convinced we are going to see a push towards ~68k but now things have changed drastically. I wouldn't even say it's 50/50 as I'm slowly starting to lose hope but to give you some levels I think we need to see a strong break of 65-66k to become bullish again. However, if BTC decides to go for another lower low it might go as low as 46k, probably shaking out >80% of leveraged traders. Unfortunately this is how the market works and always has. Forcing people out of their positions by liquidating them, run their stops and the like. Another problem is, we have seen several agressive shakeouts past few weeks, so who is actually left to shook out? You'd be surprised how overleveraged this whole market is, so there is still room for another aggressive flush, probably 15-20% within a day. IF this happens, we REALLY want to see a quick recovery and not print a bearish flag below ~50k for another 2-3 weeks. As you can tell, I am leaning towards the lower low scenario but there is still a chance to prevent this from happening but the chances are slim, maybe 30%, but that's just a vague guess. So basically, if you are a trader you should sit on your hands at this point. Alts are down brutally as we speak, so if you miss let's say 20-30% from the bottom that's totally acceptable. For BTC if you are a bull either wait for the lower low or wait for a CLEAR break of current market structure. Keep in mind there are technically no limits to the upside, so no need to time the exact bottom, which is pretty much gambling anyway. Will update if we have a clearer picture. I know this analysis is pretty vague but I'm not trying to create any false hopes for the clout. In the end, always do your own research and/or stay out of the market if there's uncertainty like now. Stay safe!Think it's happening already. If 56k gets taken out it could could become really nasty. I didn't mention a possible target for this dump but it gould go as low as 45-46k.So, looks like we get our first daily close below 56k, still some hours left, but not looking good at all. There is a SLIGHT chance that 54k could hold, but doubt it. It's almost weekend though so it might not drop below 50k straight away. However, if we see a weekly close below 54k would be a matter of time until we see 46-48kLooks like it wants to go lower. Much lower probably. So my gut-feeling seeing another lower low seemed to be right. Beforementioned levels are still valid, so 46k is on the cards now.
TV288
New ETH analysis - Back to bull market?
It looks like ETH is making an attempt to push towards ~3k coming days/next week. Alts are performing pretty decent as well, which is what you want to see for bullish continuation - An overall strong market, not just BTC, so I'm giving this a high chance. As I said in my BTC analyis, 61k is the level to hold for BTC for the next 2-3 days, for ETH this level would be ~2.7k. Key level for ETH is around 3.2k (monthy open), if we see this month close above this level, it's a matter of time until we see ETH picking up momentum again heading into september. 3.6k should be a tough nut to break and we could see a higher low around ~3k before going up much higher. So ideally you want to see ETH forming higher lows from now on but once it gets back above 2.8k this would aready be my invalidation level (on a daily close that is). Still believe ETH is primed for 5-6k+ this year but it will likely be the last leg of this bull market. Don't dare to predict when it's going to happen, but it will surely take another 2-3 months. So as a trader you basically just let your positions ride at this point. Any entry below 2.8k is quite decent, so don't worry if you didn't catch the bottom of the flush we saw few weeks ago. Stay safe!For reference look at the move that happened on the 20th of may, if it's super bullish we could see something like that again :)Started buying here. Really a must hold level for me. Overall market looks good, healthy correction.Quite the dip, unexected. I'm underwater but added to my position at ~2600 and below. 2560$ REALLY should hold, don't want to see a daily close below.What's really absurd is, that this dip only happened for ETH. Everything else more or less held ground. Trading ETH became extremely frustrating after the switch to POS (2.0) in my opinion, not sure it that's the reason, but ETH is kind of missing lots of it's glory we have seen 2016-2018.Hm, bulls really miss out on a chance here, risk/reward is definitely in their favor but it seems no one wants to step in.What a mess. Back in the range. Just got to love this market, does whater it wants anyway. So we probably continue to chop between 2400-2700 for the next days. Think we wont see a move until sepetember.
TV288
BTC about to break out? - 64/65k next?
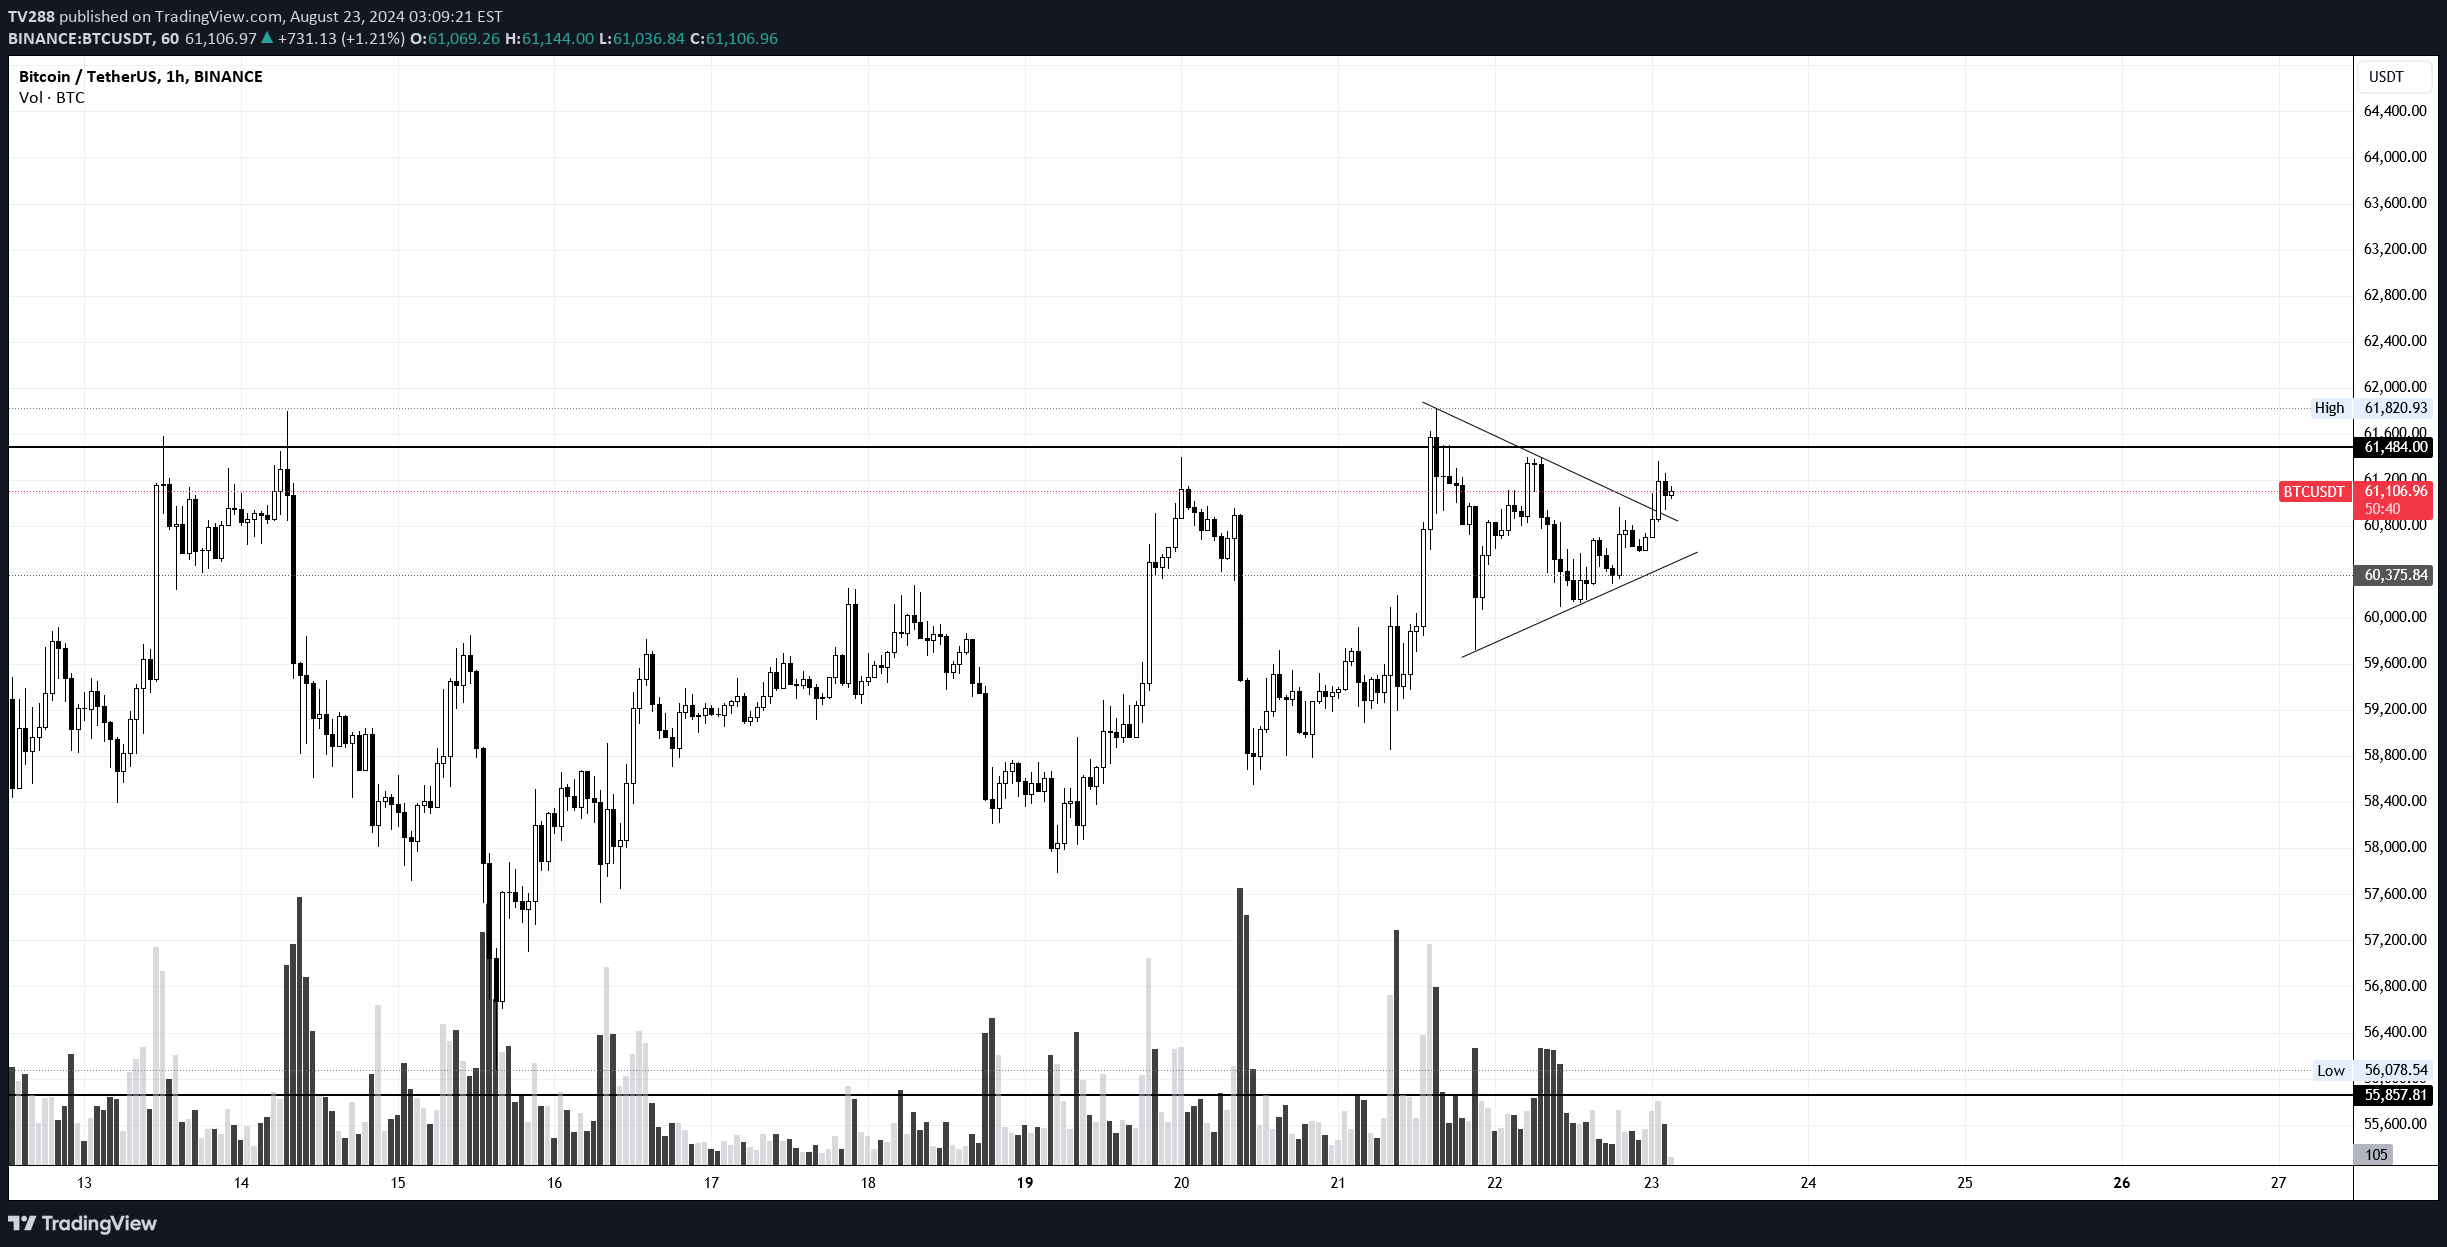
So BTC has been chopping between 58-61.5k for almost two weeks now, which is frustrating but part of the game. Right now it seems to be flirting with a breakout, printing a traingle shape just below resistance as we speak. Now the problem with these triangles is, that they are not the most reliable patterns, more like 50/50 to be honest, so I would only be convinced if BTC pushed straight to 65k from here. If it goes slow and hesitates around 64k it might drop back below 60k again to continue the chop for god knows how long... Plus it's almost weekend, so high chance of stop hunts and fake moves nonetheless but still, it's a chance for the bulls to show some strength again. IF it pushes to 65k later, it must hold ~61k throughout the weekend for continuation next week. Fingers crossed.For reference: Looks at what happened on 17th may, this would be an ideal scenario :)And there it is :) Bit less of what I was expecting, but still, this triangle seemed to be real. Now as I said, not out of the woods yet. Needs to hold 61-61.5k coming days for continuation. 64k is a huge resistance, so not an easy task for the bulls whatsoever.Held pretty good over the weekend, best case it holds 62.8k but could go as low as 61.8. Really don't want to see a drop back below 61k.Weekend looked good but now it's already shitting the bed. It's not over yet by any means, bulls could still turn this into their favor but it has to be soon. This is not looking like a bull flag anymore. It did from friday to sunday but it failed to break out and is bleeding ever since. Think if we see a daily close below 61k my view is probably wrong and we simply continue to chop for another week or so.Aaand it shit the bed again :) Now 62-63k acts as resistance and 56k as lowest support. So basically no-trading-zone aka. no-mans-land. Will update when we have a clearer picture.
TV288
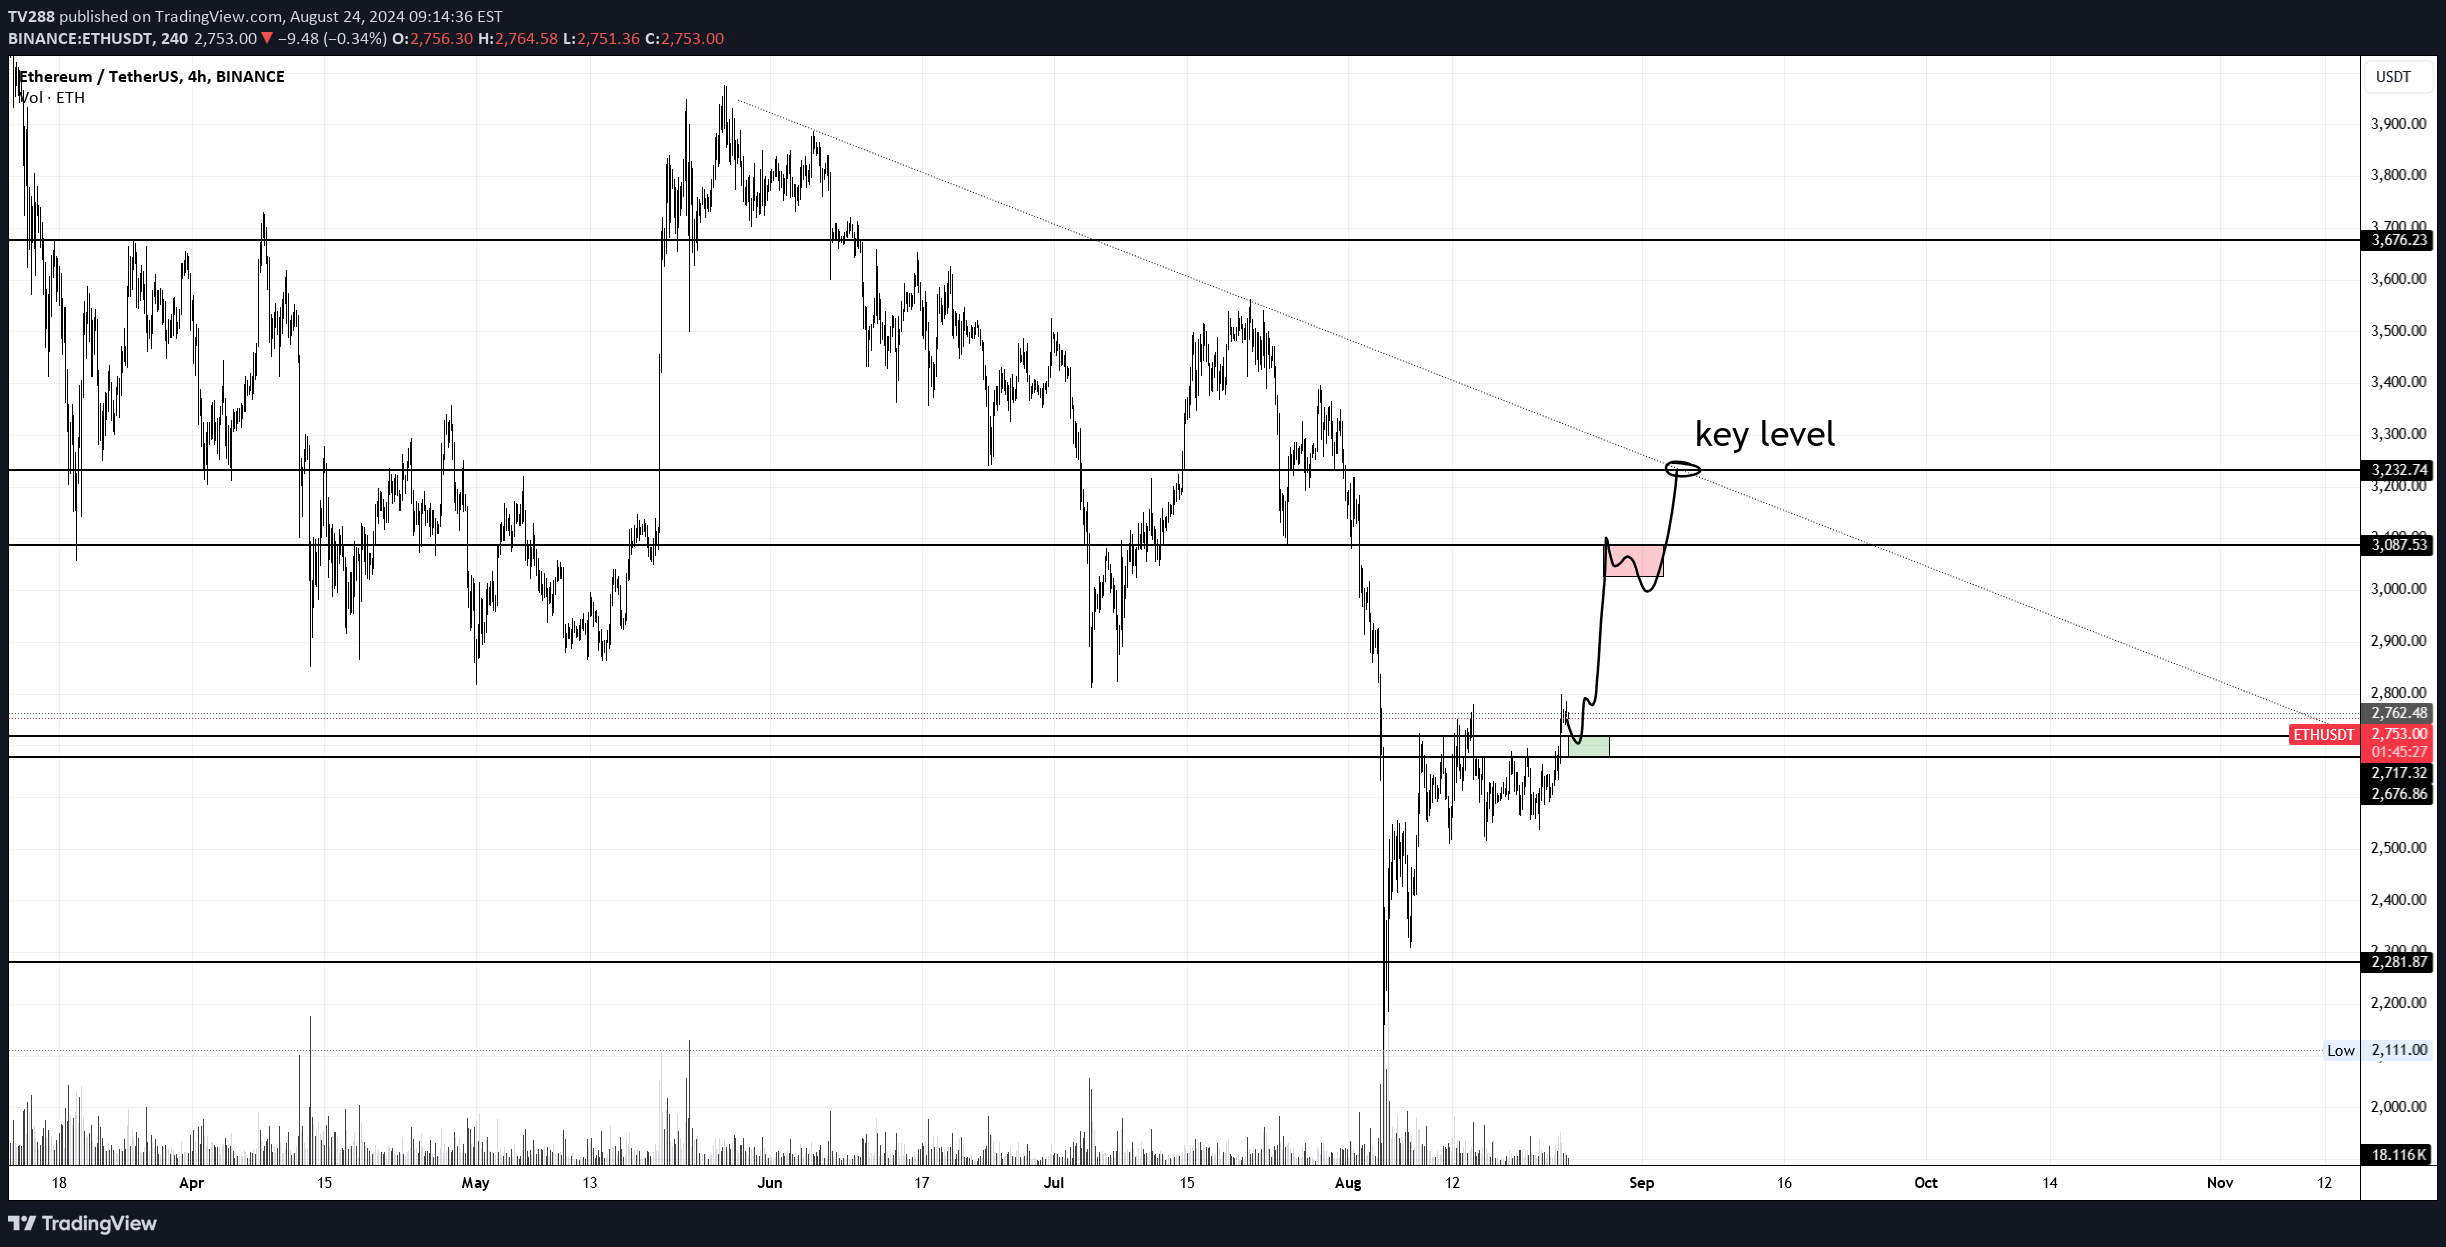
Quick update on ETH - Bear flag?
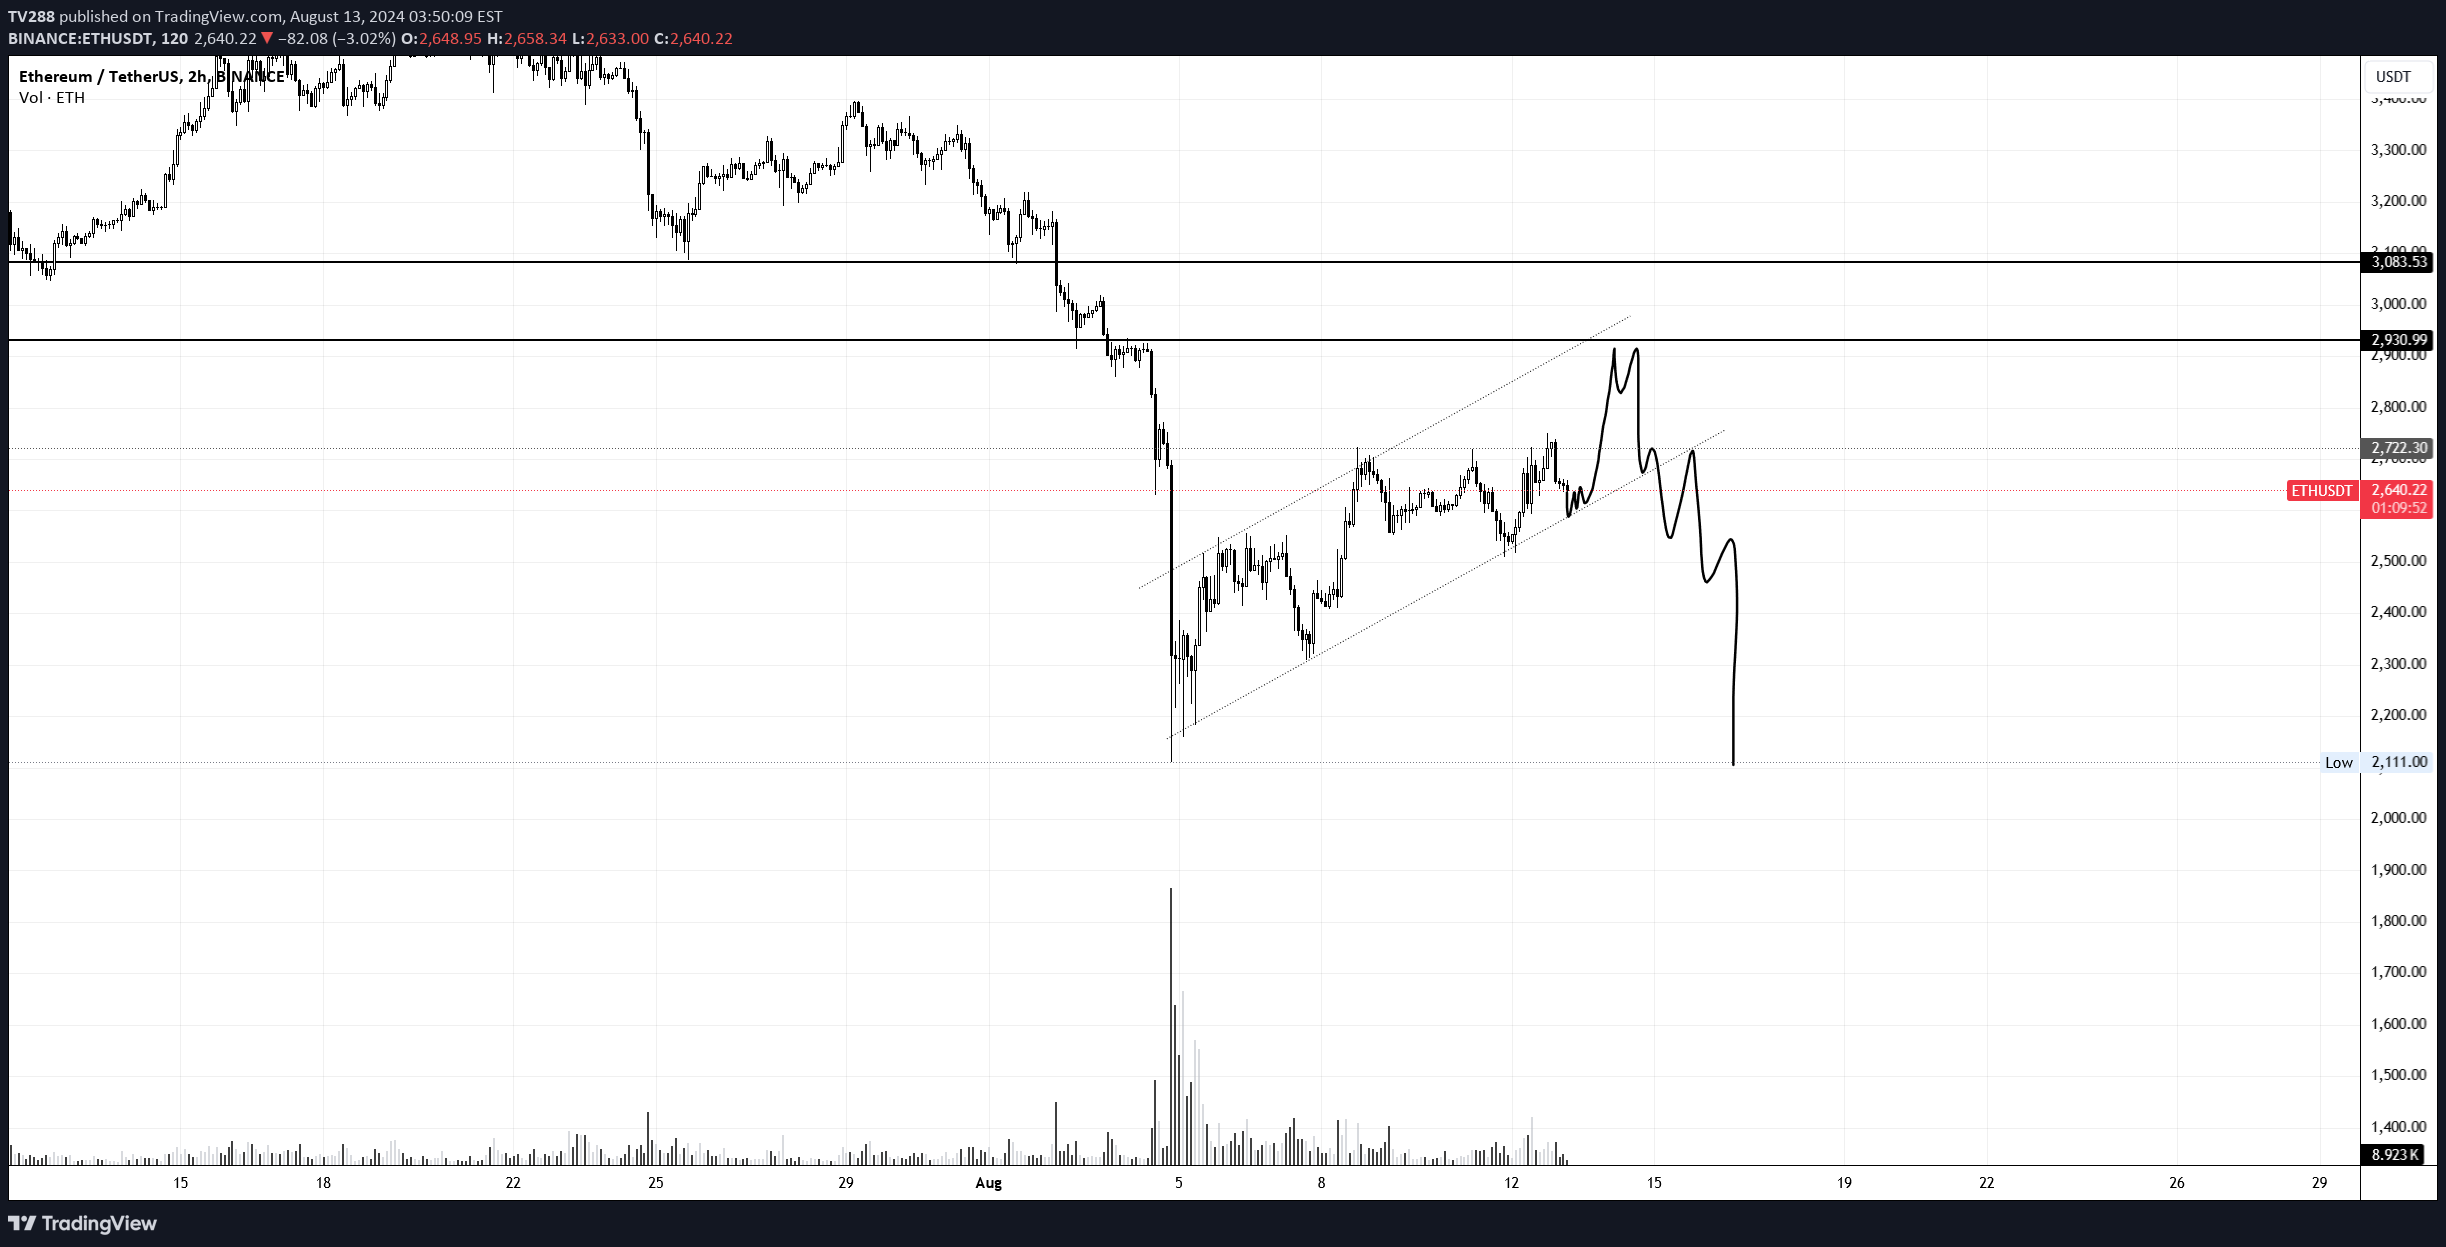
As I mentioned in my previous update, it looks like ETH is trading in a bear flag. It looked somewhat decent after the bounce from 2.5k yesterday but now it's stalling and moving slow, which is typical for a bear flag. Still think we will see one more push towards 3k later this week but it could also drop down from here. Anyway, assuming we are in a bear flag one should wait for either of these scenarios: - Break of the bear flag and wait for a bottom, which should be around 2.2k in this case - Wait for a final touch of upper resistance and go short You really don't want to trade the price action within a bear flag, as it's completely random - And you don't want to short the breakdown, as it just could move back inside for a stop hunt. So either trying to catch a bottom AFTER breakdown or wait for the upper bounds and go short, which should be around 3k. Stay safe!So, it broke below the support, but no dump yet. Overall market looks weak past 24h or so. Not sure, target of this bear flag would be around ~2.2k, so better wait if it gets there.Looks like we have a breakdown. Target of 2.2k still valid.Still nothing... just moving sideways. No-trade-zone for me.So, ETH broke down of that flag but no real dump/continuation and is already back above 2.7k which is not too bad. Will write a new ETH analysis as this could be the start of a much bigger move :)
TV288
Optimism - Long setup

I believe we will see another dip into ~1.3$ later this day/after weekly open. Obvious key level would be 2$ which would be our first target. Main target somewhere around 2.5-2.6 by end of august. Stay safe!Trade active :) Dropped into miy bids.Looking good so far. Now it should not drop below the weekly low anymore, moved up my stop already.Hm, had some momentum but is now hesitating to break 1.5ish. Moved my stops BE as this could take out the weekly low later. If so, ~1.2 would be the next support.Unfortunately it couldn't keep up with the momentum. Target of 1.2 is still valid.1.2 has held so far but momentung has died and it's just moving sideways like the rest of the market. Not interested until we see a move in either direction.Looks like Optimism wants higher :) Main target remains the same, should run into ~2.6$ coming weeks. 1.8$ would be the first big resistance.
TV288
TIA - Long trade idea

Clearly one of the strongest coins right now, already broke above monthly open. Caught a decent long from 4.6 but already close as I expect to see a retest of 5.1-5.2 (max 5$) later this day/after weekly open. I believe we will see TIA trading at 10$ very soon if it breaks above the key level around 7.6. Stay safe!The eagle has landed :) Dropped right into my buying zone. Fingers crossed.Perfect entry it seems :)Not that's a perfectly executed trade :)Looked pretty good but now it's weak and already dropped below the trendline again. Market looks weak overall, so not sure if my idea is still valid. Managed to take some profits and will set my stops to BE.And just like that TIa found some strength again. Pushed back above the trendline, if momentum continues next target should be around 7.2-7.3, going to take profits if we get there.And it shit the bed :) Out of position, at least made some profit, rest stopped out at BEDropped below the monthly again but 4.8 could have been the bottom already. Needs to break above 5.30 and hold for a day. Back in long again from ~5$, stop below 4.8Looking decent again with that daily close above the monthly open. 4.8$ would still be the invalidation but should not drop below 5$ anymore.
TV288
SEI - Long trade setup

Think we will see a dip into 0.25-26 later this day or after weekly open. Either way, I am ging to risk a long from these levels. TP1 somewhere around .34 but I believe it will go higher than that with .48 being my main target. Stay safe!Opened a partial long as it hasn't tagged my main entry yet.It didn't quite reach my main buying zone but I'm in full position nonetheless. Could see a stop hunt below current weekly low though.Closed at BE. Shitting the bed.Still moving sideways like the rest of the market. Not interested until we see some momentum again.Momentum picked up again and 2.2$ seems to be the bottom. Target remains the same.
TV288
My LAST attempt on Arbitrum

Now you may or may not know, that I've been trying to catch the bottom for Arbitrum for months now but it just kept making new lows over and over. But let me tell you, this time it's different (it's probably not)... Arbitrum dropped all the way to ~50 cent and I just can't think of anything besides some major news etc. that could make Arbitrum any lower than that... the weekly candle is already looking somewhat decent but it's the weekend ahead and still 2.5 days to got, so anything could happen. But if this is not the bottom, I really don't know. It could all just have been a cash grab and ARB is going to disappear forever. We have seen this many time, even with the promising projects. So, this will be the last time I'm buying ARB at current prices, target as shown in the chart. Fingers crossed.
Disclaimer
Any content and materials included in Sahmeto's website and official communication channels are a compilation of personal opinions and analyses and are not binding. They do not constitute any recommendation for buying, selling, entering or exiting the stock market and cryptocurrency market. Also, all news and analyses included in the website and channels are merely republished information from official and unofficial domestic and foreign sources, and it is obvious that users of the said content are responsible for following up and ensuring the authenticity and accuracy of the materials. Therefore, while disclaiming responsibility, it is declared that the responsibility for any decision-making, action, and potential profit and loss in the capital market and cryptocurrency market lies with the trader.