
TSFC
@t_TSFC

What symbols does the trader recommend buying?
Purchase History
پیام های تریدر
Filter
TSFC
Bitcoin's local perspective 17.03.2025

In Friday's analysis "How Trump's Policy Will Impact the Crypto Market", we presented a bearish model for the medium-term perspective👇 Today, our key focus is on the $78,300 level (the 4th point of our model), which serves as significant support. It's important to note the presence of an unfilled gap on CME at the $85,905 level ($85,943 in index terms)👇 We assess the probability of closing this gap in the near term as high – either from current positions or after retesting the $78,300 level. How will we act? If price moves toward $85,943 from current levels, we plan to partially close our #ETH position that was accumulated during the March 11 decline. In the scenario of a retest of $78,300, we will consider opening a long position on #BTC with a target of $85,943.
TSFC
Bitcoin - Med-Term Outlook

The current BTCUSDT chart is forming an EXP model (turquoise), indicating a potential correction before the next phase of active growth. Main Scenario The most likely development suggests a price retracement to the $80,845 – $77,890 range (purple zone), corresponding to unclosed gaps on CME. This range is positioned above the 100% level of the model ($75,949), making it an optimal area for the completion of the correction before the continuation of the upward movement. Two possible correction paths: 1️⃣ Decline from current levels – BTC gradually breaks local support, tests the 4th point of the model (~$91,341), and then moves towards the CME Gap area. 2️⃣ ATH breakout ($109,354) before a decline – A short-term rally is possible before a deep correction into the $80,000 – $77,000 range. After testing this zone, a reversal movement may form, with targets at the 1st point of the model ($109,354) and beyond. Final confirmation of the uptrend will depend on further market dynamics. Once this cycle is completed, a transition to the altcoin growth phase can be expected. Secondary Scenario Under favorable conditions, BTC may avoid a correction into the CME Gap zone and continue its upward movement without retesting support levels. However, in the current market structure, this scenario remains less probable. Alternative Scenario In the event of an extended correction, BTC could break the 100% model level ($75,949) and test the 200% level ($63,226). Such a development may occur due to external market shocks, leading to mass liquidations of margin positions. However, even in this case, a rapid price recovery is expected.Everything's going according to plan 👇Done👌That was a great analysis👌
TSFC
New bitcoin pattern on 1W

Usually on Monday we publish analytics with a local perspective, but this time we have not enough information for a full-quality forecast. Nevertheless, this week is notable for the fact that a new EXP pattern has formed on BTCUSD on the weekly timeframe. It is notable that we have an earlier pattern from May 21👇 And the new pattern is essentially the "big brother" of the smaller pattern and gives us more distant target levels (as is often the case with higher-level patterns, most likely not all of them will be reached). The fact that the formation of this model occurred through the touch of the trend line increases the probability of a test of $73,757 and $77,723 (but only increases, the level of uncertainty is still high).How's that for estimated levels?
TSFC
Bitcoin's local perspective 14.10.24
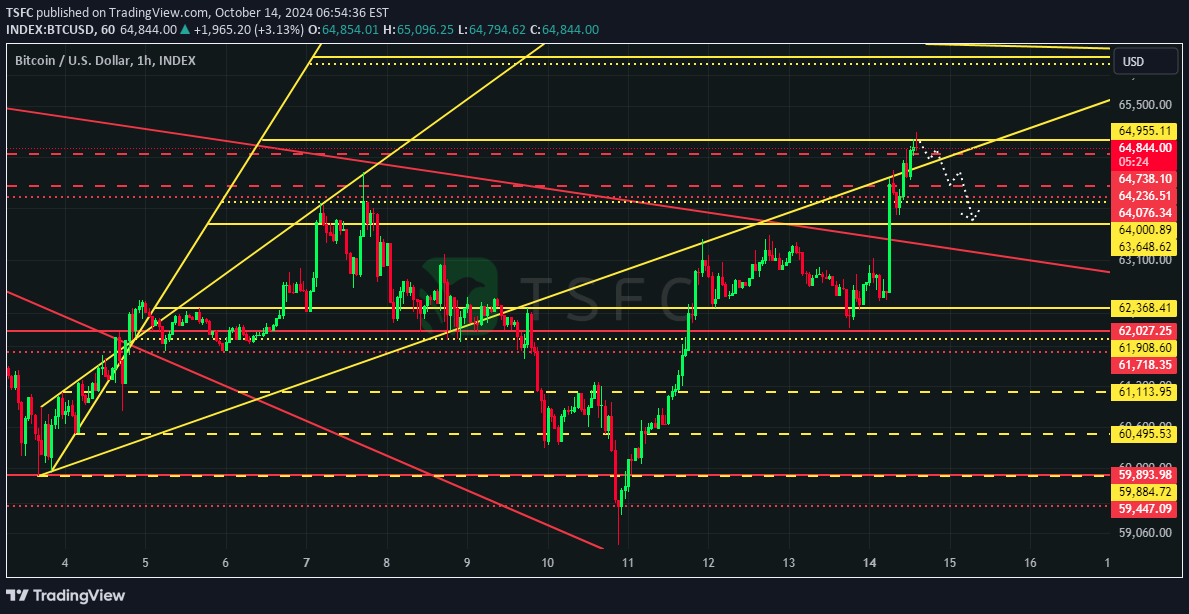
The old logic of the forecast from last Monday was achieved👇 After that, the price went under the mentioned trend line and continued its drop. Now there are no new swing models for BTCUSD , and within the existing ones there is a correction to the zone of $64,000-$63,648
TSFC
Bitcoin's local perspective 07.10.24

Now, BTCUSD has formed an ascending pattern AMEXP (yellow)👇 that describes a correction within the previous descending pattern AMEXP (red)👇 If now the price can break through the $64,076-$64,236 zone, we may see a continuation of growth with targets at $64,738 and $64,955, followed by a correction to the range around the $62,368 level. After that, we will have to watch the reaction to this zone and the trend line in more detail, as there is a possibility to go to $66,000, and there is a possibility to renew the swing low and say hello to $57,834 - so the area around the $62,368 level will be an important place for decision making.As we expected in our review on Monday, after breaking through the level of $64,000 the price corrected to the level of $62,368, where we are now🤔. The only thing is, of course, we thought that the price would stay a bit longer above $64,076 and try to test at least $64,738, but the movement was extremely fast ⚡️
TSFC
Bitcoin's local perspective 30.09.24

The nearest movement on BTC is now being described by the AMEXP model on the hourly timeframe, where we have two key target zones for the price: at least $62,027-$61,718 and if the impulse will be strong, it will be $59,893-$59,447. After reaching these zones, we can expect a rebound to at least ~$64,000 and as a variant of scenario - an attempt to update the high, but frankly, it is too early to talk about it. In the specified range of $62,027-$59,447 we will try to find a long with the aim to catch at least a rebound. Let's specify that the position will probably be a small size, as there are high risks of not stopping in the mentioned area.Our prediction that we gave on Monday was correct🚀Further evolution of the idea👇
TSFC
Bitcoin's local perspective 16.09.24

The current local trend, which started last week, is described by the EXP ascending pattern (orange) and as long as its trend is not broken, there are all chances to continue moving towards $61,700 and $64,186. At the same time, now we see the forming EXP pattern (turquoise), which is a corrective pattern to the previous one. If the price goes under the zone formed by the fourth points of the models - the zone around $58,100, we may see a decline under the level of $55,494, where we will try to catch a long on #BTC on the rebound. If the price is able to consolidate under the $55,494 level, the next target will be the levels of $53,472, $51,268 and $49,155.Target achieved👌
TSFC
Bitcoin's local perspective 09.09.24

Before looking at the local perspective, we would like to mention that globally we are now moving within two main patterns: AMEXP on ETHBTC dated July 29👇 And the pattern on BTCUSD , which we first recognized as MDB on the daily timeframe dated May 21 and later formed as EXP on the weekly timeframe and essentially describes the current trend 👇 Our expectations are now based on the fact that on ETHBTC we see a key magnetic level at 0.03492, which we will reach with a high probability (we have marked this block with a red square on the chart). We also note that CME also opened with a GEP at $52,980, and BTC1! has two nearest open GEPs: at $61,880 and $52,980👇 Locally, we now see three main scenarios: 1️⃣ BTCUSD reaches the $56,552 level, after which it continues to decline with a target of $48,973 2️⃣ BTCUSD does not reach the level of $56,552 and continues its decline with a target of $48,973. 3️⃣ BTCUSD reaches the level of $56,552 and continues to move towards $61,700. Now you have an open long on BTCUSD and over the weekend we opened a hedging short on ETHUSD for a portion of the BTCUSD position, and now in the case of each scenario: 1️⃣ BTCUSD close half on the first target around $56,552 and put the stop to breakeven, then on the downside close the profitable hedge short 2️⃣ Around $48,973 close the hedge-short on ETHUSD on the fall and buy more BTCUSD 3️⃣ Close BTCUSD position on all targets, part of the profit is taken by a losing hedge-short on $INDEX:ETHUSD. Thus, in the current market situation we have formed such a construction, which will allow us to earn in most of our expected scenarios
TSFC
Bitcoin's local perspective 26.08.24

Overall, nothing is happening globally, we have been trading within the MDB of May 21 and we continue to do so - the market has been particularly boring for the last two weeks😐 As for the local outlook, either through liquidity removal around the $65,300 level, or immediately - it makes sense to expect #BTC to drop to the $62,581 and $61,646 levels, where we will try to gain a small position on the rebound.Targets on BTC from the local review of August 26 have been achieved - the price reached both the level of 62,581 and $61,646 (the level of 200% of the blue model). As we planned on Monday, we gained a small position in this range. We will look at the targets as we move - there is a very high level of determination. In case the price goes down and the position is taken out by the stop, we will look for a new entry point, but with a more significant amount.
TSFC
Bitcoin's local perspective

At the moment, the BTCUSD price has come to the support of $54 821.76 (the HP level of the turquoise model). If the price goes under this level, the next two zones where we can expect the price to be would be $52 612-$51 858 and $49 394-$49 247. To continue the growth at least to the area of $59 900-$60 143 the price needs to go beyond the turquoise pattern by breaking the trend line, which looks more unlikely at the moment.
Disclaimer
Any content and materials included in Sahmeto's website and official communication channels are a compilation of personal opinions and analyses and are not binding. They do not constitute any recommendation for buying, selling, entering or exiting the stock market and cryptocurrency market. Also, all news and analyses included in the website and channels are merely republished information from official and unofficial domestic and foreign sources, and it is obvious that users of the said content are responsible for following up and ensuring the authenticity and accuracy of the materials. Therefore, while disclaiming responsibility, it is declared that the responsibility for any decision-making, action, and potential profit and loss in the capital market and cryptocurrency market lies with the trader.