
TRADE_WITH_BRIAN
@t_TRADE_WITH_BRIAN

What symbols does the trader recommend buying?
Purchase History
پیام های تریدر
Filter
تحلیل تکنیکال SPX: هشدار فروش در منطقه مقاومت کلیدی پس از شکست ساختار!
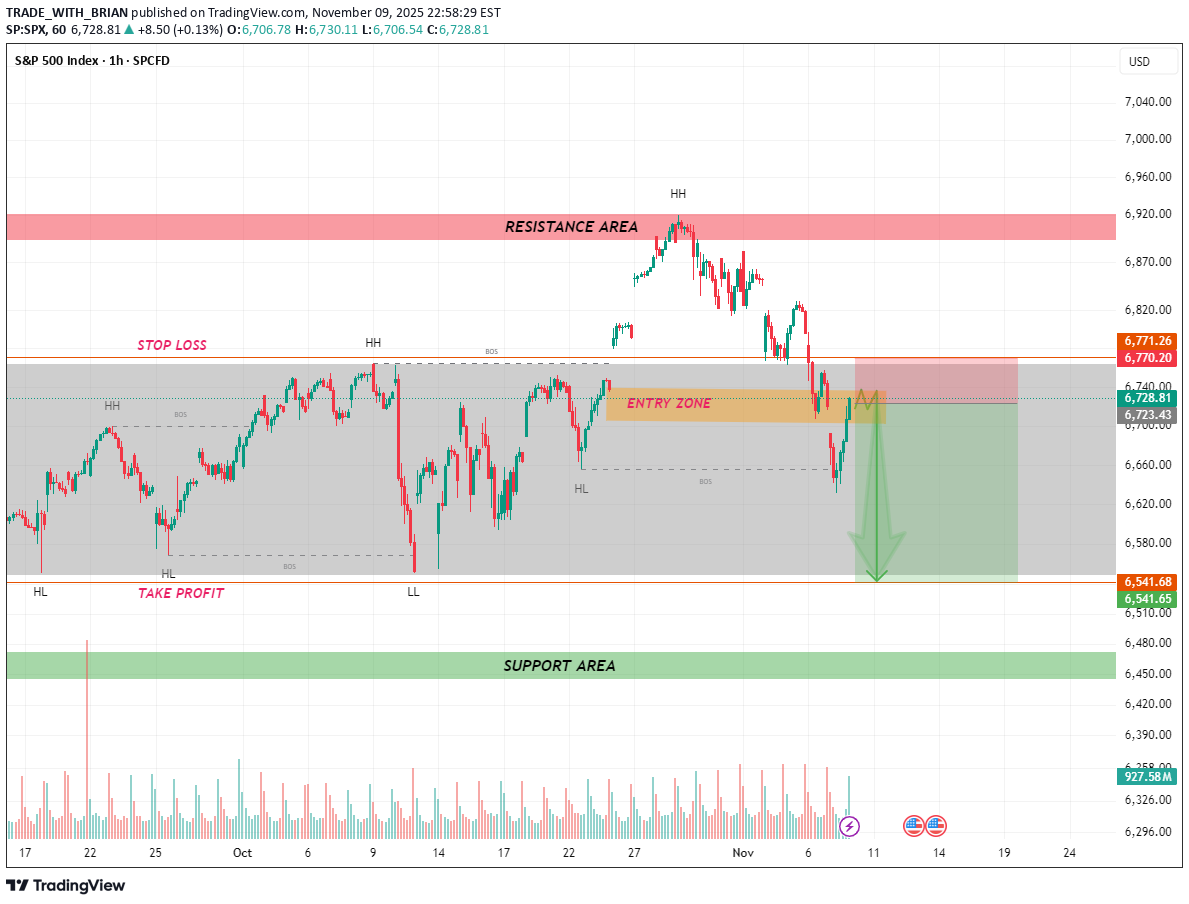
Technical Analysis Of US 500 The S&P 500 Index (SPX) is currently presenting a high-probability bearish setup following a clean Break of Structure (BOS) on the 1H timeframe. After establishing a series of Higher Highs (HH) and Higher Lows (HL), price action shifted momentum by printing a Lower Low (LL) — signal a potential trend reversal from bullish to bearish structure. Currently, SPX is retracing back into a Premium Price Zone — an area of previous support turned resistance, marked as the Entry Zone on the chart. This zone aligns perfectly with key structural confluences and offers traders an ideal area to look for short entries upon confirmation. Technical Breakdown: 📊 Market Structure: Previous bullish leg invalidated by a new Lower Low (LL) formation. A clear Break of Structure (BOS) confirms bearish intent. Price is retesting the distribution zone between 6720 – 6750. 📉 Bearish Confluences: Structure shift from bullish → bearish. Retest of broken support now acting as resistance. Price approaching the premium zone (above equilibrium). Weak bullish momentum on the retracement leg. Trading Plan: 🟡 Entry Zone: 6720 – 6750 ❌ Stop Loss: Above 6770 (structure protection) ✅ Take Profit: Around 6540 (key liquidity & support zone) ⚖️ Risk–Reward: Approx. 1:3 setup 🧠 Bias: Bearish continuation unless price breaks and holds above 6770 Market Context: SPX has faced significant rejection from the upper resistance area, suggesting that sellers are stepping back in to drive the next impulsive leg down. As long as price remains below the 6770 zone, the bearish narrative remains valid. A clean rejection or bearish engulfing pattern within the entry zone would strengthen the short bias — targeting the next support area near 6540, where buyers could re-enter.
تحلیل تکنیکال طلا: آماده جهش بزرگ بعدی با ساختار صعودی قوی!
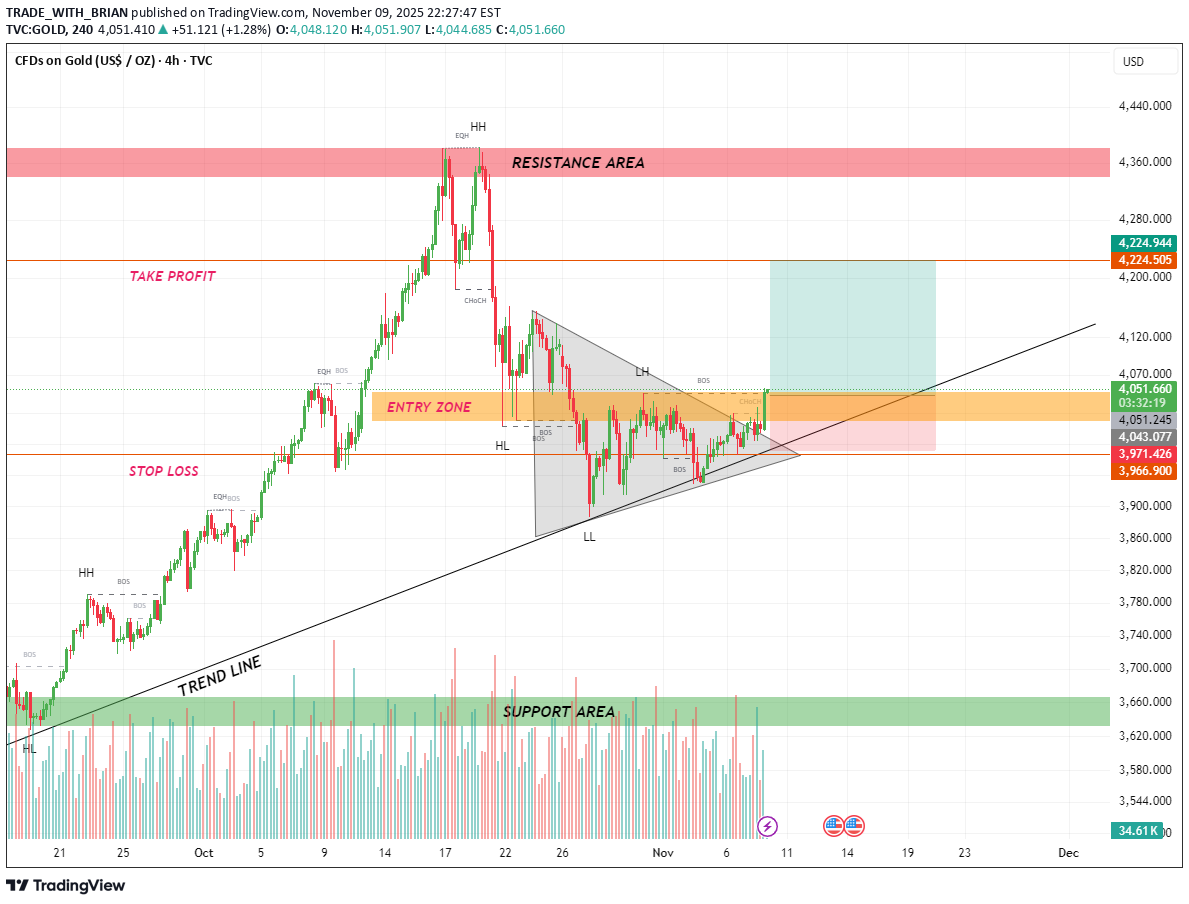
Technical Analysis Of XAUUSD Gold is showing strong momentum as price respects the ascending trendline and forms a new higher low (HL) within structure. The recent Break of Structure (BOS) signals a potential bullish continuation from the entry zone (3,970–4,040). As long as price holds above support, I’m targeting 4,225 → 4,725, with the next liquidity resting near the resistance zone (4,360+). Market structure remains clean and bullish — buyers still in full control! 💪 🟩 Entry: 3,970 – 4,040 🟥 Stop Loss: Below 3,965 🎯 Take Profit: 4,225 → 4,725 ⏱ Timeframe: 4H Summary: Gold remains technically bullish, showing structural strength and clean price action. Holding above trendline support keeps the upside scenario valid — watching for a confirmed break above 4,100 to accelerate toward higher liquidity levels. 💬 What’s your outlook on Gold? Do you think we’ll break above 4,300 soon or face resistance first? 👇 Drop your thoughts below, and don’t forget to Like 👍 if you found this analysis useful
بیت کوین در آستانه انفجار؟ فرصت خرید طلا در این ناحیه حیاتی!
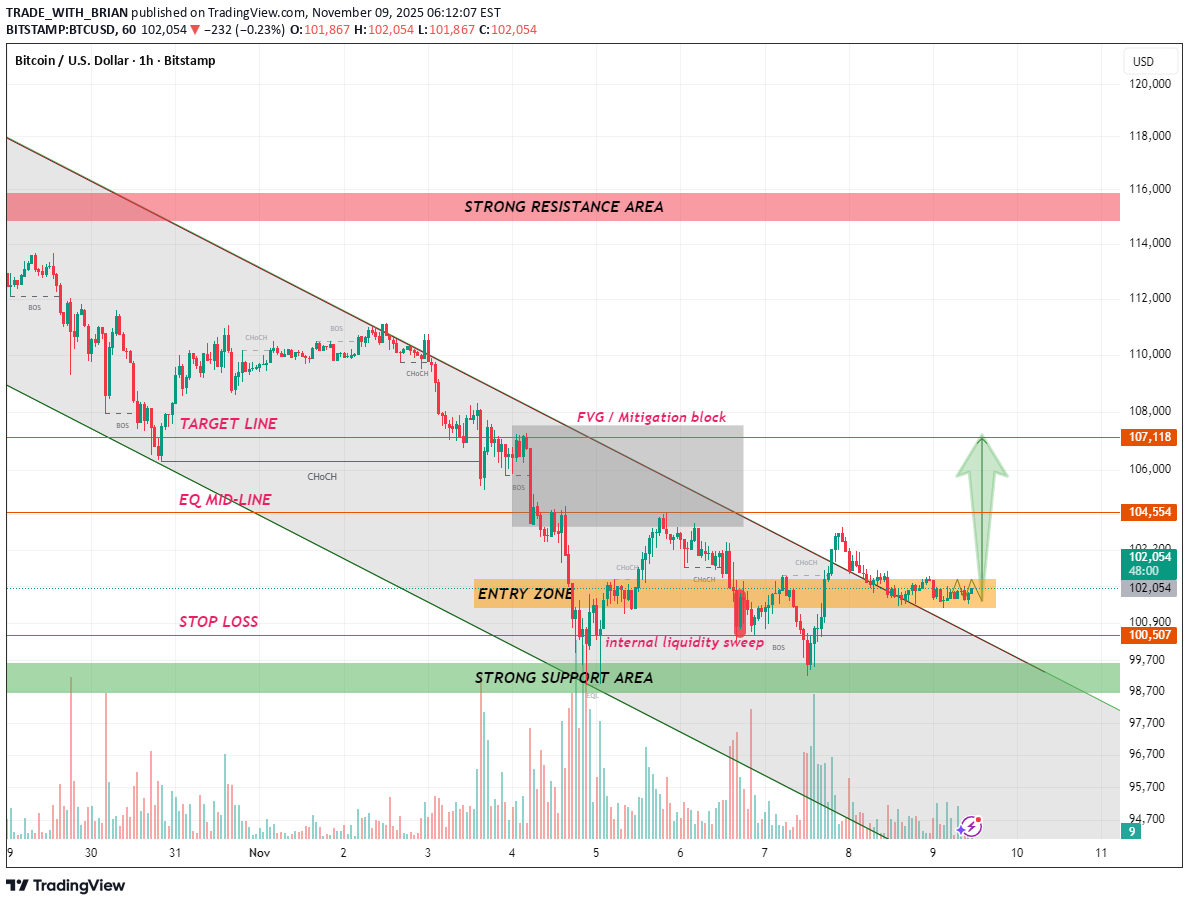
Technical Analysis Of BTCUSD After an extended bearish leg within the descending channel, Bitcoin is now showing early signs of exhaustion near the strong support area. The market recently executed an internal liquidity sweep below local lows, tapping into a high-volume entry zone — a classic sign of smart money accumulation. We can observe multiple CHOCH and BOS structures forming, suggesting that short-term order flow might be shifting bullish. As long as the 100,500 support holds, a potential push toward the FVG / Mitigation Block between 104,500–107,100 remains in play. If this structure continues to develop, we could see price targeting the upper EQ mid-line and potentially testing the strong resistance area around 116,000 in the coming sessions. 🟩 Entry Zone: 100,500 – 101,900 🟥 Stop Loss: Below 100,000 🎯 Targets: 104,554 → 107,118 📈 Bias: Bullish reversal from demand | FVG mitigation play ⏱ Timeframe: 1H Summary: BTC is in a potential reversal phase, with liquidity engineered below key lows and early bullish structure forming. A sustained break above 104,500 would confirm bullish momentum and open the path toward 107,000+. Support Me For More Insightful Analysis.
Disclaimer
Any content and materials included in Sahmeto's website and official communication channels are a compilation of personal opinions and analyses and are not binding. They do not constitute any recommendation for buying, selling, entering or exiting the stock market and cryptocurrency market. Also, all news and analyses included in the website and channels are merely republished information from official and unofficial domestic and foreign sources, and it is obvious that users of the said content are responsible for following up and ensuring the authenticity and accuracy of the materials. Therefore, while disclaiming responsibility, it is declared that the responsibility for any decision-making, action, and potential profit and loss in the capital market and cryptocurrency market lies with the trader.