
TPS_ACADEMY_EDUCATOR
@t_TPS_ACADEMY_EDUCATOR

What symbols does the trader recommend buying?
Purchase History
پیام های تریدر
Filter
TPS_ACADEMY_EDUCATOR
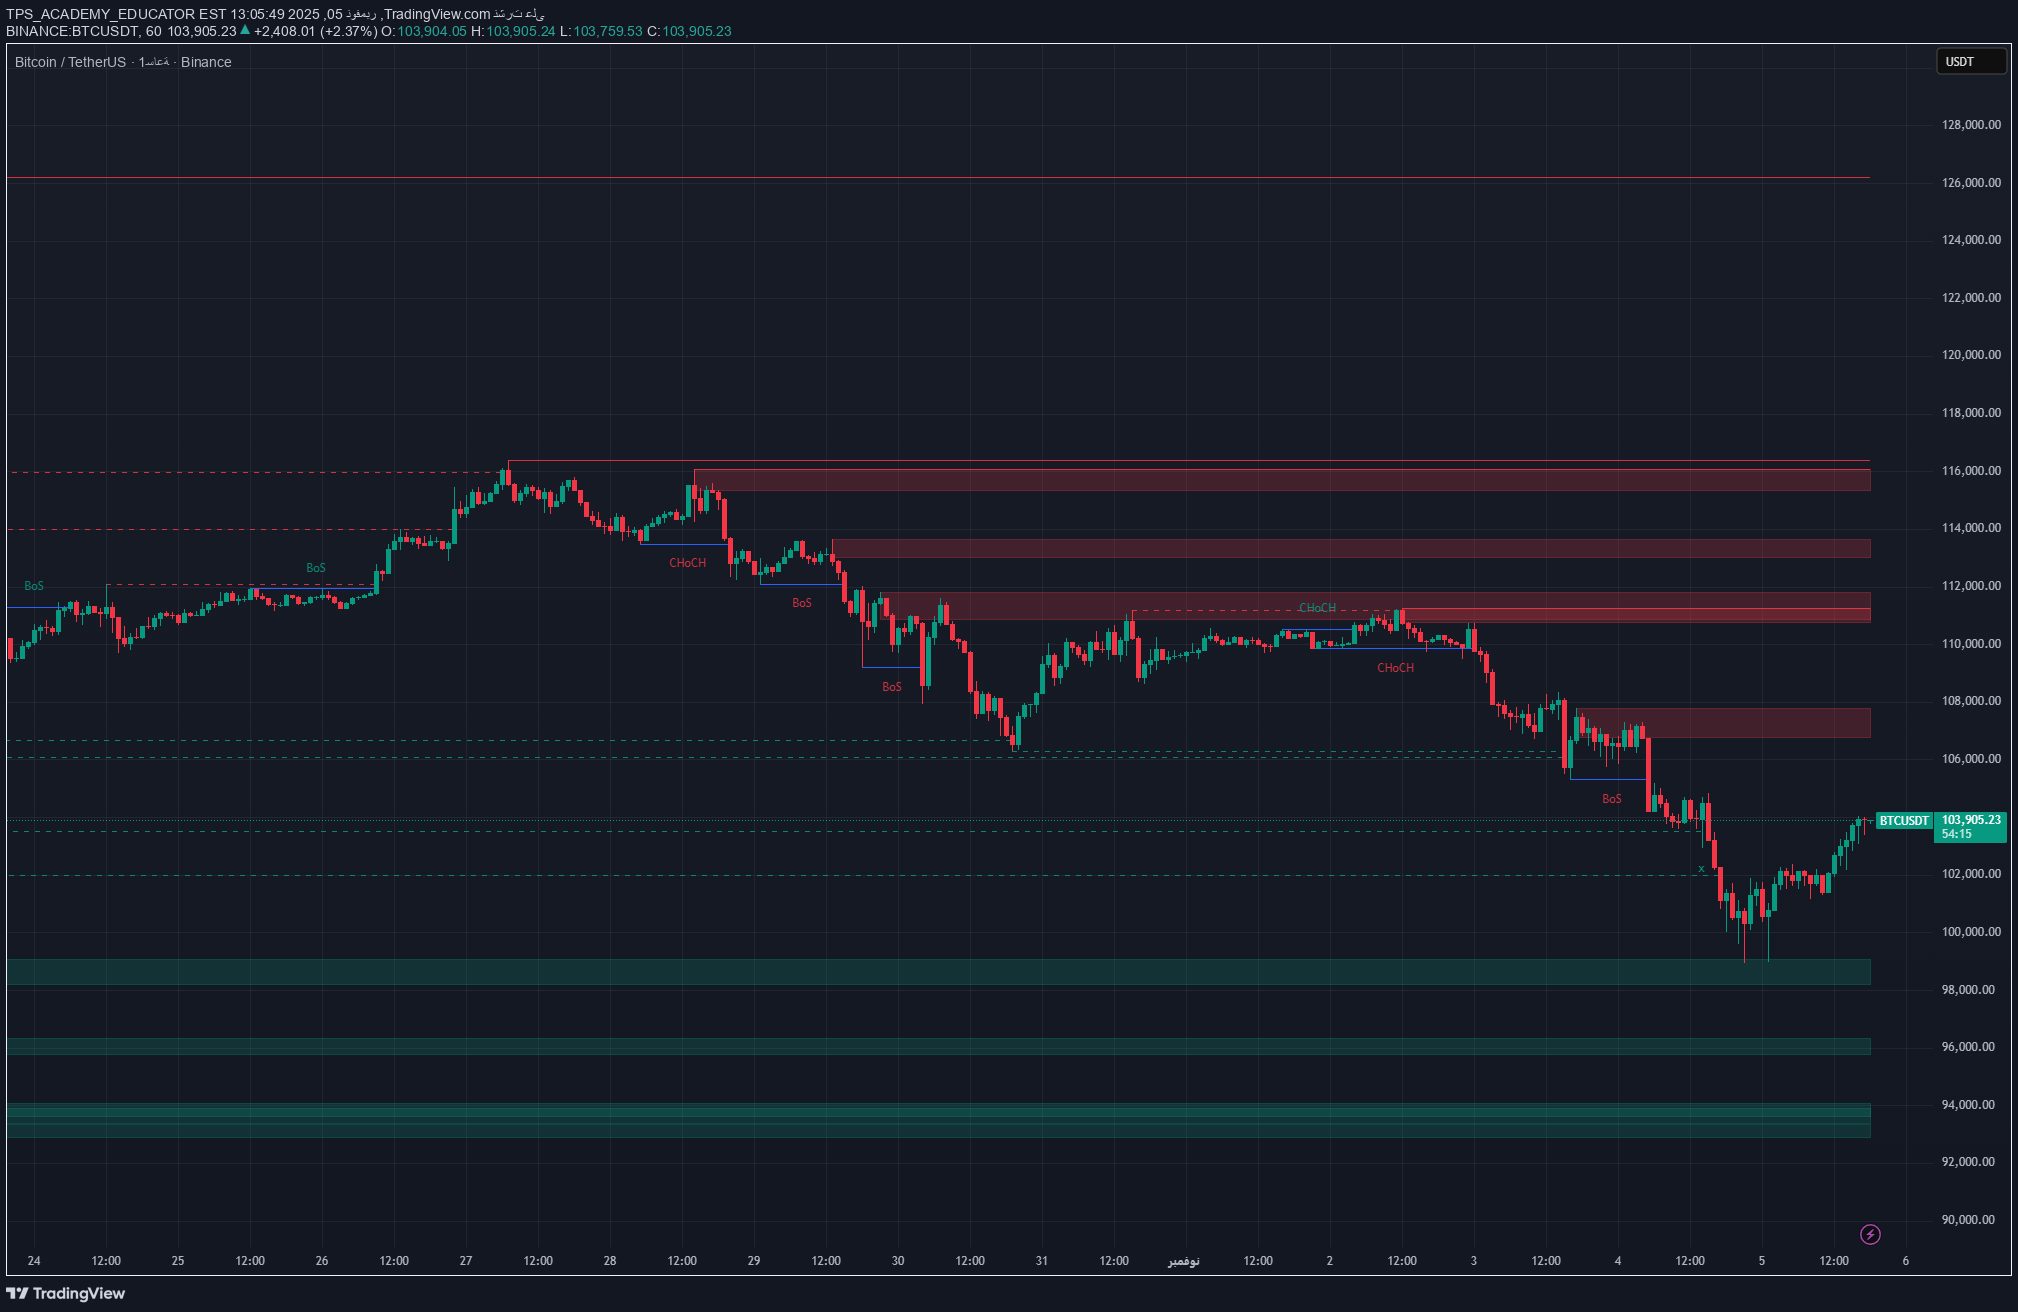
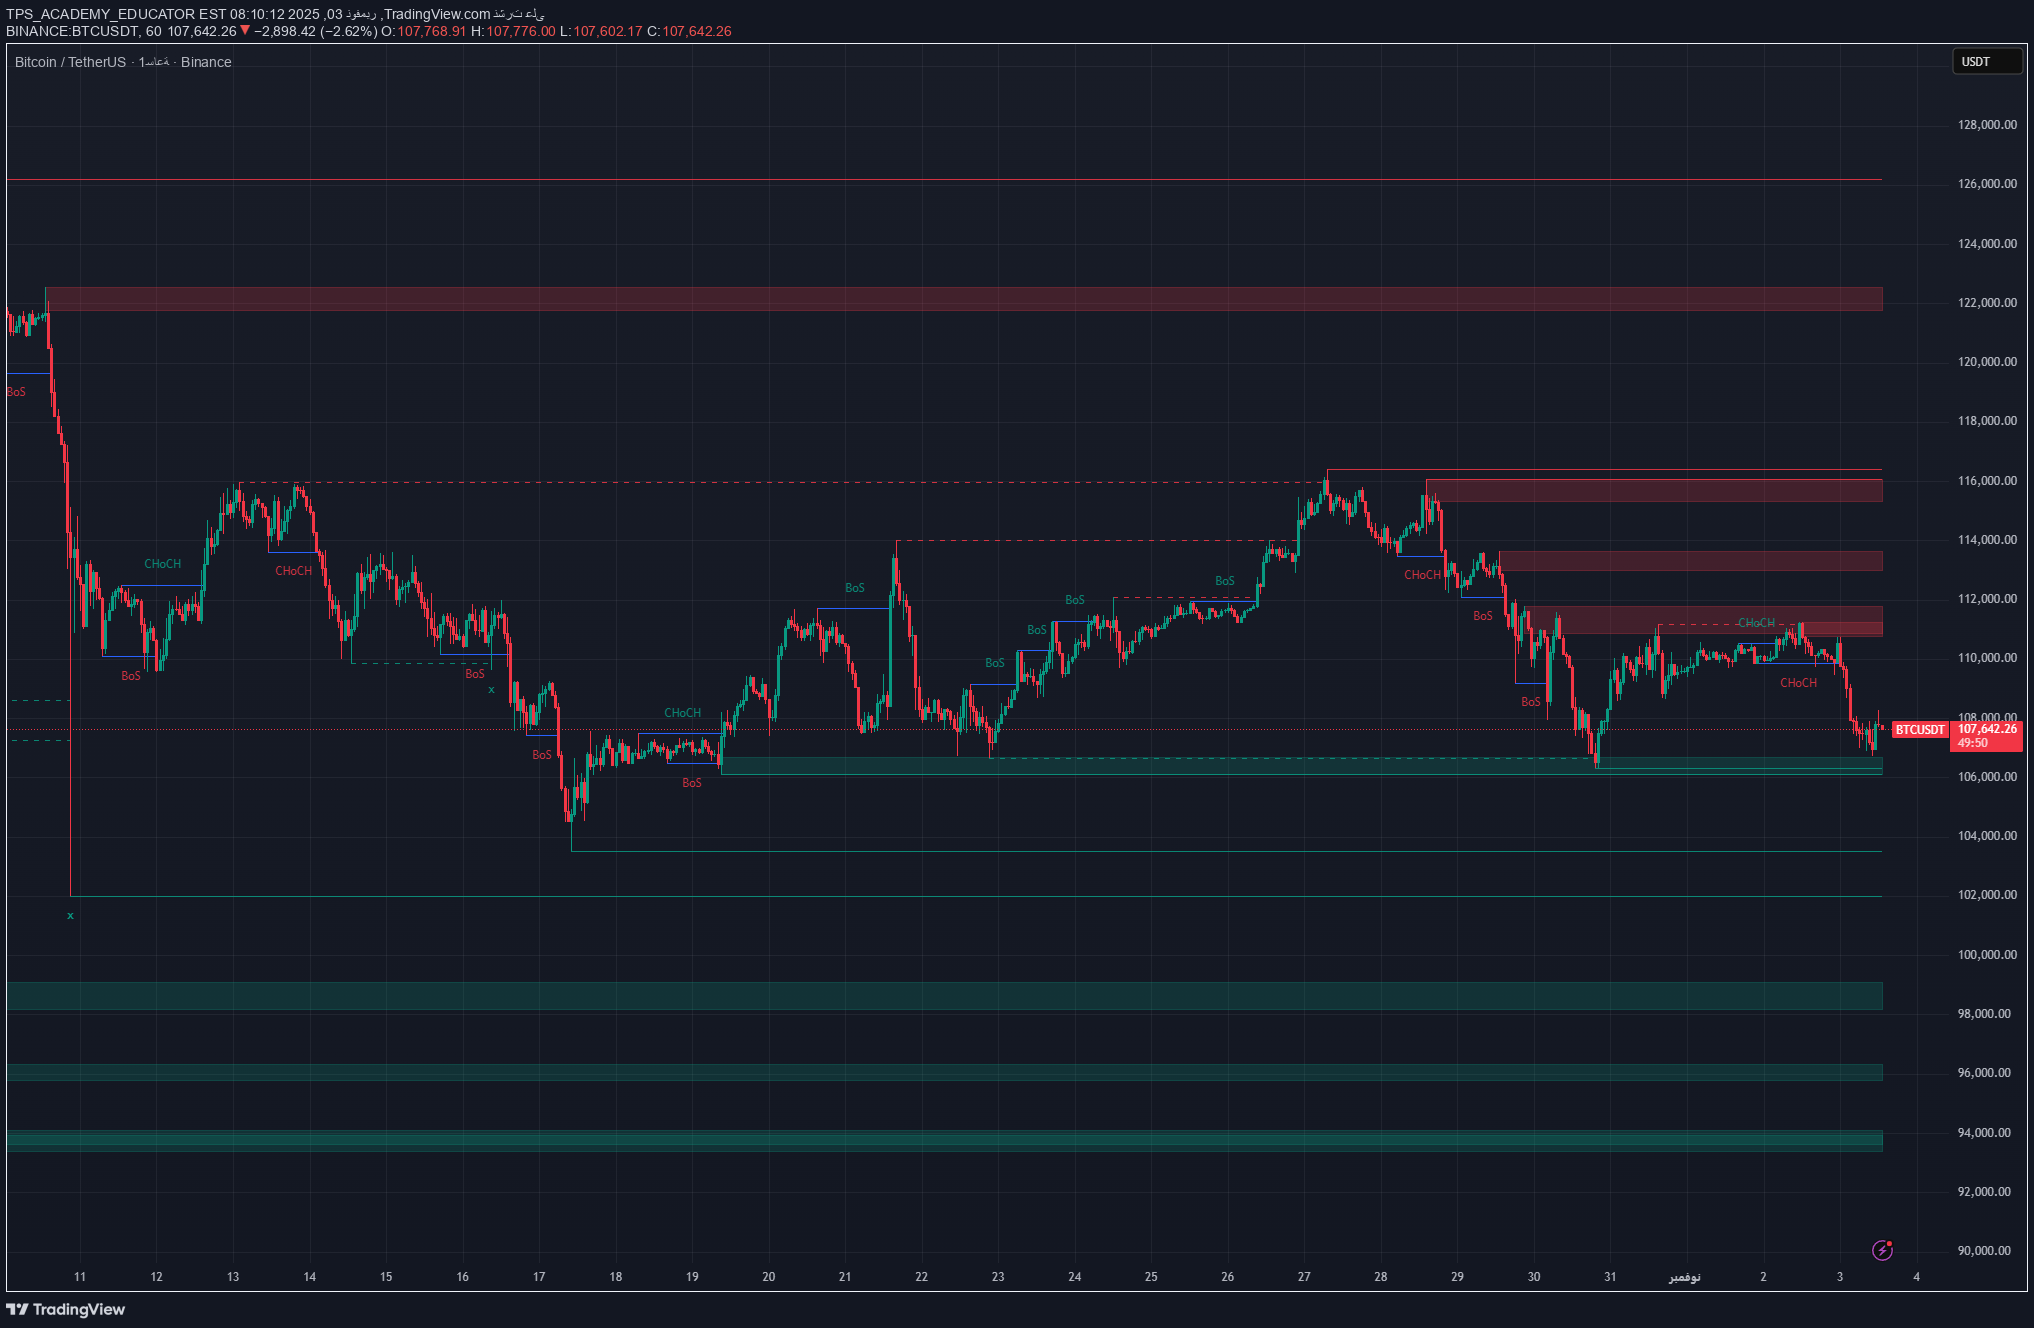
بیت کوین در آستانه تصمیم سرنوشتساز: آیا ریزش ادامه دارد یا صعود اصلاحی قوی میشود؟
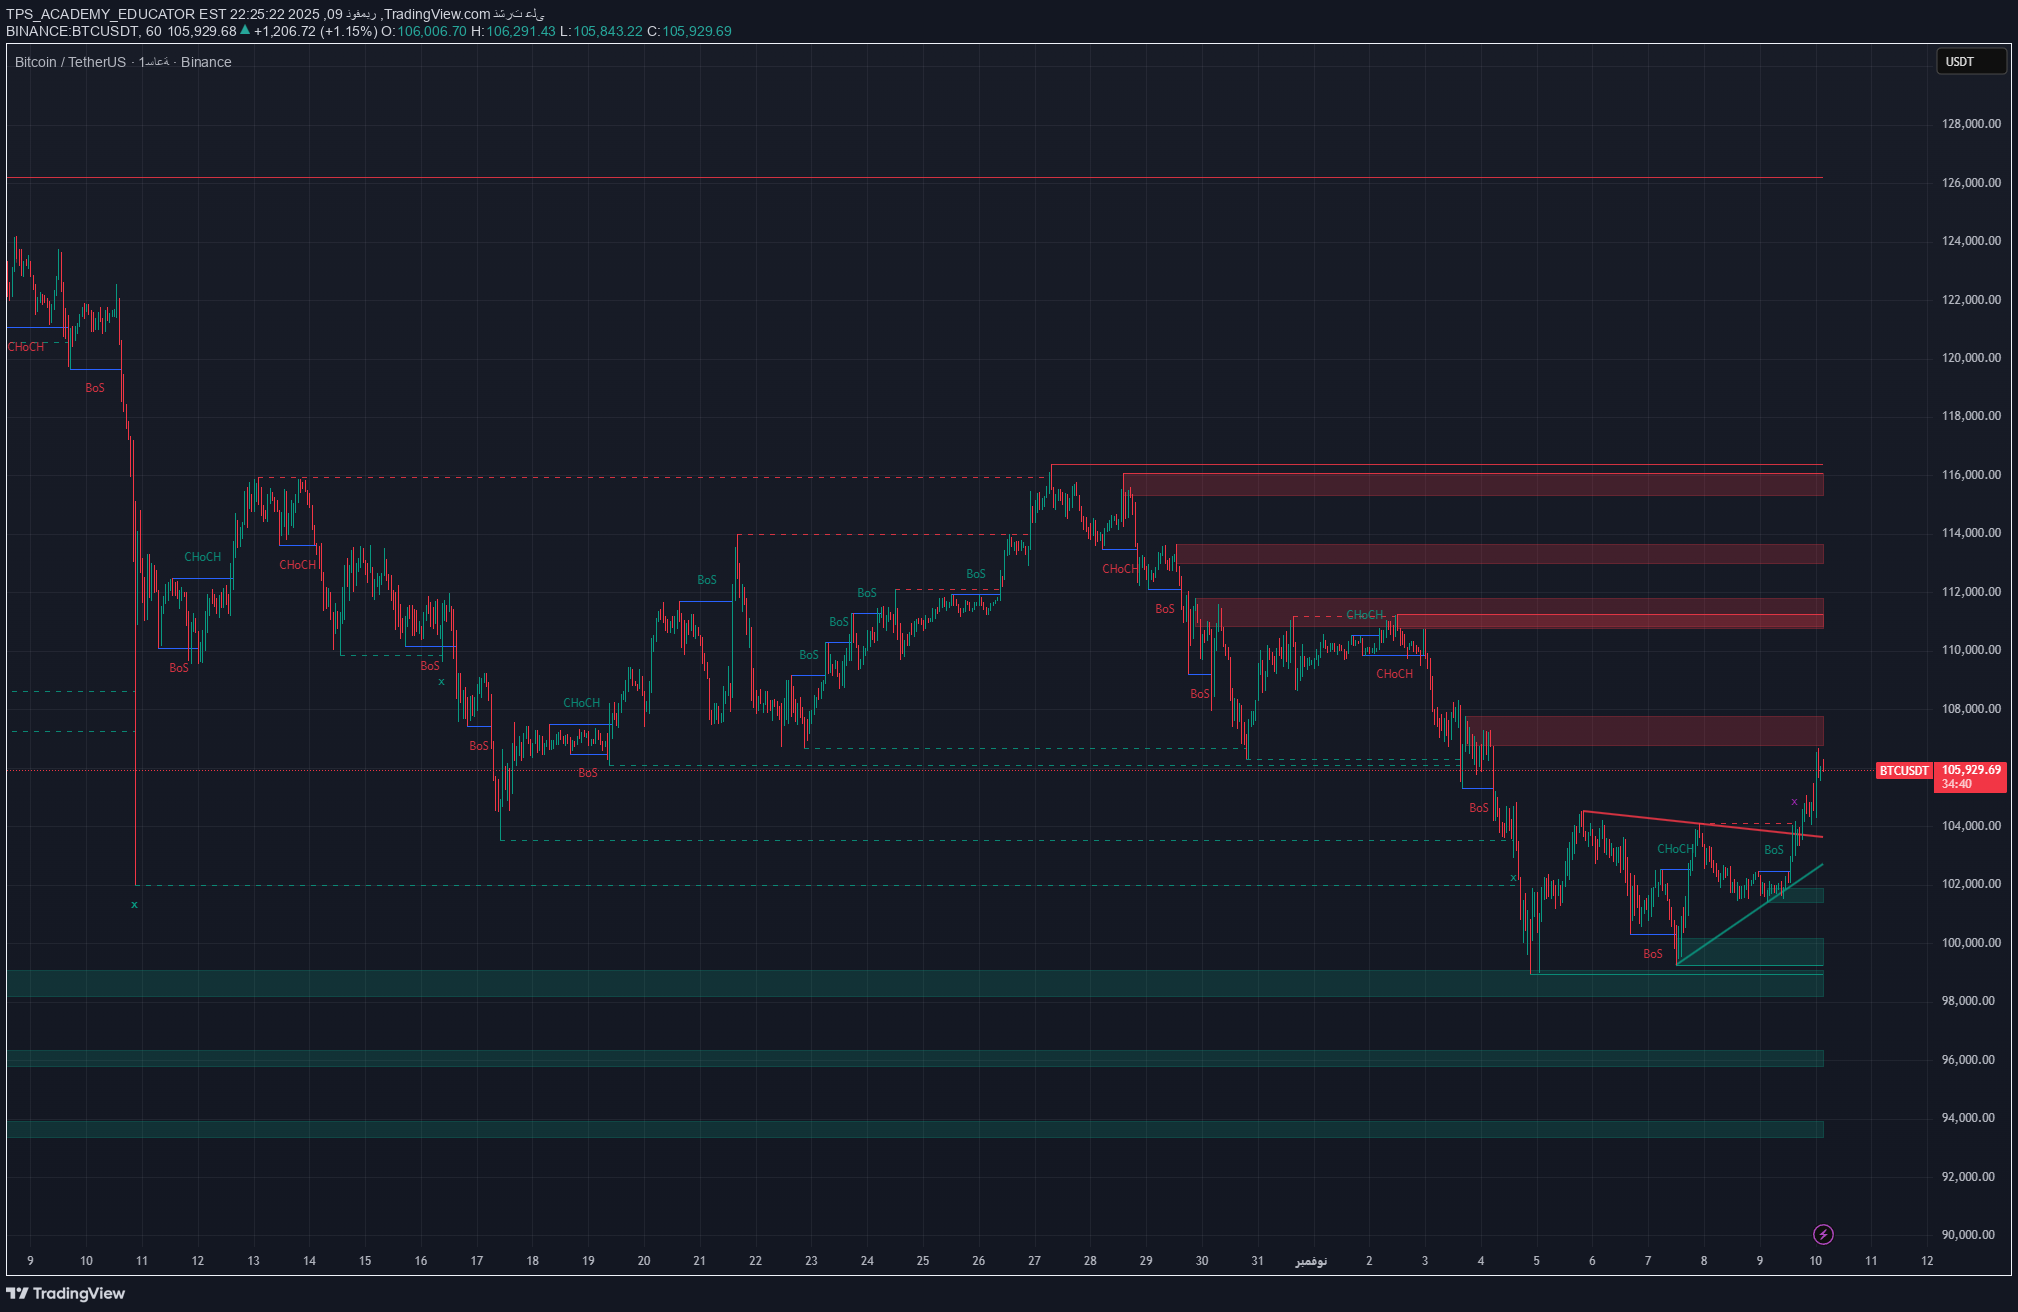
Bitcoin succeeded in rebounding strongly from the demand area 98,500 – 100,000 USDT after a sharp decline. We saw a bullish structural breakout (BoS) followed by a clear change in trend (CHoCH) on the hourly time frame, It shows the beginning of a short-term upward corrective wave within the general downward trend. The price is currently facing a key supply zone between 106,000 – 108,000 USDT consistent with the previous downtrend, Which makes this level a crucial pivot to determine whether the correction will end here or extend towards higher areas. 🔹Possible scenarios: 🔻 Bearish scenario (likely): If the price fails to exceed the 106,000 – 108,000 supply area and strong rejection signals or reversal candles appear, We may see a resumption of the downtrend towards: ➡️ 102,000 – 100,000 as first goals, Then 98,000 – 95,000 if the demand zone breaks again. 🔹 The bullish (alternative) scenario: If the price succeeds in penetrating and stabilizing above 108,000, the way will open for an extended rise towards: ➡️ 110,500 – 112,000 as upper corrective targets. 💼 Trading opportunities: Sell from supply zone (most likely scenario): 🔸 Entry: 106,000 – 108,000 🎯 Goals: 102,000 – 98,000 🛑 Stop loss: above 108,500 Short-term corrective buying: 🔹 Entry: 100,000 – 101,000 🎯 Goal: 106,000 🛑 Stop loss: below 99,000 🧭 General trend: The general trend remains bearish in the medium term after breaking the structural support areas. But the current upward movement is a natural correction after the recent strong pullback. 💡 Note from TPS Academy: Interaction with the 108,000 area will be the key to confirming the end of the correction or its extension towards higher levels. 🏷️ #BTCUSDT #Bitcoin #SmartMoney #TechnicalAnalysis #PriceAction #TradingView #TPSAcademy 🎯 Prepared and analyzed by: TPS ACADEMY – Educator Taher Elmonier
TPS_ACADEMY_EDUCATOR
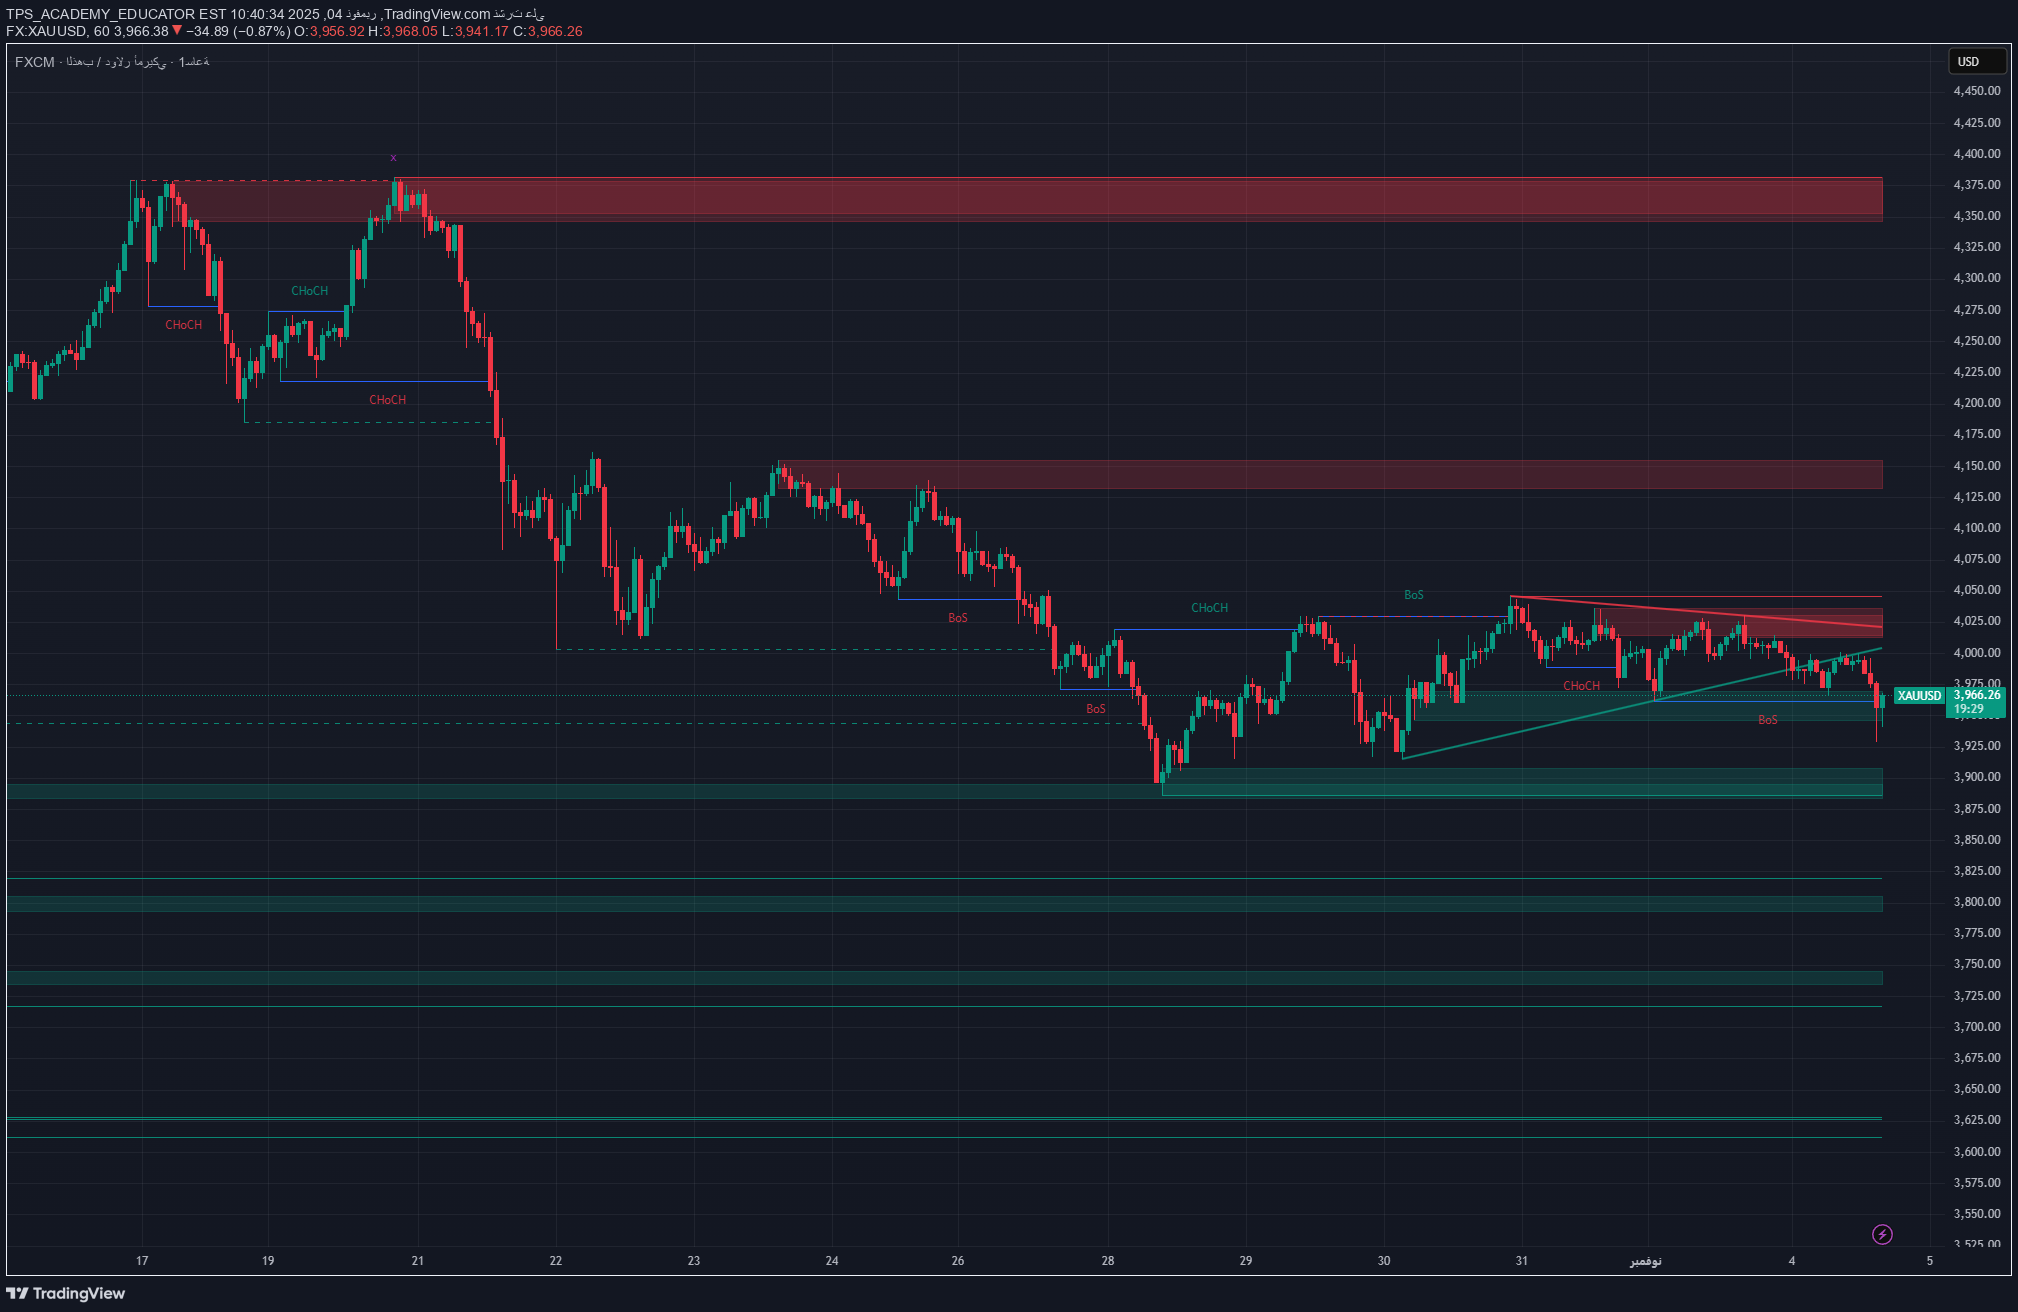
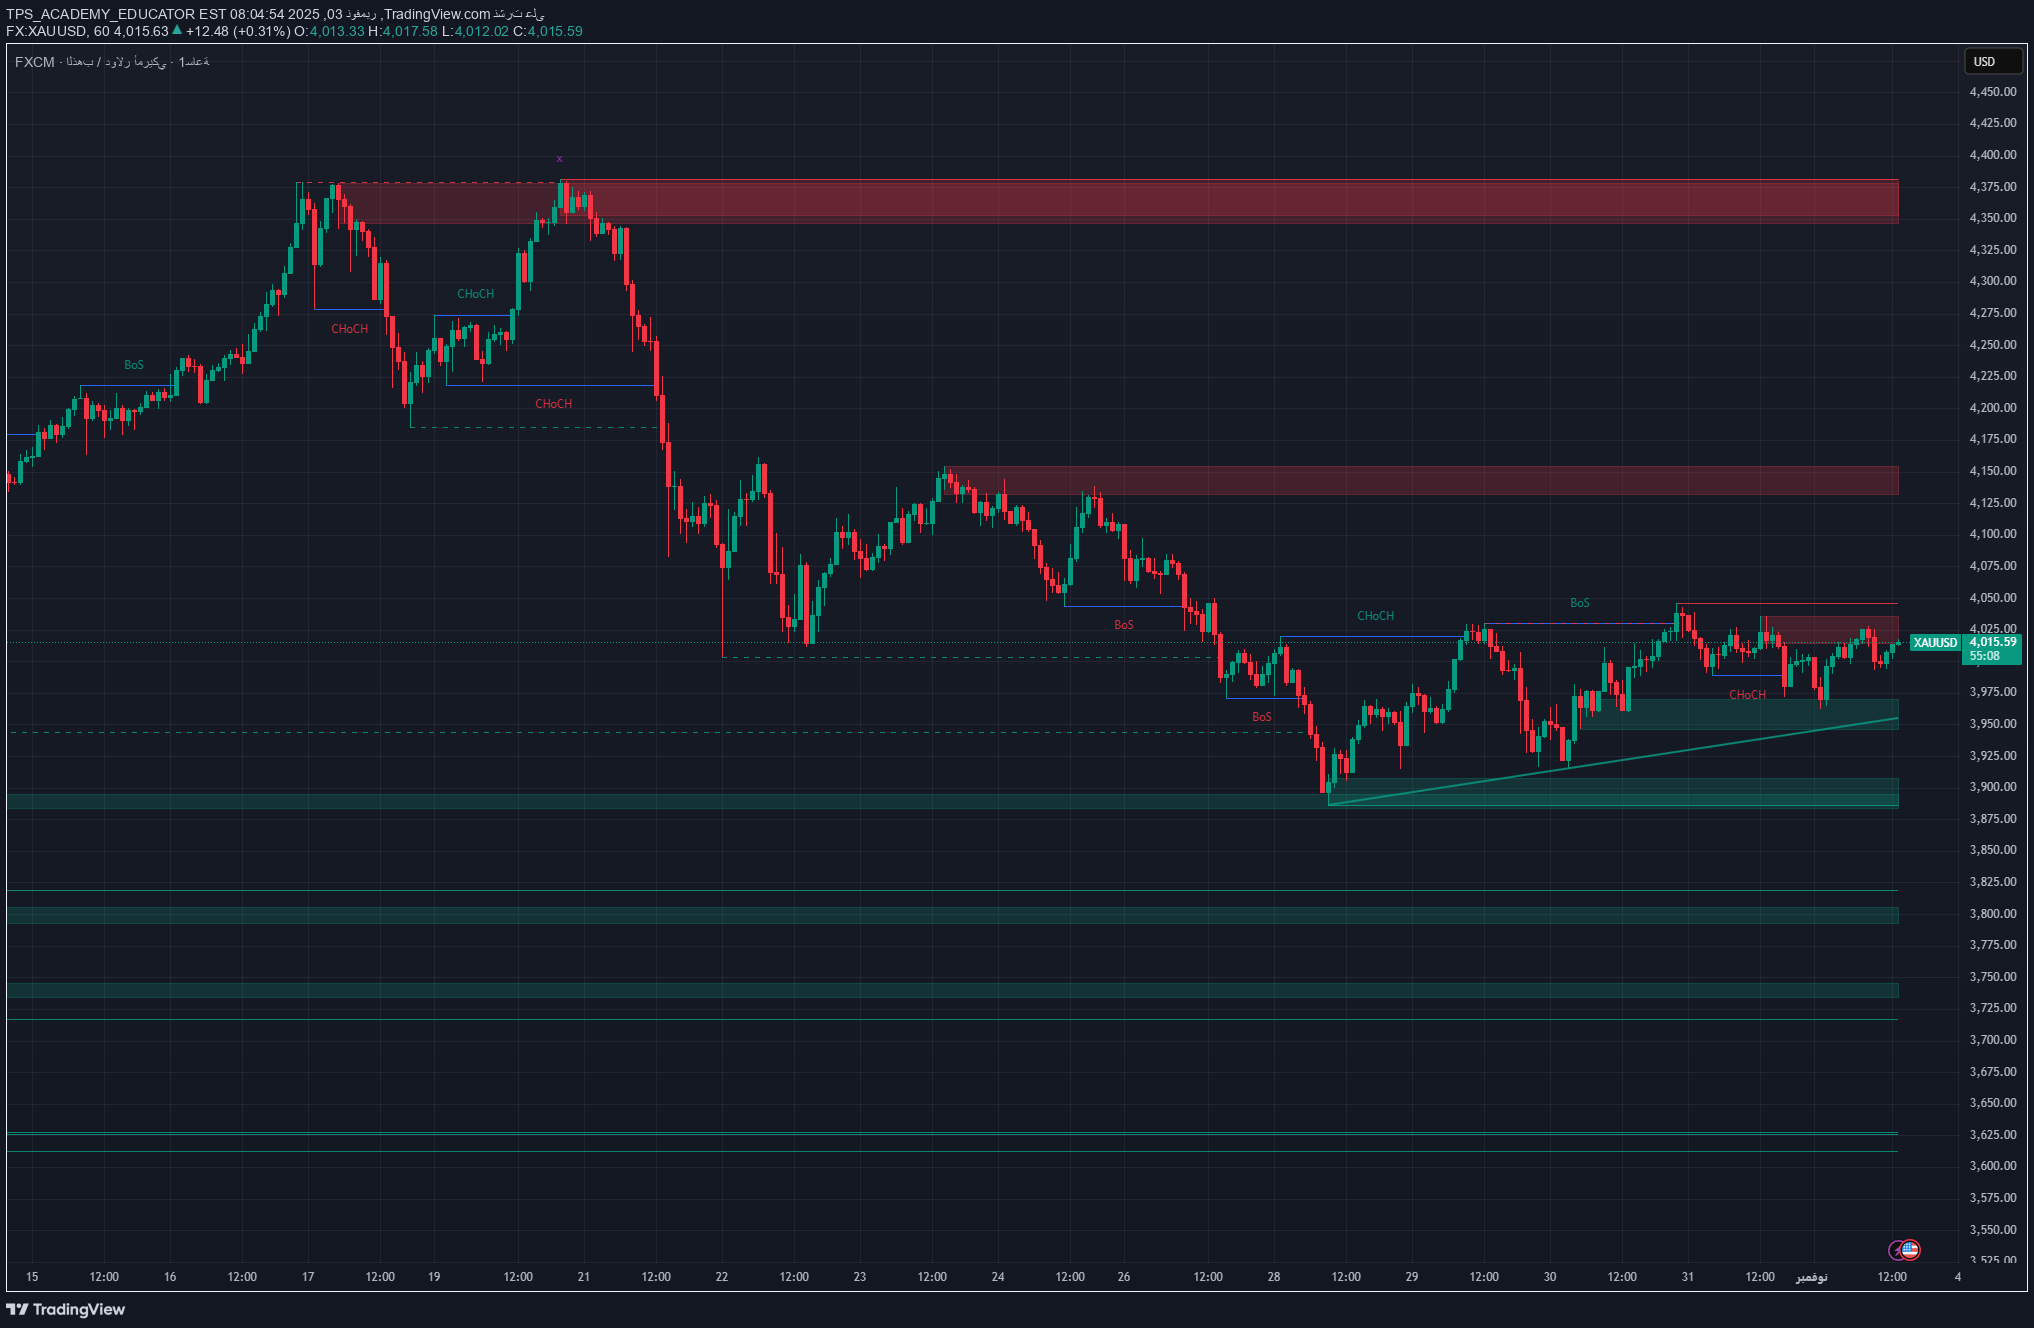
طلاء XAU/USD در یک قدمی سقوط: راز نوسانهای حیاتی طلا فاش شد!
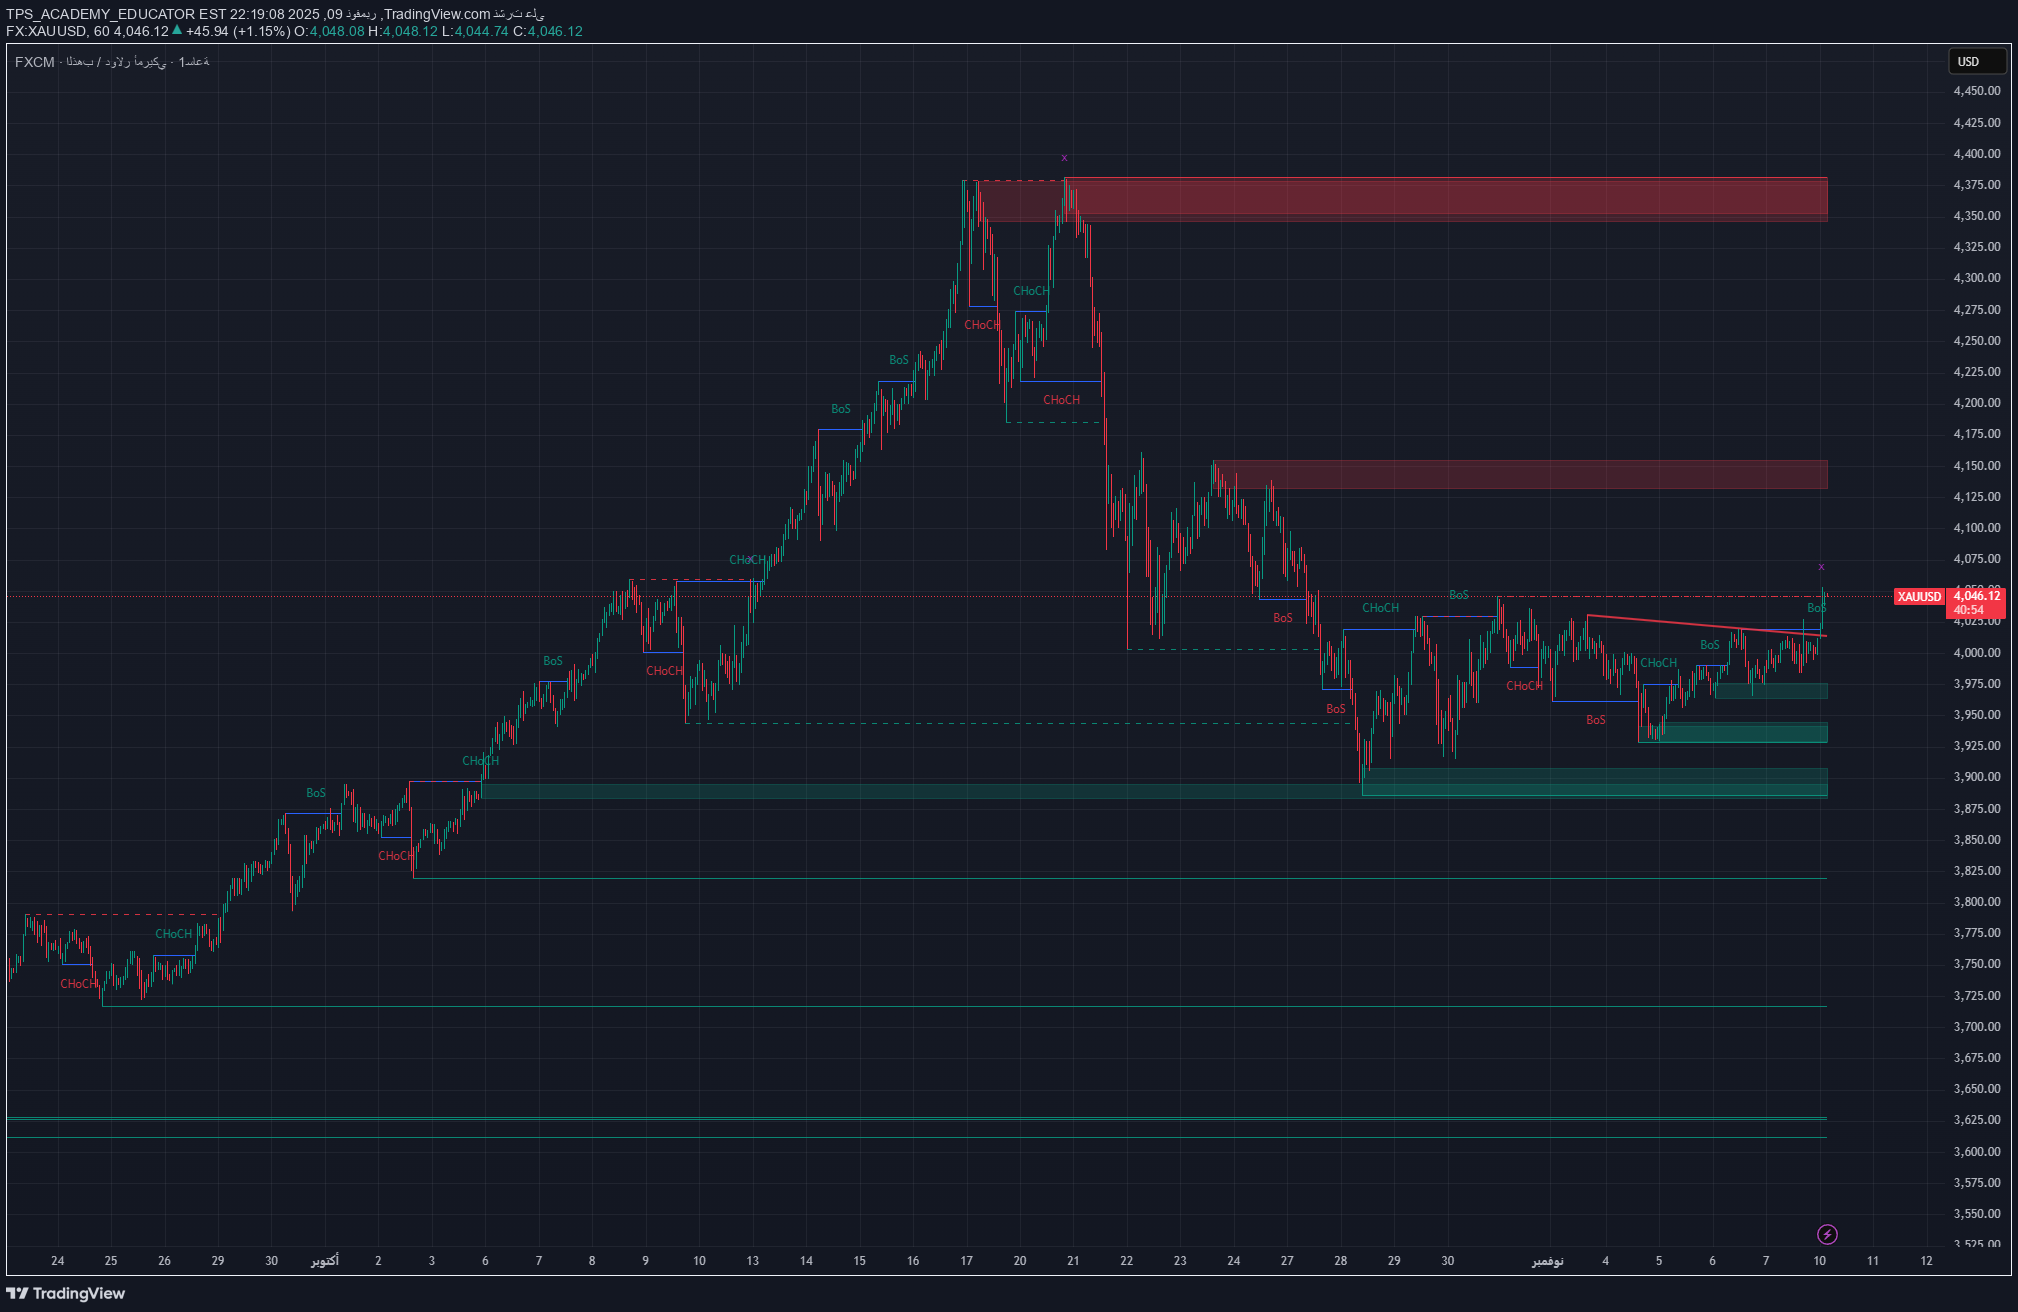
Gold has been moving for several days within a horizontal range between 3,940 and 4,080, after the strong bearish wave that started from the 4,360 – 4,400 supply zone. We notice on the hourly basis that the price is starting to show a clear consolidation below an important structural resistance area near 4,080, where a previous high converges with a structural breakout (BoS) that indicates the possibility of testing sellers again. At the same time, several strong demand zones are emerging below 3,950, reflecting a temporary balance between buyers and sellers ahead of the next move. 🔹Possible scenarios: 🔻 Bearish scenario (likely): If the price fails to close clearly above 4,080 – 4,100, selling pressure is expected to return towards: ➡️ 3,980 – 3,950 as the first support area, Then 3,900 – 3,860 if it is broken and the downward momentum continues. 🔹 The bullish (alternative) scenario: A strong and steady break above 4,100 may open the door to targeting 4,160 – 4,200 and later 4,360, which are critical supply areas that may determine gold’s direction in the medium term. 💼 Trading opportunities: Selling from resistance areas: 🔸 Entry: 4,070 – 4,090 🎯 Goals: 3,980 – 3,900 🛑 Stop loss: above 4,110 Buy from support areas: 🔹 Entry: 3,940 – 3,950 🎯 Goals: 4,050 – 4,100 🛑 Stop loss: below 3,920 🧭 General trend: The overall trend for gold is neutral to bearish as long as the structural resistance at 4,100 is not broken. 💡 Note from TPS Academy: The current sideways movement is considered a consolidation phase in preparation for an upcoming strong wave — careful monitoring of liquidity zones will be key to identifying the next trend. 🏷️ #XAUUSD #SmartMoney #PriceAction #TechnicalAnalysis #MarketStructure #TradingView #TPSAcademy #Gold
TPS_ACADEMY_EDUCATOR
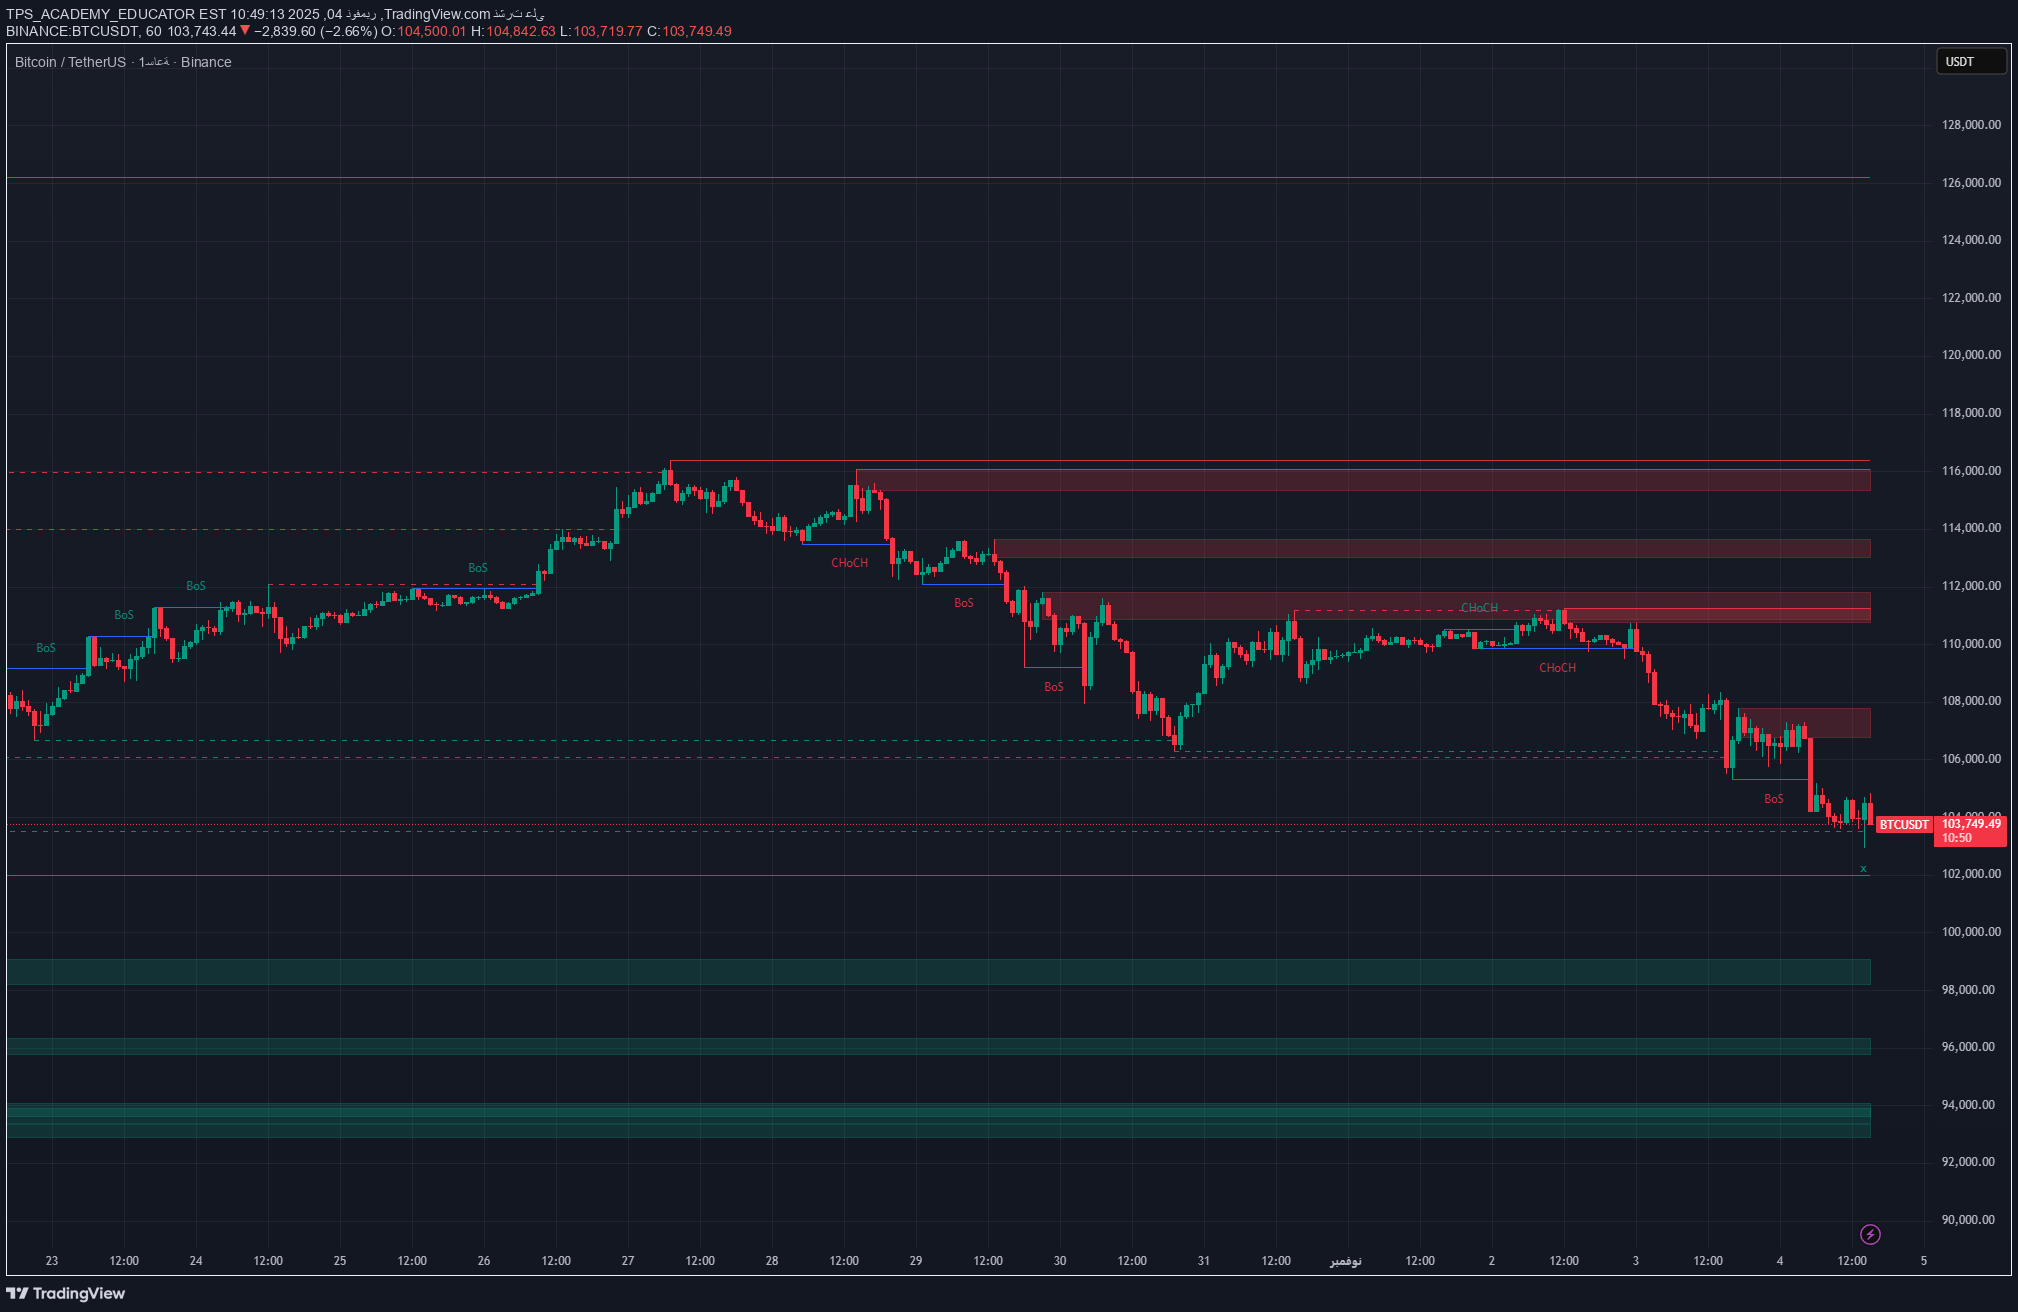
بیت کوین زیر فشار فروش: آیا سقوط به ۹۷,۰۰۰ دلار ادامه دارد؟
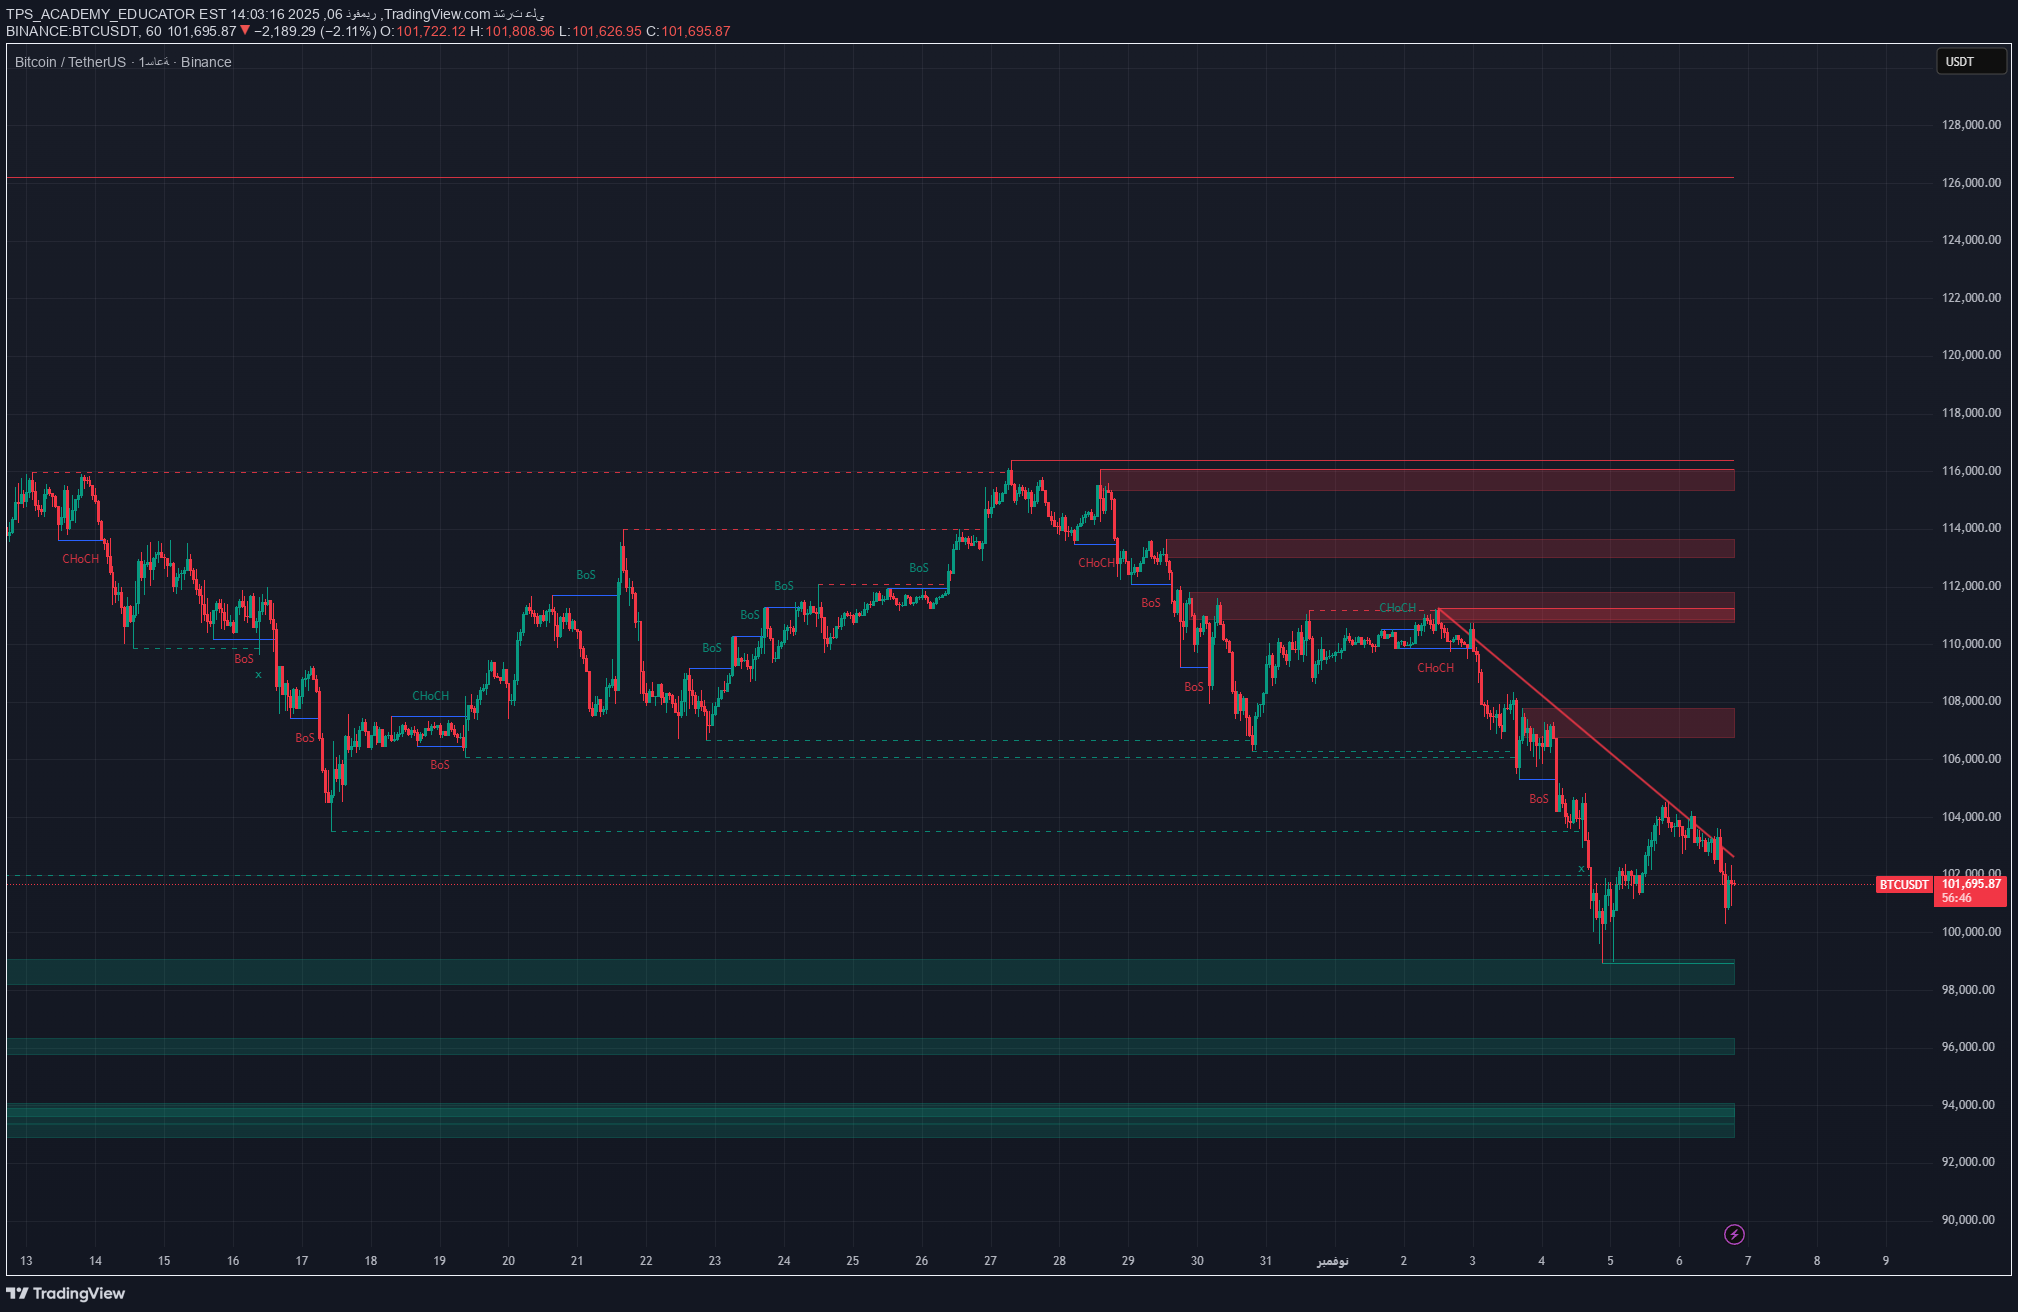
Bitcoin continues to trade within a bearish structure on the hourly frame after a strong rejection from the supply area between 112,000 – 115,000, which represented the end of the last bullish wave. Structural analysis shows a breakout sequential structure (BoS) with frequent trend changes (CHoCH) in the sell direction, clearly indicating bear control. Currently, the price is moving below a falling trend line since the end of October, and is currently testing a retracement level around 101,500 – 102,000. 🔹Possible scenarios: 🔻 Bearish scenario (likely): If the price fails to break the downtrend line or supply area 102,500 – 104,000, the decline is expected to resume towards: ➡️ 98,000 – 97,000 as a nearby demand area, Then 94,500 – 92,000 if it is broken to expand the downside range. 🔹 The bullish (alternative) scenario: If the price breaches the 104,500 level with a clear close, the correction could extend towards 107,000 - 108,500 before any possible return to the downside from the upper liquidity areas. 💼 Trading opportunities: Sell from retest supply area: 🔸 Entry: 102,500 – 104,000 🎯 Goals: 98,000 – 94,500 🛑 Stop loss: above 105,000 Corrective buying (short term): 🔹 Entry: 98,000 – 97,000 🎯 Goal: 103,000 🛑 Stop loss: below 96,500 🧭 General trend: The general trend is still bearish in the short and medium term, especially after the price failed to maintain the upper liquidity areas and confirmed the weakness of buyers upon each retest. 💡 Tip from TPS Academy: Watch the price behavior at 102,000 – it is a separating area between the resumption of the correction or the continuation of the selling wave. 🏷️ #Bitcoin #BTCUSDT #SmartMoney #PriceAction #TechnicalAnalysis #MarketStructure #TradingView #Crypto ✳️ Smart Money Concepts style structural analysis – provided by TPS Academy
TPS_ACADEMY_EDUCATOR
طلاء الذهب (XAU/USD): آماده انفجار نزولی یا جهش ناگهانی؟ تحلیل کلیدی ساختار بازار
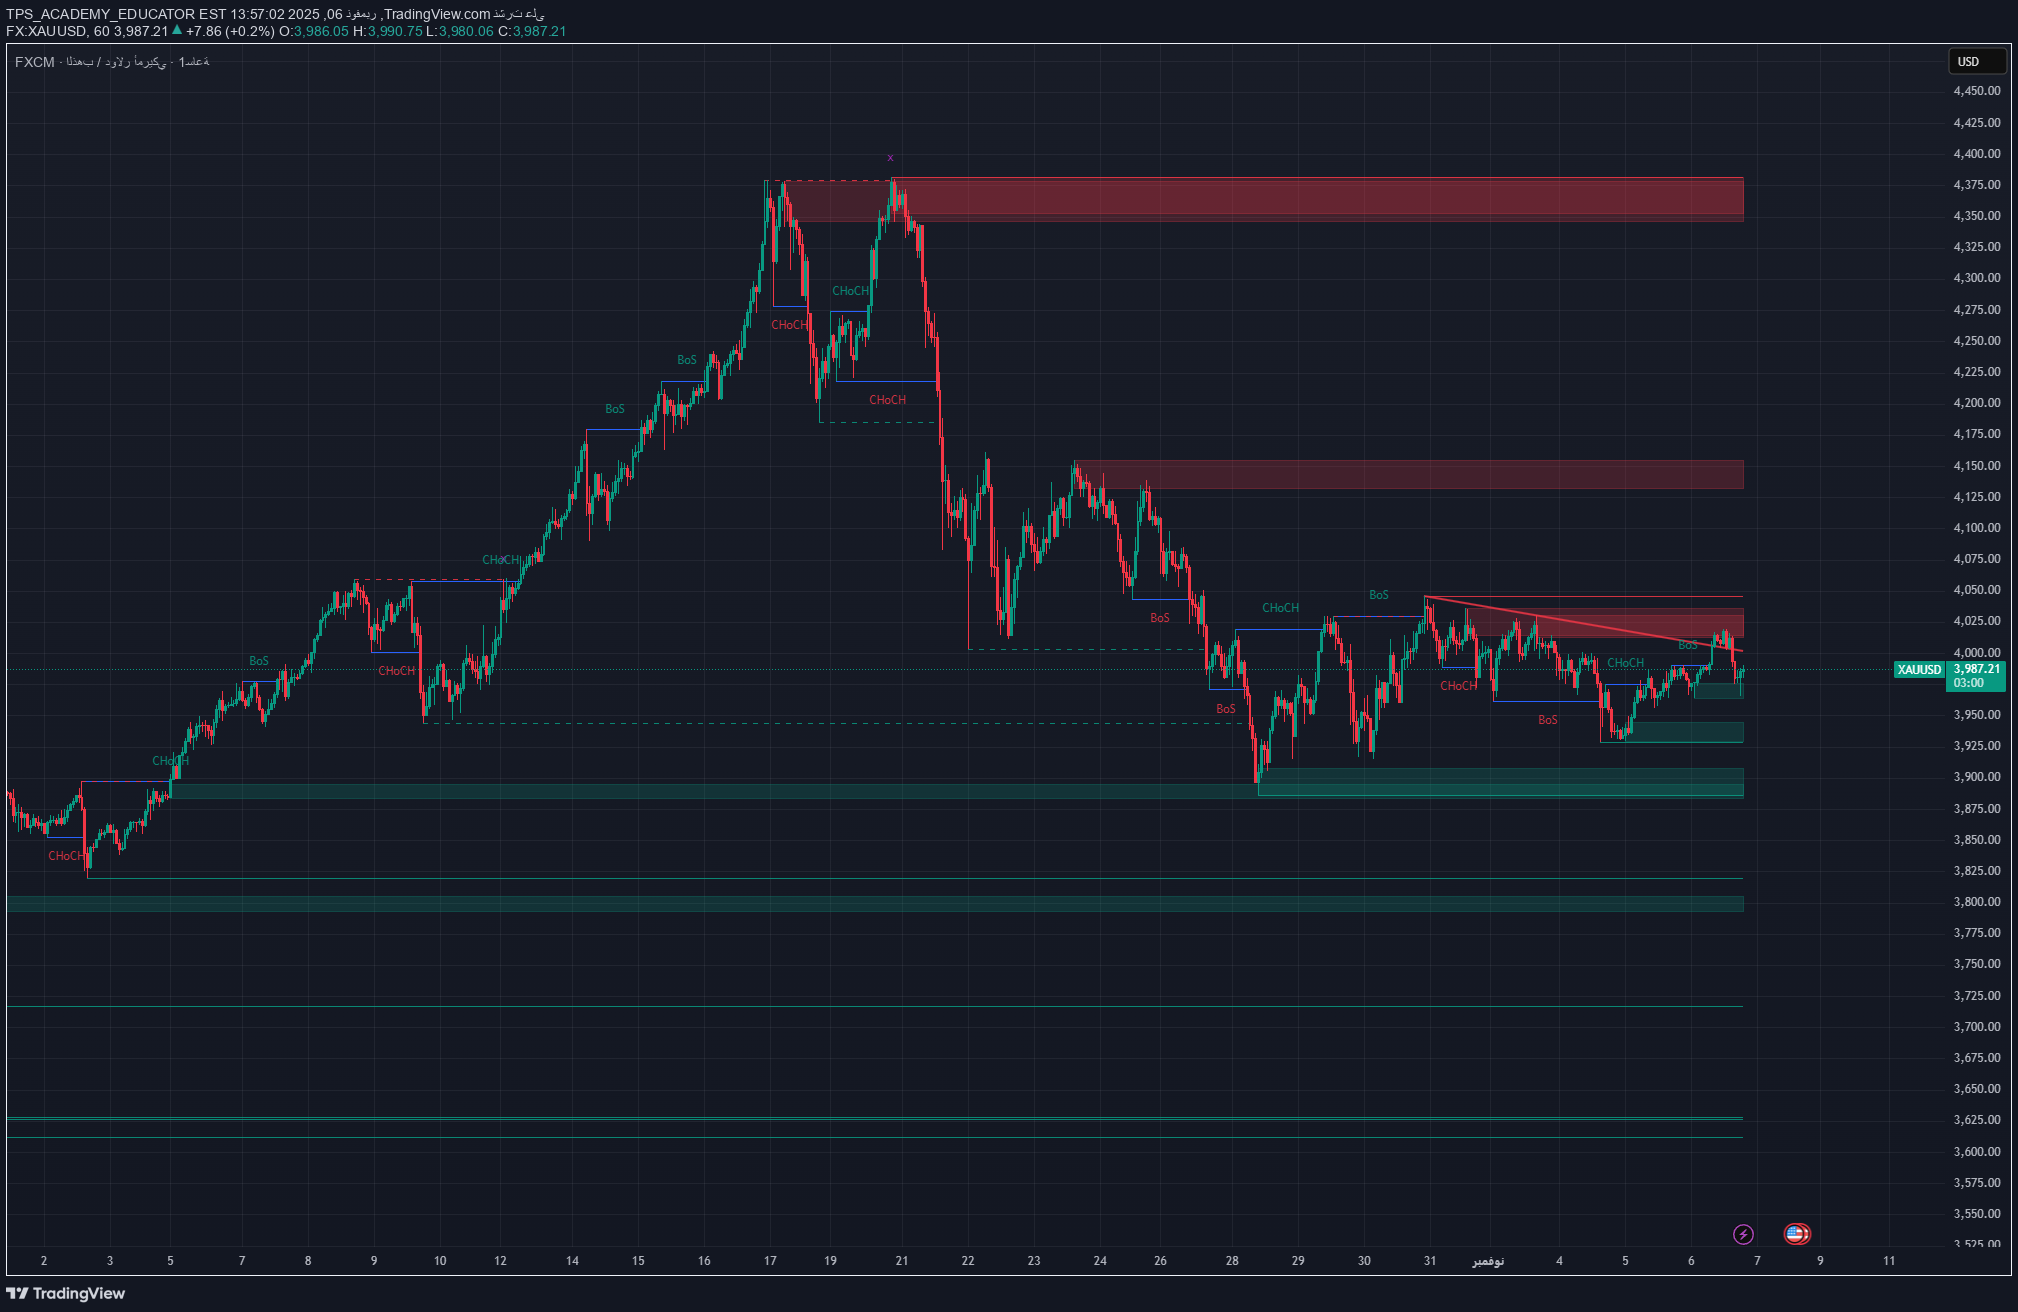
Gold has been moving for several weeks in a bearish horizontal range after the strong bullish wave that stopped at the main supply area between 4,350 - 4,300, which represented an important structural high. Since then, the price has broken several successive support areas with confirmation of the structure break (BoS) at the 4,150 and 4,050 levels, confirming the market's transition from the consolidation phase to the distribution phase. Despite recovery attempts, the 4,000-4,050 area still represents strong resistance that hinders any upward correction. 🔹Possible scenarios: 🔻 Bearish scenario (likely): As long as the price remains below 4,050, the downward trend remains valid, with the possibility of targeting: ➡️ 3,900 – 3,870 (near demand area) If it is broken, the decline will extend to 3,750-3,700 as a deeper structural support area. 🔹 The bullish (alternative) scenario: A clear breach and stability above 4,050 - 4,080 will lead to the activation of an upward correction movement towards 4,150 - 4,200, and perhaps a retest of 4,300 before resuming the downward trend again. 💼 Potential trading opportunities: Sale from display areas: 🔸 Entry: 4,030 – 4,050 🎯 Goals: 3,900 – 3,750 🛑 Stop loss: above 4,080 Speculative buying from demand areas: 🔹 Entry: 3,890 – 3,870 🎯 Goal: 4,000 🛑 Stop loss: below 3,850 🧭 General trend: The general trend is still bearish within a larger corrective structure within the daily frame, and the market is currently in a redistribution phase before the next movement. 💡 Tip from TPS Academy: Wait for a clear break in the structure before making a major entry decision, as the market is now showing a liquidity build-up before a strong move. 🏷️ #XAUUSD #SmartMoney #PriceAction #TechnicalAnalysis #MarketStructure #TradingView #Gold ✳️ Smart Money Concepts style structural analysis – provided by TPS Academy
TPS_ACADEMY_EDUCATOR
طلا (XAU/USD): سقف قیمتی کجاست؟ تحلیل نوسان طلا در مسیر نزولی
Gold is still moving in a sideways range after the violent decline from the main supply zone at 4,350-4,300, which formed a clear structural top for the market. Prices failed to cross the secondary supply zone at 4,050 – 4,000, which confirmed the stability of sellers and the continuation of the bearish structure. On the other hand, the price found stable support around the 3,900 – 3,870 demand area, where limited signs of accumulation began to appear. 🔹Possible scenarios: Bearish scenario (likely): As long as the price is below 4,050 - 4,000, the general trend remains negative, with the possibility of targeting: ➡️ 3,900 – 3,870 (current demand area) If it is broken with a clear close, the decline will extend towards 3,750 - 3,700. Bullish scenario (temporary alternative): A strong breach of the 4,050 area and stability above it may bring gold into an upward correction towards 4,150 - 4,200 before resuming the main downward path. 💼 Trading opportunities: Sale from display areas: 🔸 Entry: 4,000 – 4,050 🎯 Goals: 3,900 – 3,750 🛑 Stop loss: above 4,070 Short term purchase of order: 🔹 Entry: 3,890 – 3,870 🎯 Goal: 4,000 🛑 Stop loss: below 3,850 🧭 General trend: The overall trend remains clearly bearish, with selling momentum prevailing over the move. 💡 Tip from TPS Academy: Wait for a clear structure break before entering any major trading position — the market is currently in a redistribution phase. 🏷️ #XAUUSD #SmartMoney #PriceAction #MarketStructure #Gold #TradingView #TechnicalAnalysis ✳️ Smart Money Concepts style structural analysis – provided by TPS Academy
TPS_ACADEMY_EDUCATOR
بیتکوین زیر فشار: آیا سقوط به ۹۲,۰۰۰ دلار قطعی است؟ (تحلیل ساختار بازار BTC/USDT)
The price of Bitcoin against Tether is still under clear selling pressure after a series of successive breakout structures (BoS) below the structural supply areas, especially between 112,000 – 116,000, which is the area from which the last selling wave started. The market recently saw a weak structure change (CHoCH) on small time frames after a bounce from the 100,000 – 99,000 demand zone, indicating a possible temporary correction before the downtrend continues. 🔹Possible scenarios: Bearish scenario (likely): As long as the price is below 106,000 – 107,000, the downward trend remains dominant. We will likely see a retest of the mentioned supply area before resuming the decline towards the following targets: ➡️ 99,000 – 98,000 Then the deeper zone is at 94,000 – 92,000. Bullish scenario (corrective): If the price manages a clear structural break above 107,000, the correction may extend until the nearest supply zone at 110,000 – 112,000 before sellers return strongly. 💼 Trading opportunities: Sell after retesting the supply area: 🔸 Entry: 106,000 – 107,000 🎯 Goals: 99,000 – 94,000 🛑 Stop loss: above 108,000 Short-term corrective buying: 🔹 Entry: 101,000 – 100,000 🎯 Goal: 106,000 🛑 Stop loss: below 98,500 🧭 General trend: The general trend is still clearly bearish on the medium time frames, and it is preferable to focus on selling opportunities from supply areas as long as the ascending structure is not broken with certainty. 💡 Tip from TPS Academy: Patience in retesting before entering gives an advantage in entry point accuracy and risk management. 🏷️ #BTCUSDT #SmartMoney #MarketStructure #PriceAction #Crypto #Bitcoin #TechnicalAnalysis #TradingView ✳️ Smart Money Concepts style structural analysis – provided by TPS Academy
TPS_ACADEMY_EDUCATOR
تحليل بيتكوين: سيطرة البائعان مستمرة بعد كسر هيكل رئيسي! (توقعات سعر BTC)
Bitcoin continues to trade within a clear bearish trend after a series of Breaking Structure (BoS) and Change of Behavior (CHoCH) on the hourly frame, which confirms the control of sellers and the continued weakness of purchasing momentum. The price failed to hold above the main supply area at 112,000 – 115,000, which has now become a strong resistance area that pushed the price down successively until it broke the 106,000 support. 🔹Possible scenarios: Bearish scenario (likely): If the current negative structure continues, the decline is expected to extend towards the following demand areas: ➡️ 103,000 – 101,500 If this area is broken, the next target will be at 98,000 – 96,000. Bullish scenario (corrective): We may see a corrective bounce from the 103,000 area to retest the recent supply area between 107,500 – 109,000 before completing the downtrend. 💼 Trading opportunities: Sell after retest: 🔸 Entry: 107,500 – 109,000 🎯 Goals: 103,000 – 98,000 🛑 Stop loss: above 110,000 Corrective buying (short term): 🔹 Entry: 103,000 🎯 Goal: 108,000 🛑 Stop loss: below 101,500 🧭 General trend: The overall trend is still clearly bearish, supported by successive breakouts of the structure and the inability of buyers to regain momentum. 💡 Tip from TPS Academy: Maintain a clear structural perspective, and monitor the price reaction at 103,000 to determine the continuation of the downward wave or the beginning of a new correction. 🏷️ #BTCUSDT #Bitcoin #Crypto #SmartMoney #PriceAction #TechnicalAnalysis #TradingView
TPS_ACADEMY_EDUCATOR
سقوط الذهب (XAU/USD): ضعف متزايد ودعم حاسم مكسور!
Gold continues to show clear weakness after failing to cross the 4050-4070 area, which has now turned into a strong supply zone. The price formed a descending triangle pattern and was confirmed with the structure (BoS) breaking below 3950, strengthening sellers' control at the moment. On the hourly time frame, we observe that the market is moving in a sequence of bearish BoS and CHoCH, with a successful retest of the broken demand zone, indicating a possible continuation of the negative momentum towards lower areas. 🔹Possible scenarios: Bearish scenario (likely): If selling pressure continues, the price is expected to move towards the following demand areas: ➡️ 3910 – 3880 Breaking it will open the way to 3820 – 3780. Bullish scenario (corrective): Any bounce from 3920 – 3950 may be considered just a correction before completing the downtrend, with strong resistance at 3990 – 4010. 💼 Trading opportunities: Sell trade after retest: 🔸 Entry: 3975 – 3990 🎯 Goals: 3920 – 3880 🛑 Stop loss: above 4010 Corrective buy deal (short term): 🔹 Entry: 3920 🎯 Goal: 3990 🛑 Stop loss: below 3900 🧭 General trend: The overall structure is bearish, and the market is still creating lower highs and lows with sellers clearly in control. 💡 Analyst tip: Watch the 3975 – 3990 area as an ideal area to catch a retest with the downside. 🏷️ #XAUUSD #gold #TPS_ACADEMY #SmartMoney #MarketStructure #PriceAction #TechnicalAnalysis #Forex #TradingView
TPS_ACADEMY_EDUCATOR
تحليل BTC/USDT: انهيار هيكلي يؤكد هبوط البيتكوين.. إلى أين يتجه السعر؟
BTC/USDT on the hourly time frame clearly shows the continuation of the bearish structure after the price failed to maintain the 111,000 – 112,000 levels, where a series of Breaking Structure (BoS) and Changing Structure (CHoCH) appeared that confirmed the market’s transition to a strong downtrend. The price is currently trading at an important demand zone between 107,500 – 106,500, which is a potential short-term bounce zone, but selling pressure is still dominant with a clear weakness in the upward momentum after each correction. 📊 Possible scenarios: Bearish scenario (likely): Breaking the 106,500 level will confirm the completion of the downward wave towards the 104,000 – 102,000 areas, followed by a stronger support area at 98,000 – 96,000. Temporary bullish scenario: A limited bounce from the current demand area may bring the price back to test the 110,000 – 111,500 supply area before resuming the downtrend. 🔹 Trading opportunities: Sell after correction towards: 110,000 – 111,000 🎯 Goals: 104,000 – 102,000 🛑 Stop loss: above 111,800 📉 General trend: clearly bearish with strong structural confirmations. 💡 Advice for analysts: Carefully monitor the price behavior around 106,500, as breaking it with a clear close means the price is entering a new distribution wave that may extend to much lower support levels.
TPS_ACADEMY_EDUCATOR
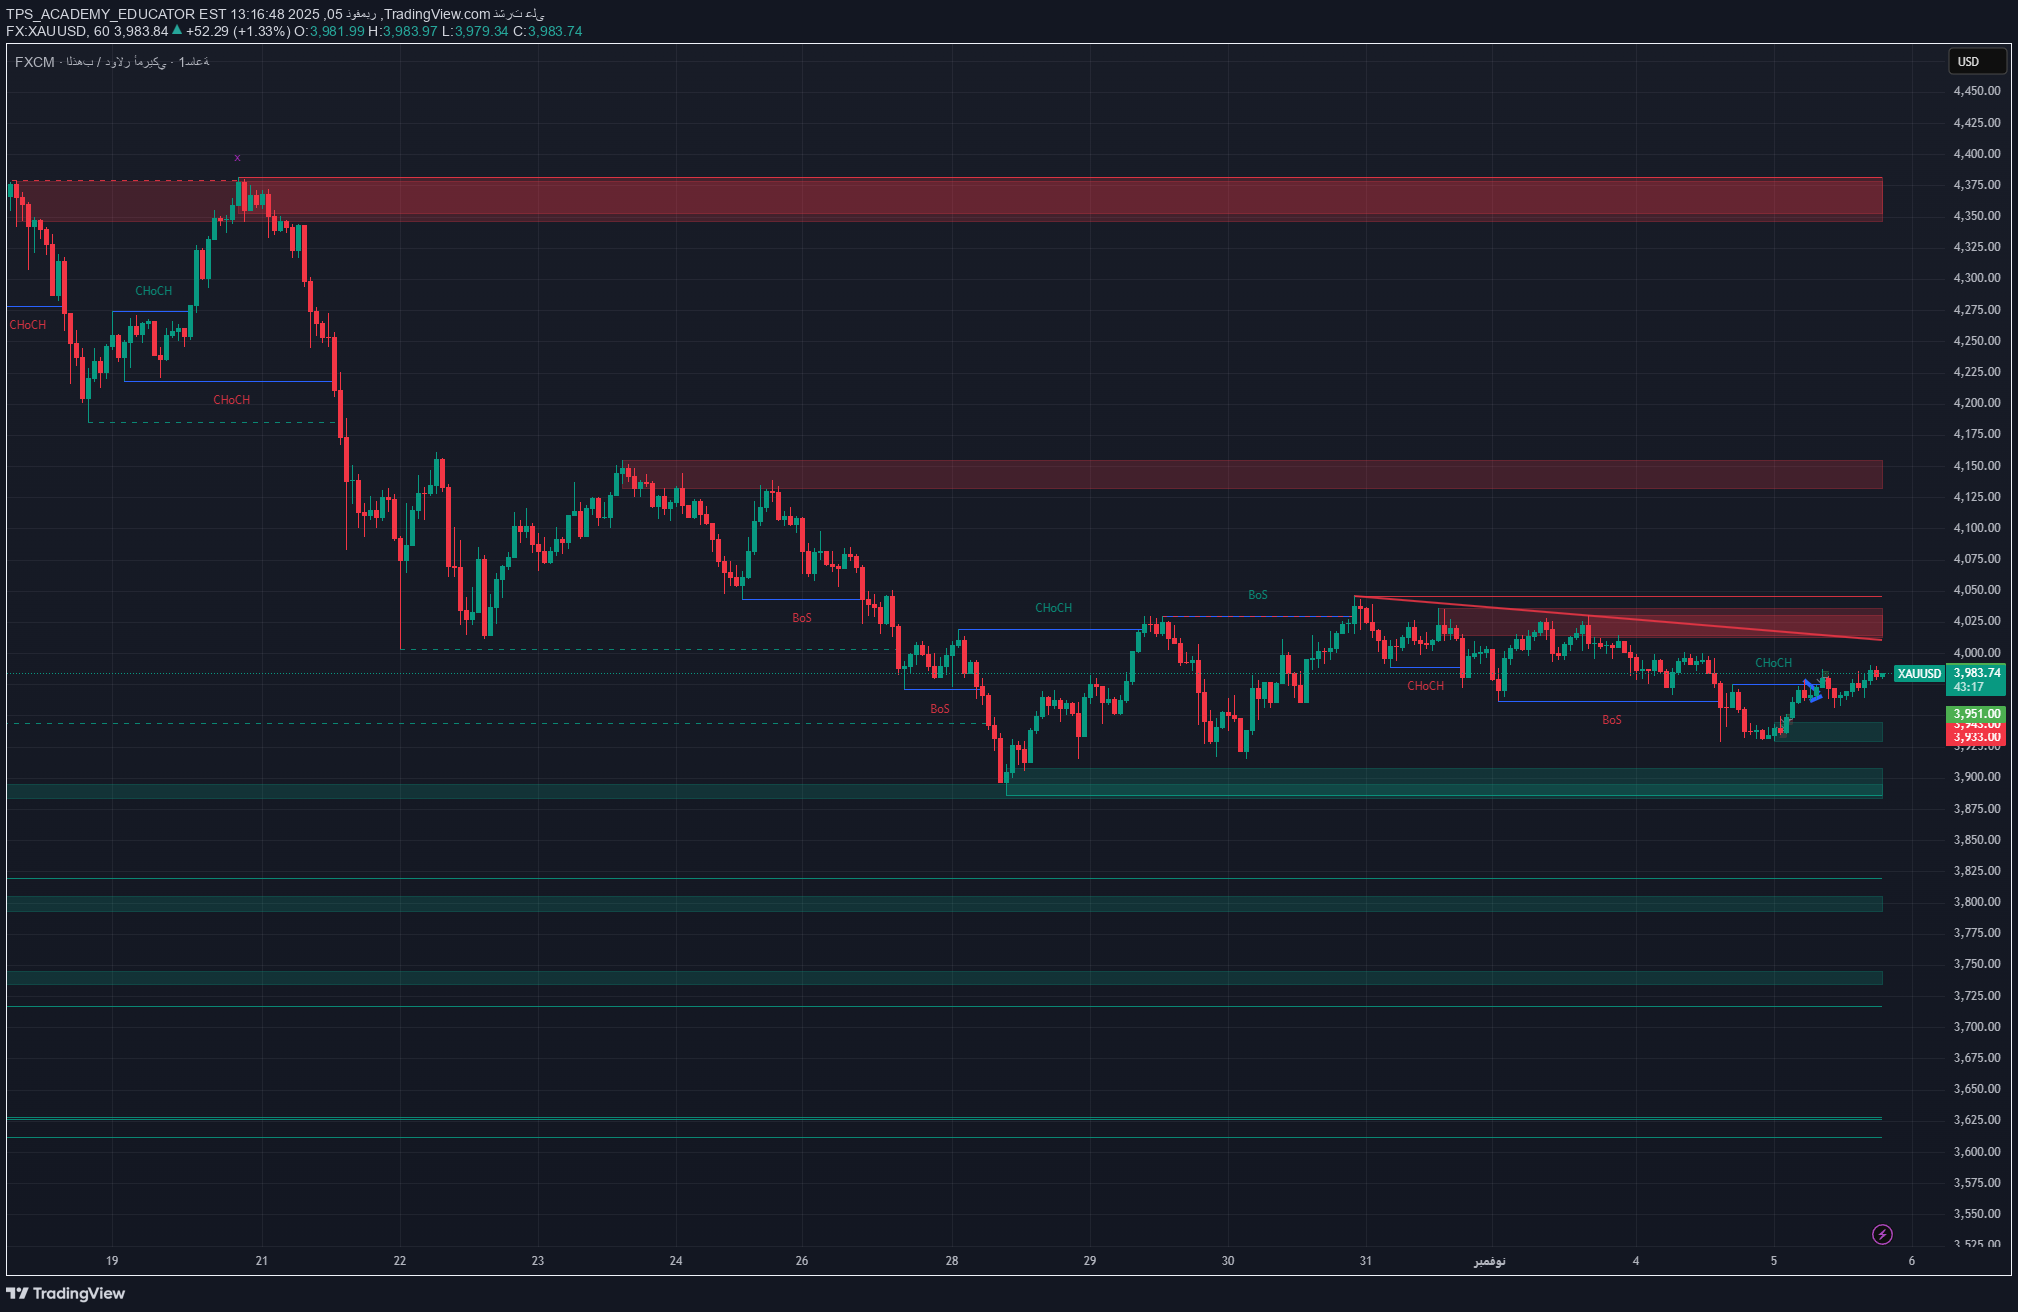
طلاء الذهب (XAU/USD): آیا قیمت در مرز سقوط یا صعود تاریخی گیر کرده است؟
The XAU/USD chart on the hourly time frame shows that the price is moving in an upward corrective range after a strong bearish wave that started from the 4,375 – 4,350 supply zone. Constructive price analysis clearly shows a bullish breakout structure (CHoCH) forming from the recent bottom near 3,875, then a continuation of positive momentum until touching the 4,050-4,070 area, a key supply zone that could represent a strong barrier for buyers. Currently, we notice hesitation in the price movement above the ascending trend line, which indicates the possibility of starting a downward correction if the price does not succeed in penetrating the current resistance with a clear close above 4,070. 📊 Expected scenario: If the price fails to exceed 4,070, it will likely return to test the nearest demand area between 3,950 – 3,920, and the movement may extend towards 3,875 if the bullish structure is broken again. However, if the price succeeds in surpassing the current resistance and holding above it, this will open the way to target 4,130 – 4,175 as the next corrective stage. 🔹 Trading opportunities: Possible sell from resistance: 4,050 – 4,070 Goals: 3,950 – 3,920 Stop loss: above 4,090 📈 The general trend: bearish in the medium term, with a limited upward correction. 💡 Advice for analysts: Watch the price reaction at 4,070 carefully, as the price behavior in this area will determine whether gold is preparing for a new downward wave or a temporary upward breakthrough before completing the general trend.
Disclaimer
Any content and materials included in Sahmeto's website and official communication channels are a compilation of personal opinions and analyses and are not binding. They do not constitute any recommendation for buying, selling, entering or exiting the stock market and cryptocurrency market. Also, all news and analyses included in the website and channels are merely republished information from official and unofficial domestic and foreign sources, and it is obvious that users of the said content are responsible for following up and ensuring the authenticity and accuracy of the materials. Therefore, while disclaiming responsibility, it is declared that the responsibility for any decision-making, action, and potential profit and loss in the capital market and cryptocurrency market lies with the trader.