
System_T
@t_System_T
What symbols does the trader recommend buying?
Purchase History
پیام های تریدر
Filter
Signal Type

System_T
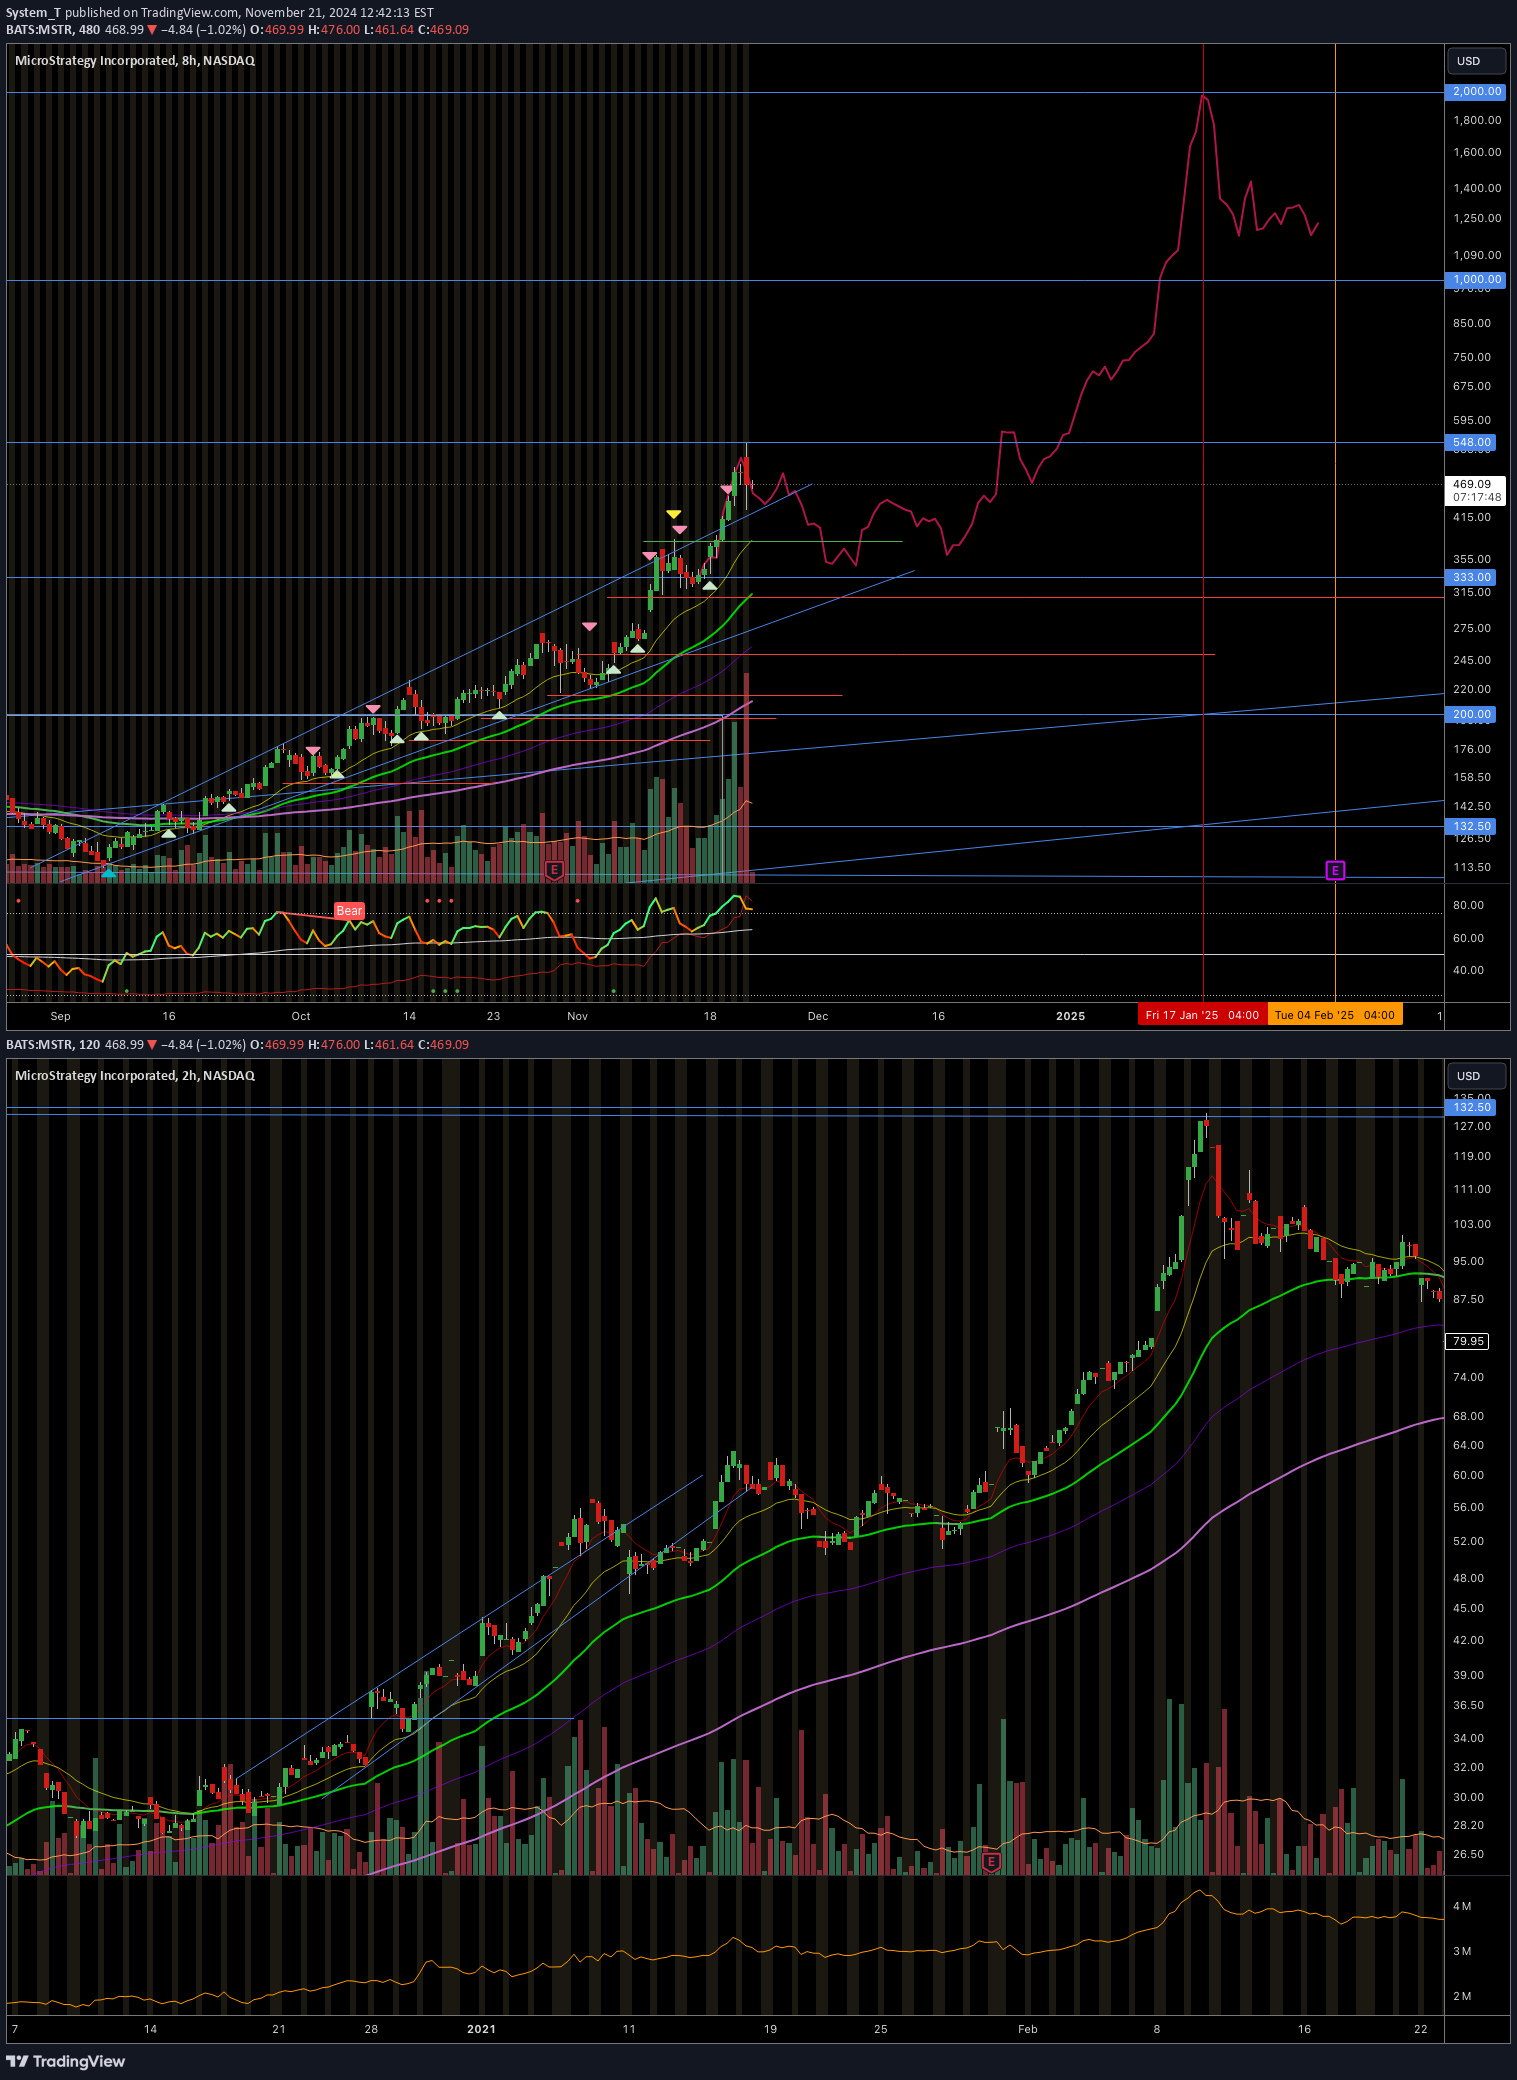
A picture is worth a thousand words. MSTR's price action this year perfectly resembles its price action in 2020, just with a different time frame. This fractal gives us a projection for MSTR that may reach $2K on January 17, 2025.If MSTR holds above $333 for 1 or 2 days, this correction may be done.Invalid

System_T
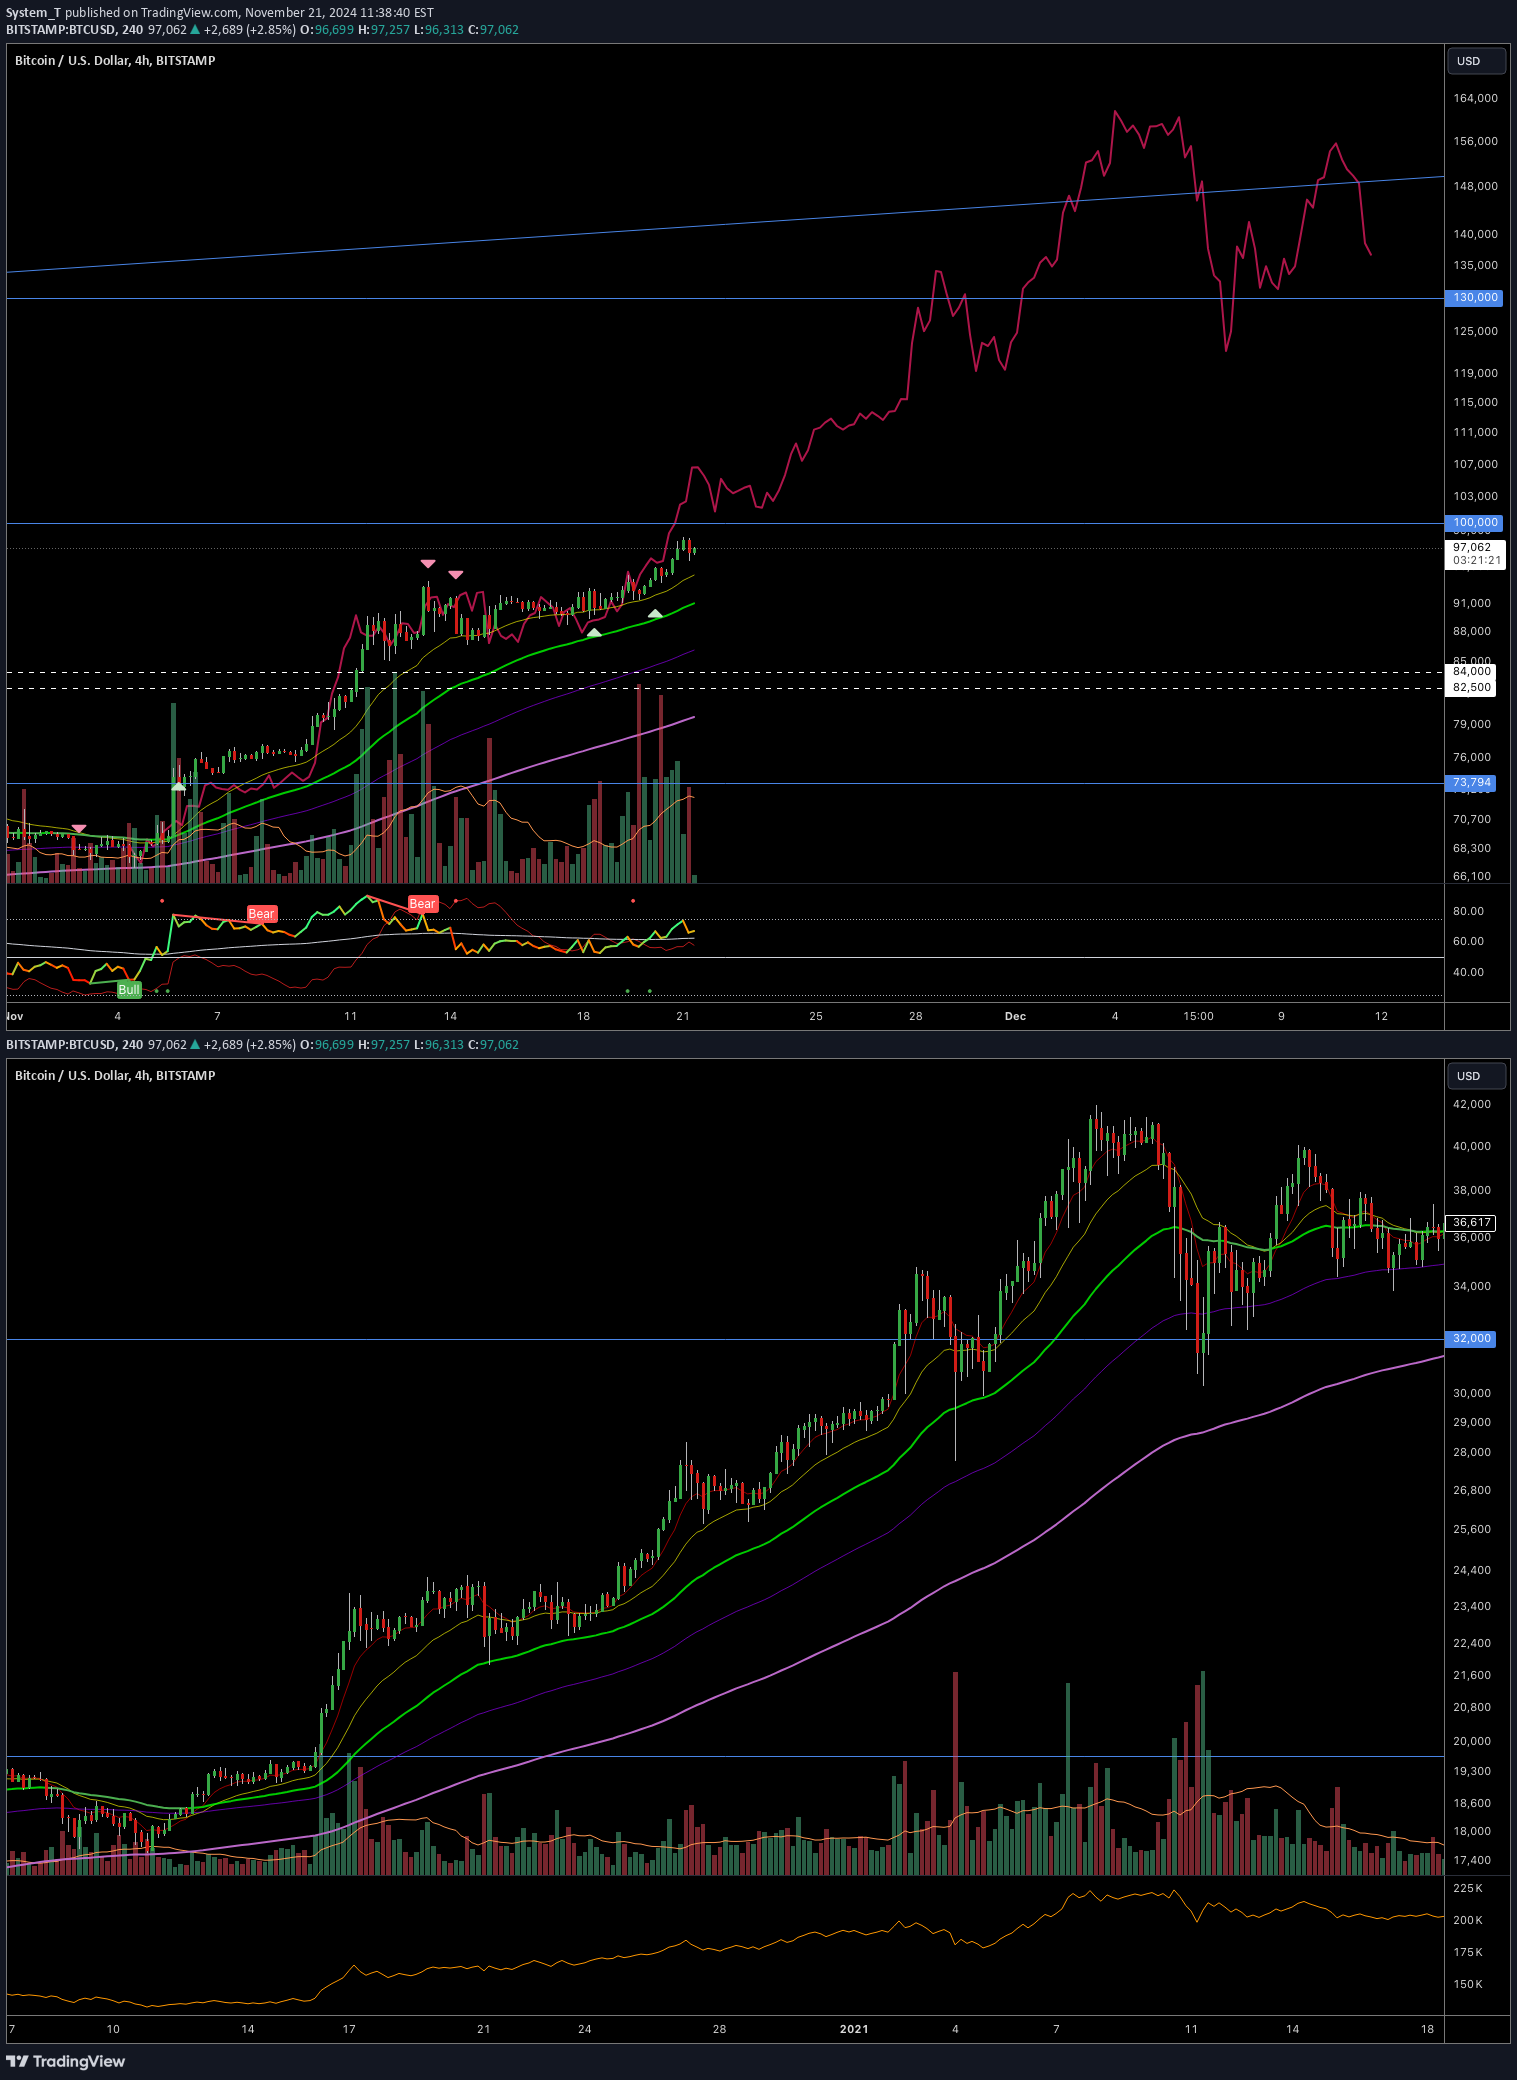
Bitcoin's 4H chart looks almost identical to the price action on Dec 25, 2020. If it keeps following this pattern, Bitcoin will break 100K very soon and go straight to 130K before taking a break.Invalid

System_T
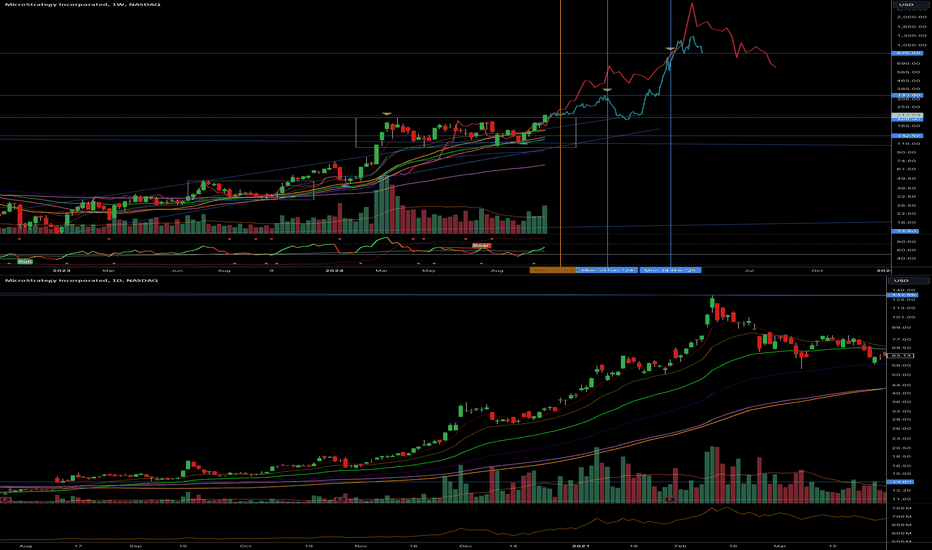
This fractal compares the current price action of MSTR to its price action in 2021, during the previous Bitcoin bull market. This time, it is moving slower, so the time interval was adjusted to 1 week instead of 1 day. The next base consolidation target is around December 2024, with a top expected around April-June 2025.So far, so good! Next targets are $333 and $444.$444 target almost reached. It may go into a correction mode until next month. And then the final leg up!$444 target is still on the table!This thing is crazy! It broke through $444 like a knife through butter. No idea when it will take a break. However, the final target next year is definitely above $1,000.Things are clearer now. This is my latest analysis for the next leg up.This correction bottomed around $333. I expect a few weeks of consolidation around the $333 and $550 range before the next leg up. Next targets are $850, $1050, and $2000. $2000 may be reached by a long wick, not sustainably.

System_T
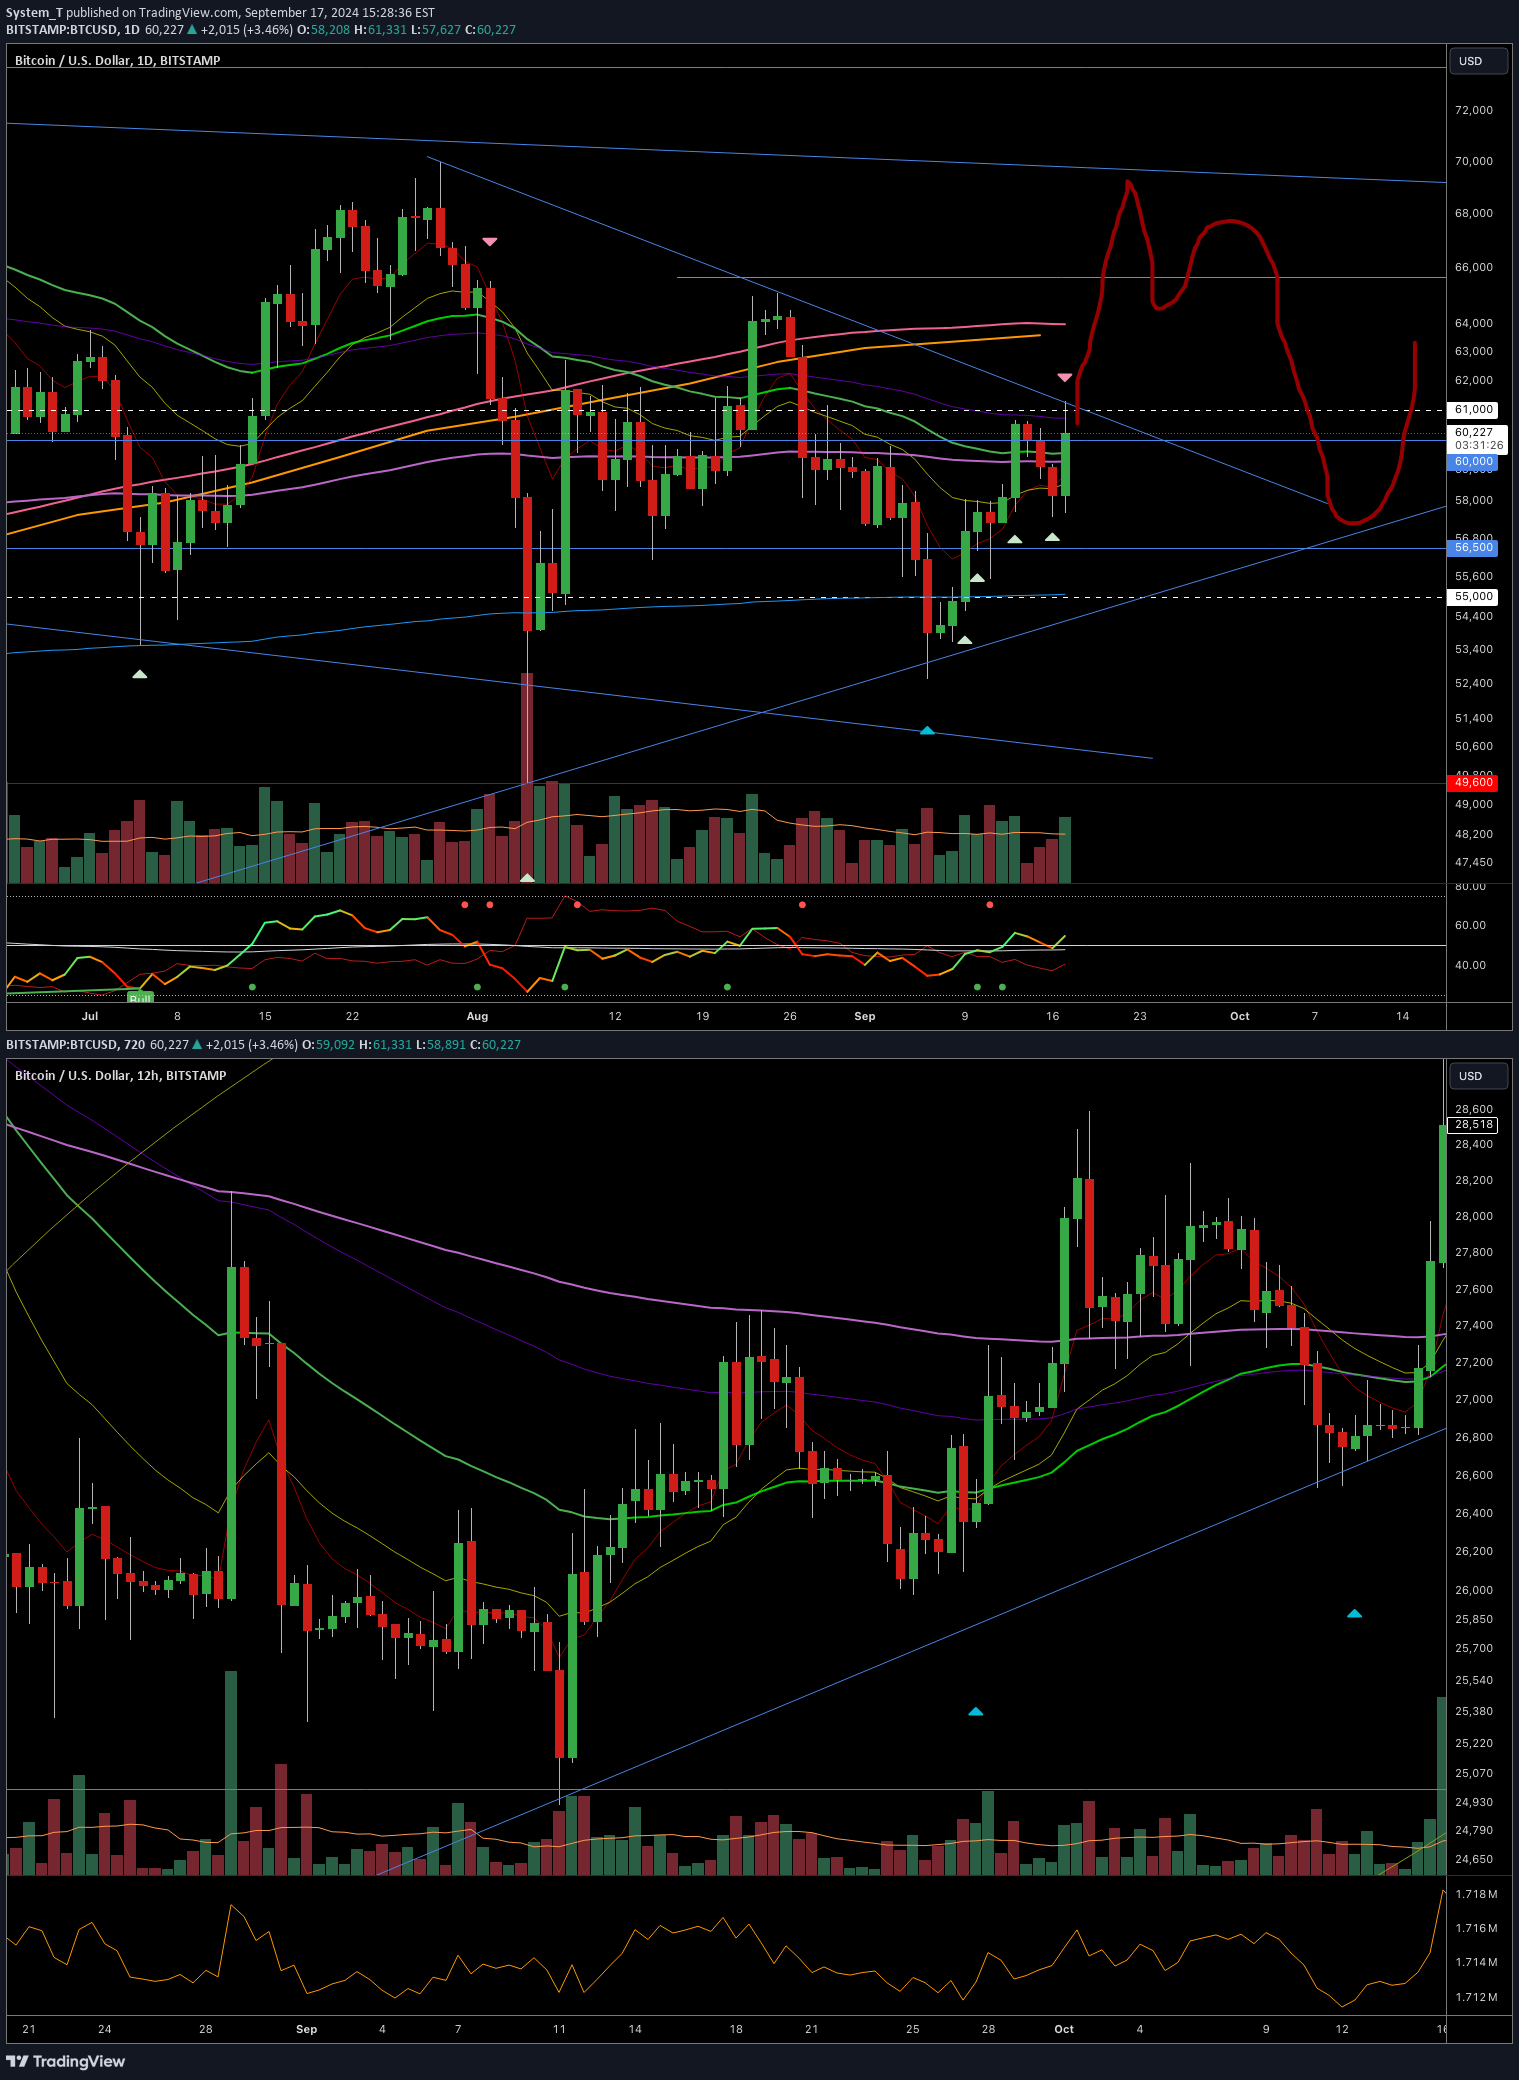
I believe Bitcoin has found its base bottom at 50K. However, it will take a lot of time to develop an uptrend after the 6-month long consolidation. The next price action can be compared with the bottom forming around September 30, 2023. Tomorrow, a FED rate cut could be a catalyst for Bitcoin to surge.This fractal played out beautifully! Closing.

System_T
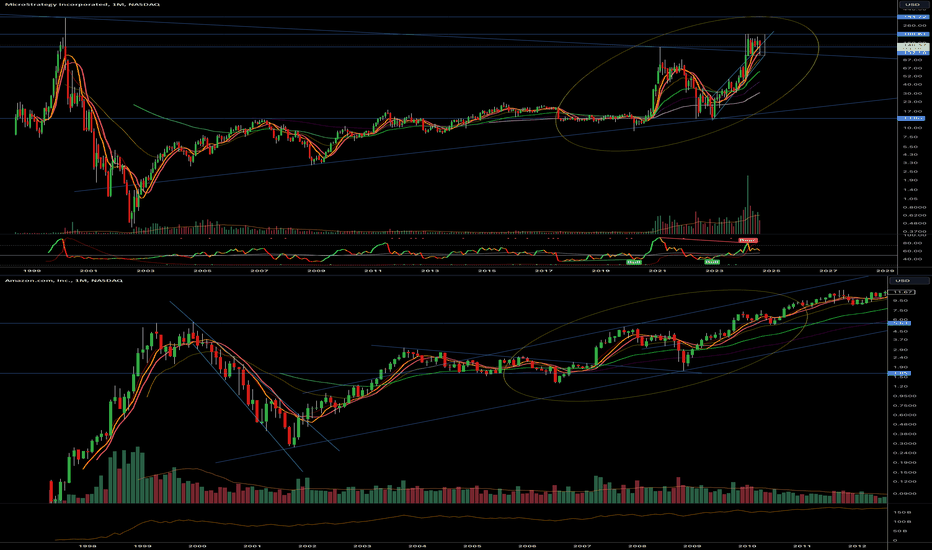
MSTR broke out of long-term resistance, similar to AMZN in 2010. Currently, it’s consolidating above the high and trying to form a base before continuing its upward trend. With the power of Bitcoin, MSTR holders may enjoy a long ride up in the next few months.The last wave of this bull market started! 5x incoming!

System_T
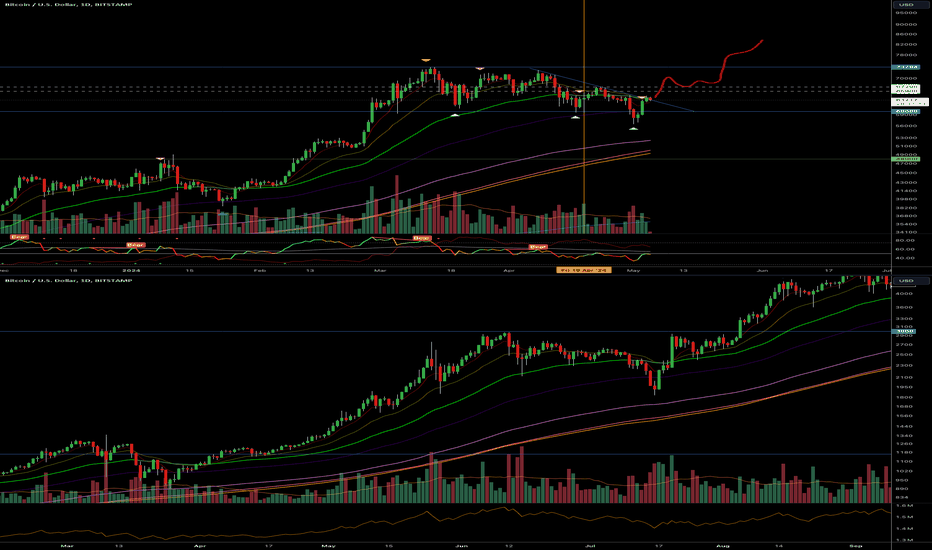
The current price actions of Bitcoin look similar to the bullish fractal in July 2017, suggesting that Bitcoin may reclaim the 50 EMA, hold above it for a few weeks, and continue to rise. Let's see if Bitcoin can close above the 50 EMA next week.Bitcoin could not close above 50 EMA for a week. Thus, this idea is invalid. Closing.

System_T
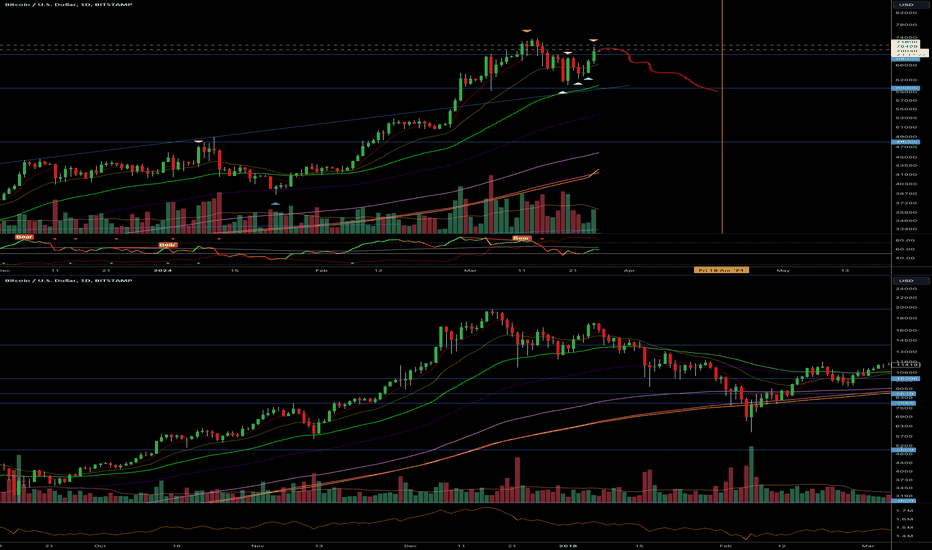
This is another top signal for Bitcoin that occurred in January 2018, similar to the bearish pattern found in July 2019 below. The bounce over the last few days could be just a three-wave ABC retracement pattern back to the Fibonacci 0.7 level. This fractal suggests that Bitcoin will start going down from here until the halving. If it cannot surpass 73K USD in the next few days, the chance of this fractal playing out will increase as traders will treat it as a lower high.Bitcoin was rejected at USD 72K today. If it starts bleeding from here in the next few days, the chance for this fractal to play out will increase.Let's hope Bitcoin does not close below 60K USD, or else it will be big trouble for it this month.Bitcoin will likely continue moving sideways until the halving. The best course of action now is to stay away, wait, and see. The market will likely be very choppy in the coming weeks.If Bitcoin closes below 60K, it will go to 50K.I started to scale in from 57K to 50K area.Every market is very bullish. Bitcoin is no different. Liquidity injected big. Closing this idea.

System_T
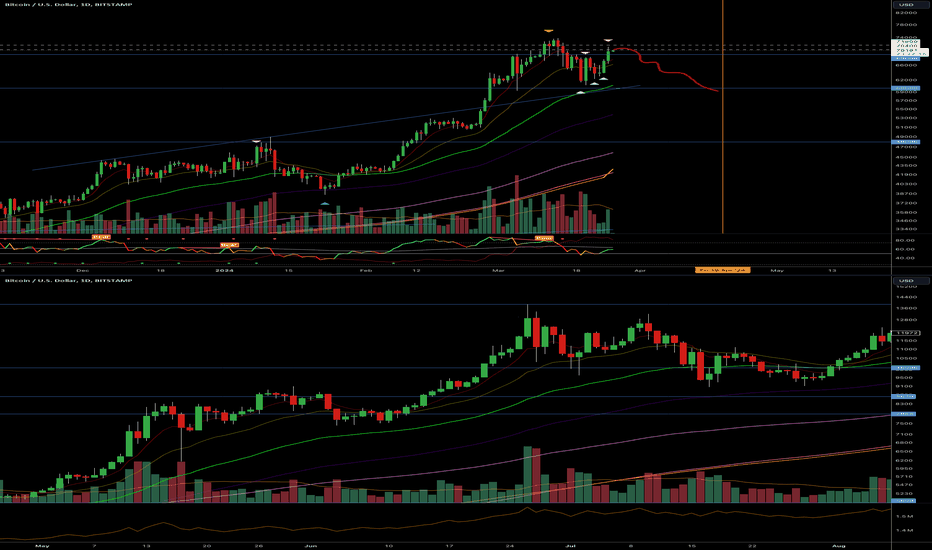
I found another bearish fractal for Bitcoin that occurred in July 2019, suggesting it may start another leg down from here until the halving.I feel the bounce of Bitcoin over the last few days has been too fast, although its volatility remains high, with around a 6% daily fluctuation.The difference with the similar bearish fractal found in November 2021 below is that it will not go above 73K to hunt the stop loss but instead start going down from here. Let's see if the next two days it will close red below SWB:69K again.I will keep you posted!Bitcoin was rejected at USD 72K today. If it starts bleeding from here in the next few days, the chance for this fractal to play out will increase.Bitcoin is following this fractal very closely, which is a bad sign. Let's hope Bitcoin does not close below 60K USD, or else it will be big trouble for it this month.Bitcoin shows strength. It could still go sideways from here until the halving, but this bearish fractal is no longer valid.

System_T
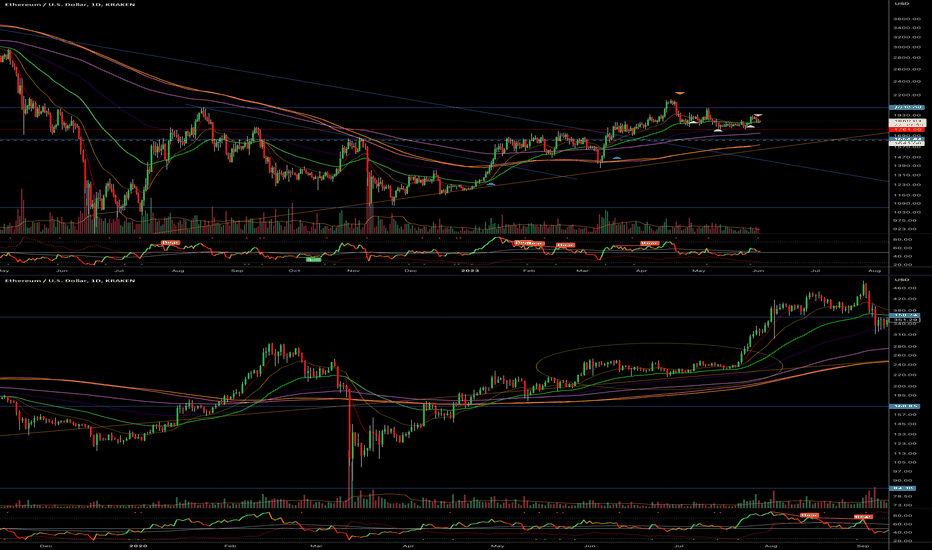
Will ETH surge like Jul 2020? 🔍 Exploring the potential of ETH: Can it replicate the impressive performance witnessed in July 2020? Back then, Ethereum witnessed a significant surge, capturing the attention of traders and investors alike. Now, we delve into the analysis, examining market dynamics, fundamental factors, and technical indicators to gauge if ETH is poised for a similar rally. Stay tuned for valuable insights and projections! 🚀💎 #Ethereum #Crypto #MarketAnalysis"
Disclaimer
Any content and materials included in Sahmeto's website and official communication channels are a compilation of personal opinions and analyses and are not binding. They do not constitute any recommendation for buying, selling, entering or exiting the stock market and cryptocurrency market. Also, all news and analyses included in the website and channels are merely republished information from official and unofficial domestic and foreign sources, and it is obvious that users of the said content are responsible for following up and ensuring the authenticity and accuracy of the materials. Therefore, while disclaiming responsibility, it is declared that the responsibility for any decision-making, action, and potential profit and loss in the capital market and cryptocurrency market lies with the trader.