
SuvashishFx
@t_SuvashishFx

What symbols does the trader recommend buying?
Purchase History
پیام های تریدر
Filter
Gold Price Action
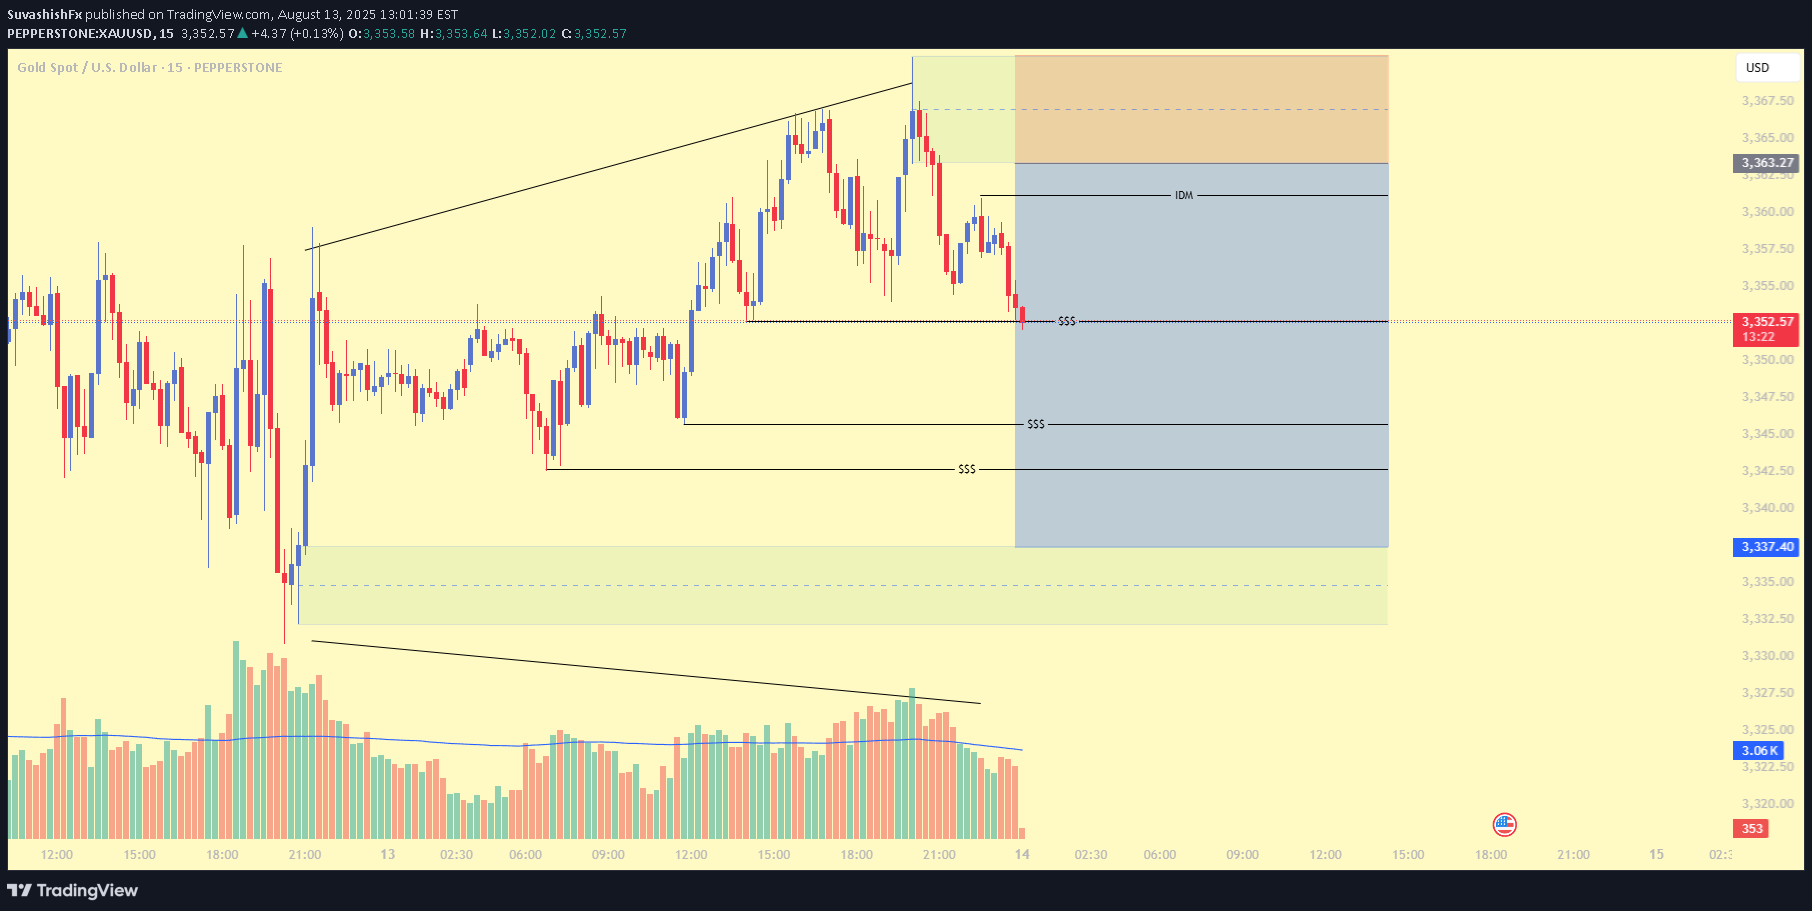
Hello Everyone, Here’s a detailed analysis based on Volume Profile Order Blocks, explaining why I’m considering this zone for a potential short position. Key Reasons: ✅ Inducements Present – I’ve identified potential inducement areas where price may grab liquidity before a reversal. ✅ Fresh Order Block – There’s a fresh OB above that hasn’t been mitigated yet, making it a strong area of interest. ✅ Bearish Divergence – Price is making higher highs while momentum is decreasing, indicating possible weakness in the upward move. ✅ Liquidity Levels Below – Multiple liquidity pools are sitting beneath the current price, which could attract market movement to the downside. If you’d like, you can use my Liquidity and Divergence Tool to analyze the market in this way. Once you understand these concepts, you’ll see a much clearer picture and be able to trade more strategically. Wish you all the best and happy trading!
Gold Price Action
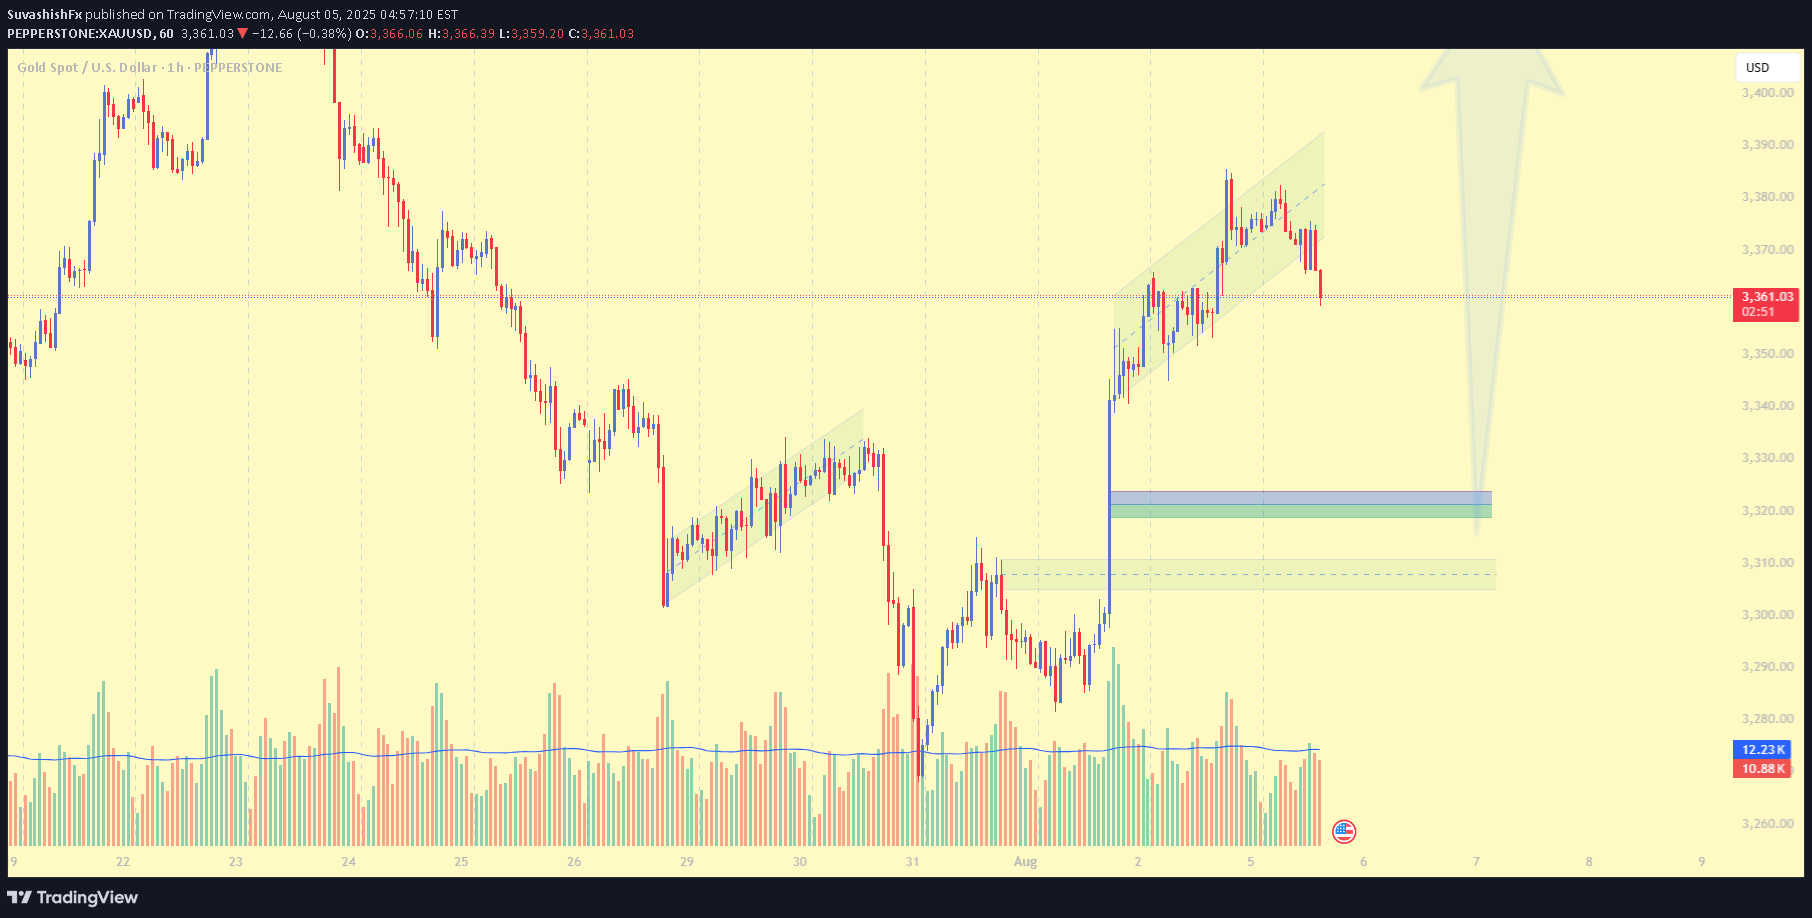
Hello Traders, Hope you're all doing well. Here's the current setup I’m observing — and most importantly, remember to wait for the right moment. As marked, there’s a clear supply zone, and price action is expected to move towards it. For entering a long position, there are a few approaches you can take: Use the 50% level of the Fair Value Gap (FVG) Look for breaker blocks Identify order blocks The method you choose should depend on current market conditions and price movement. Once you spot the setup, aim for the top supply zone — that’s where the price is likely headed. Patience is key to catching the right entry. If you need assistance, my indicator can help pinpoint the move — but if you’re confident in your analysis, you may not need it. Wishing you all the best and happy trading!
Gold Price Action
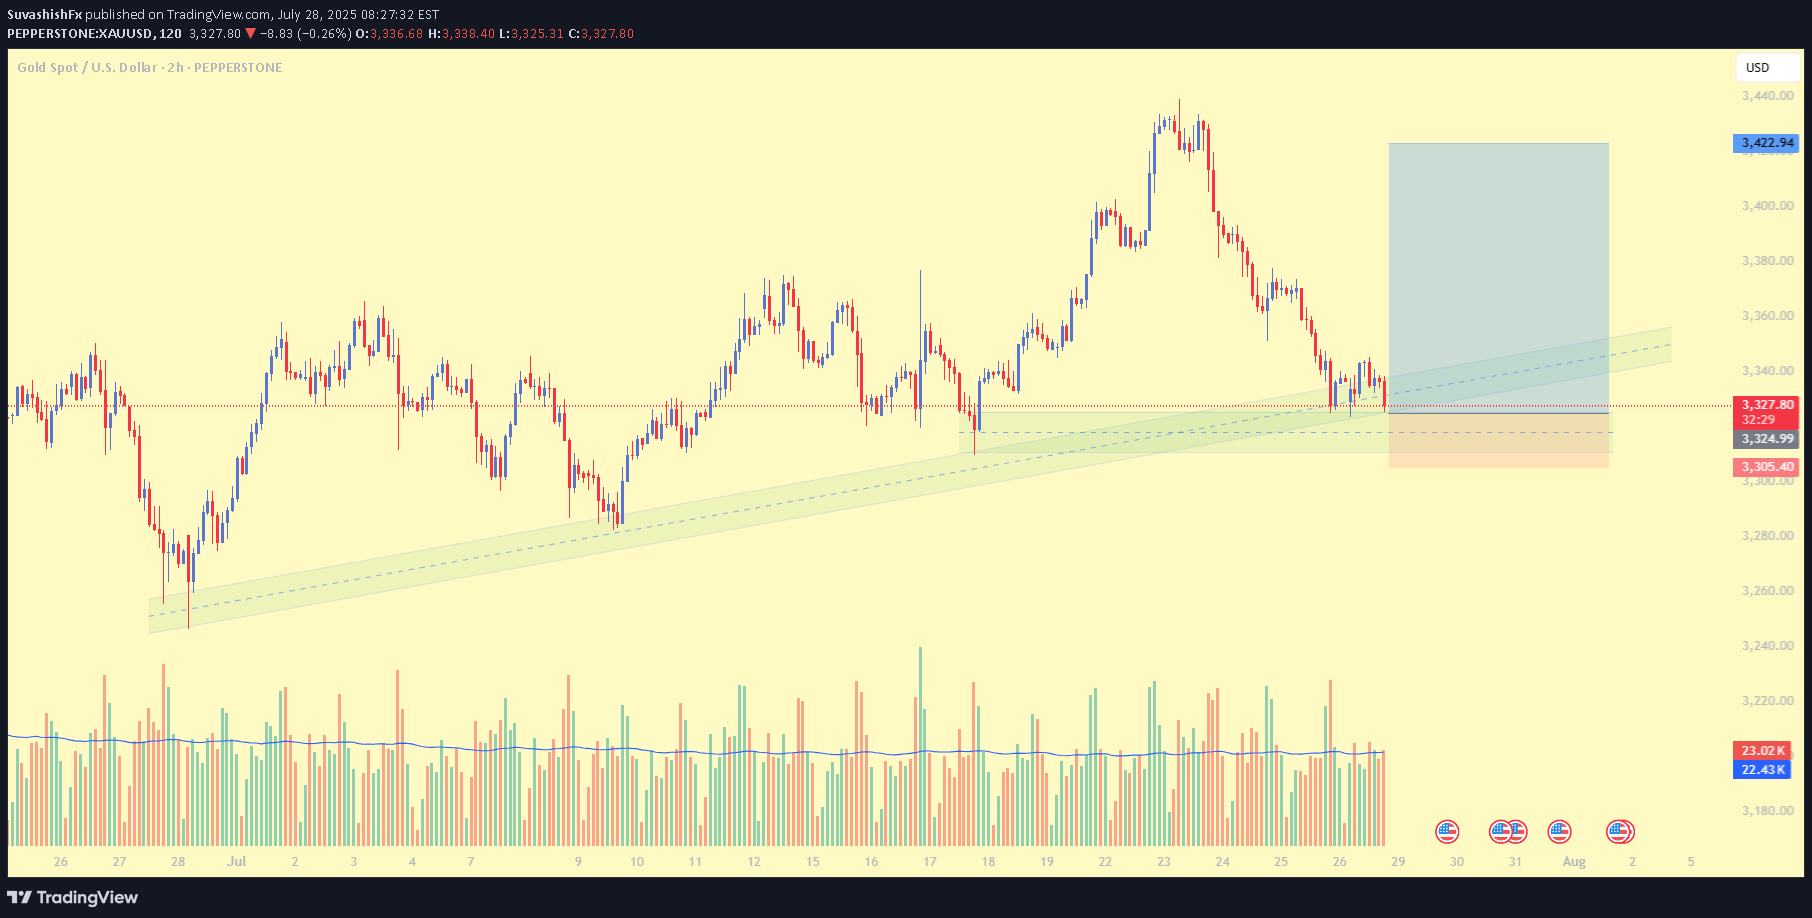
Hello Traders, As you can see, I’ve drawn a trendline based on the 4-hour timeframe. I’ve also marked the demand zone, and if you observe closely, the price has already broken past the inducement levels. This indicates a strong buying opportunity, provided proper risk management is in place. You can aim for up to a 1:5 risk-to-reward ratio, but always remember to manage your risk carefully – the market has no mercy for complacency. Wishing you all the best and happy trading. Thank you!
Gold Price Action
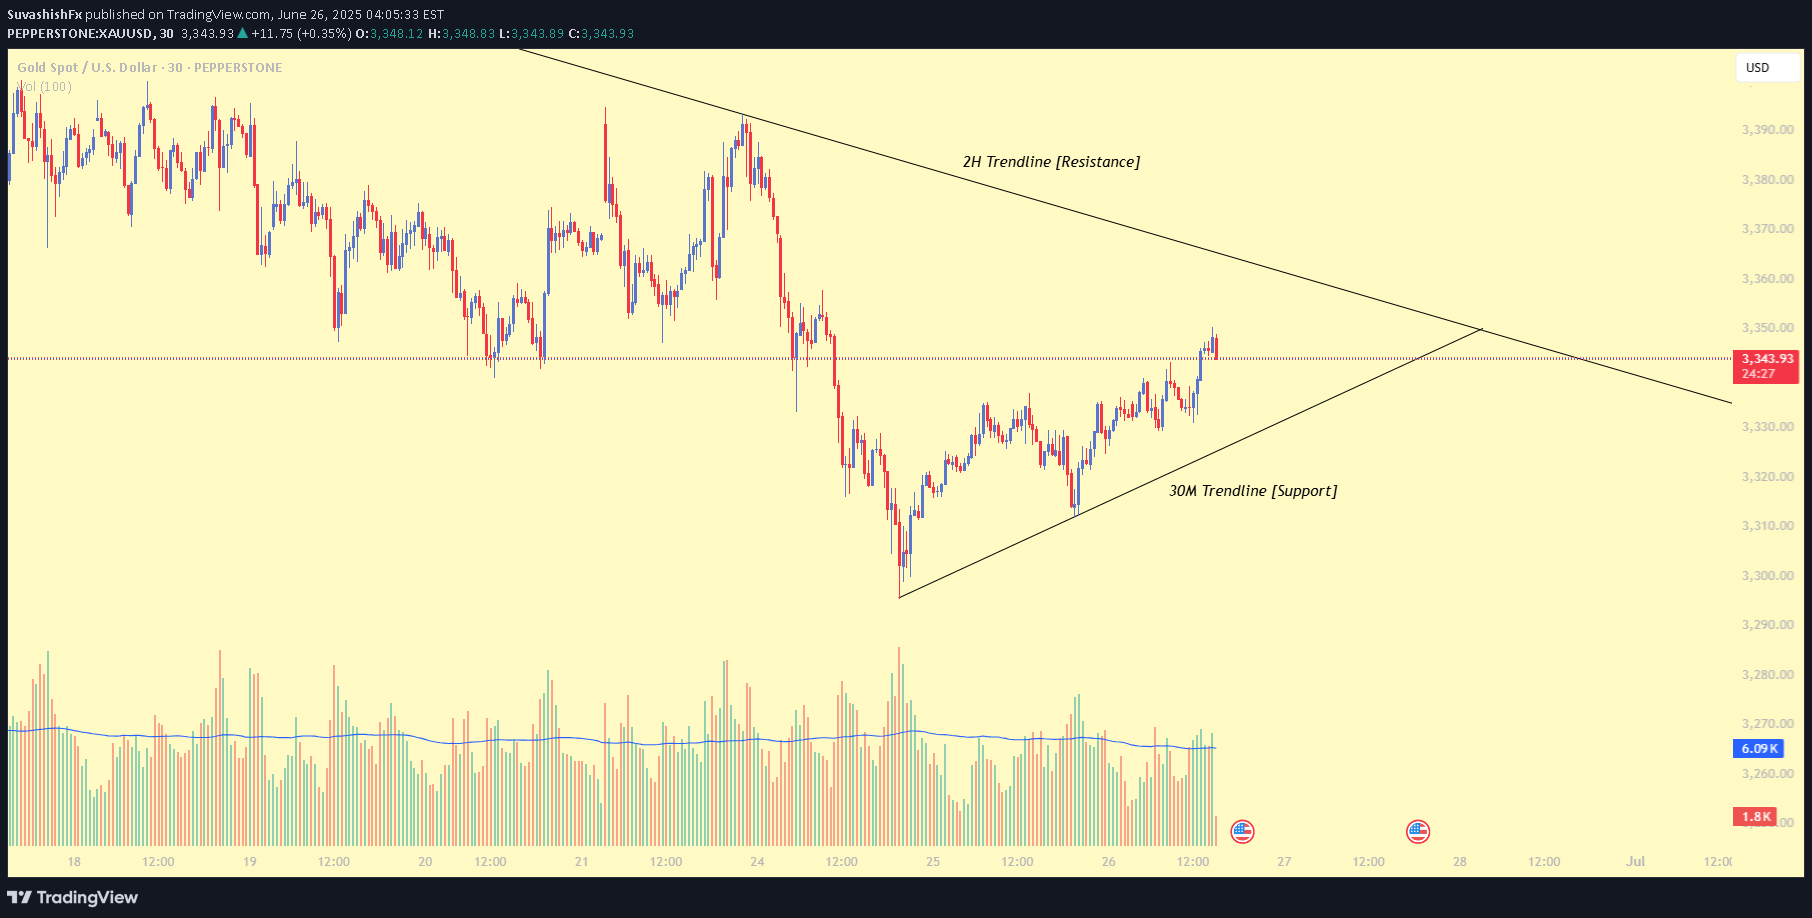
Hello Traders, There’s a potential Buy/Sell opportunity here based on the current price action. I’ve marked trendlines on two different timeframes, which highlight key Support and Resistance levels. I've shared more detailed analysis on my channel, so feel free to check that out for deeper insights. When the price reacts (rejects) from these support or resistance zones, we can look to confirm our entry by analyzing volume—this helps us avoid false signals. For trade management, consider using a Risk-Reward ratio between 1:2 and 1:5, depending on your personal trading style. Most importantly, avoid trading blindly—always wait for confirmation. Wishing you all the best and happy trading! Thank you!
Gold Price Action
Hello Traders, I've observed that gold is currently respecting the trendline in both directions. However, there's still a valid Fair Value Gap (FVG) in play. If the trendline fails to hold, there's a good chance that price could reverse from that FVG zone. So, keep a close watch on both the trendlines and the FVG area, and don’t forget to monitor volume for confirmation. Wishing you all the best — happy trading, and thank you!Closed with 200 Pips.
BTCUSD Price Action
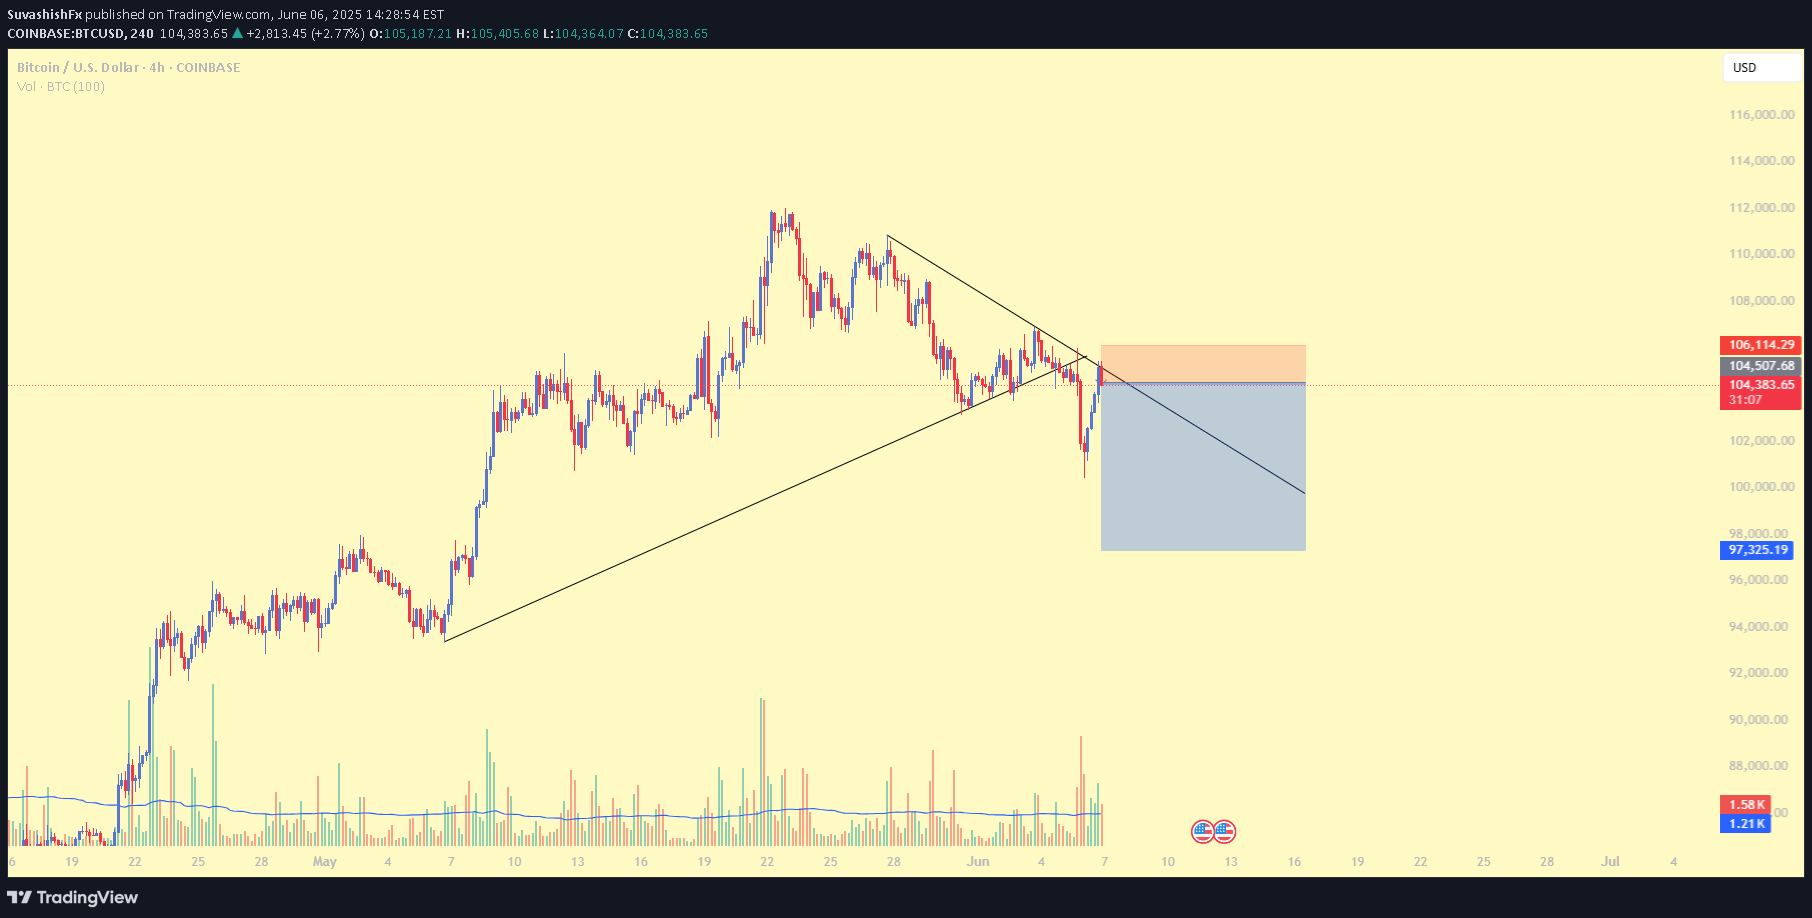
Hello Traders, The market is closing soon, but for those following BTC — here's a setup I’ve spotted. Our previous setup successfully hit the take-profit target. Now, we can clearly see that price initially respected the trendline, followed by a breakout. It has now returned for a retest, again respecting the trendline. This presents a valid short opportunity, provided you apply proper risk management. Also, take a moment to reflect on any trading mistakes you made this week — not with regret, but as a learning experience. That’s how progress happens. Wishing you all the best — happy weekend and good trades ahead!The safest stop-loss level is 106915 — but make sure it aligns with your risk tolerance.
Gold Price Action
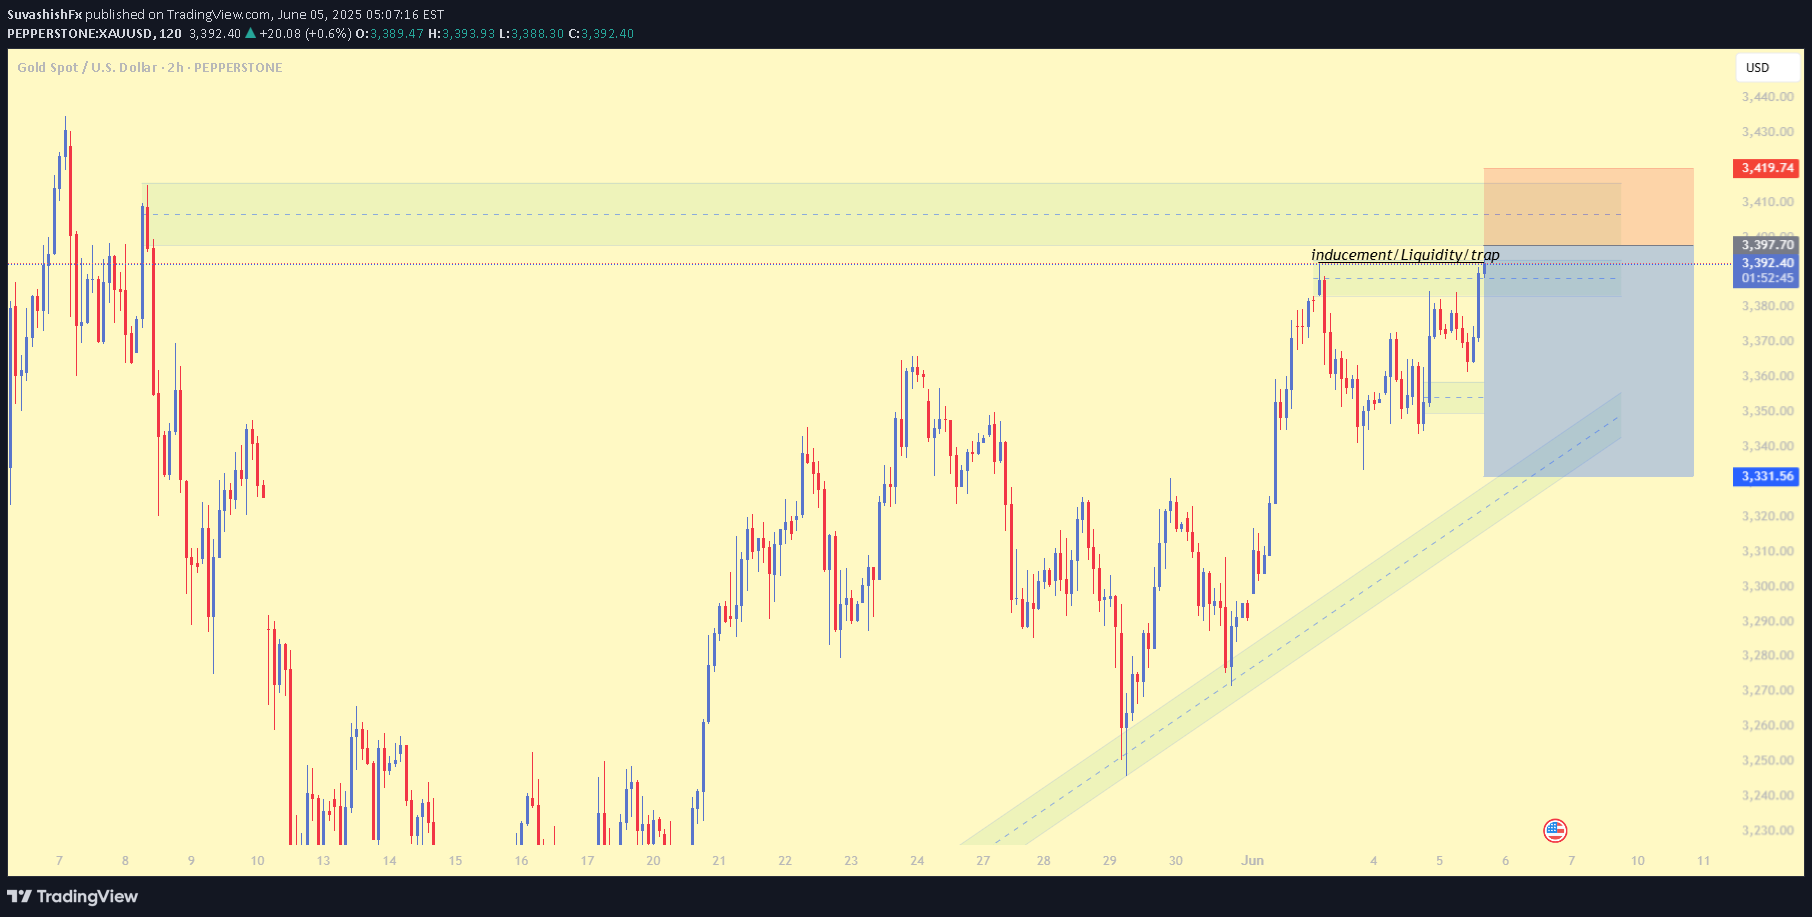
Hello traders, hope you're all doing well! Here's a straightforward setup that could yield 100–200 pips with ease. Price has entered the inducement or "trap" area, but the true sell zone lies just above. Look to enter short positions from that higher level and aim to capture some solid pips.
Gold Price Action
Hello everyone, As you can see, I've marked a fresh Supply Zone along with a Volume observation. Notice how price is rising while volume is falling — this typically indicates a lack of buying interest or that buyers are stepping back. From here, we could see two possible scenarios: Price rejects the supply zone and begins to drop Price breaks above the zone, signaling a potential continuation to the upside ⚠️ Don't forget: CPI news is scheduled for today, so be extra cautious. Make sure you manage your risk, trade smart, and stay focused. Wishing you all the best — happy trading! 📊💼
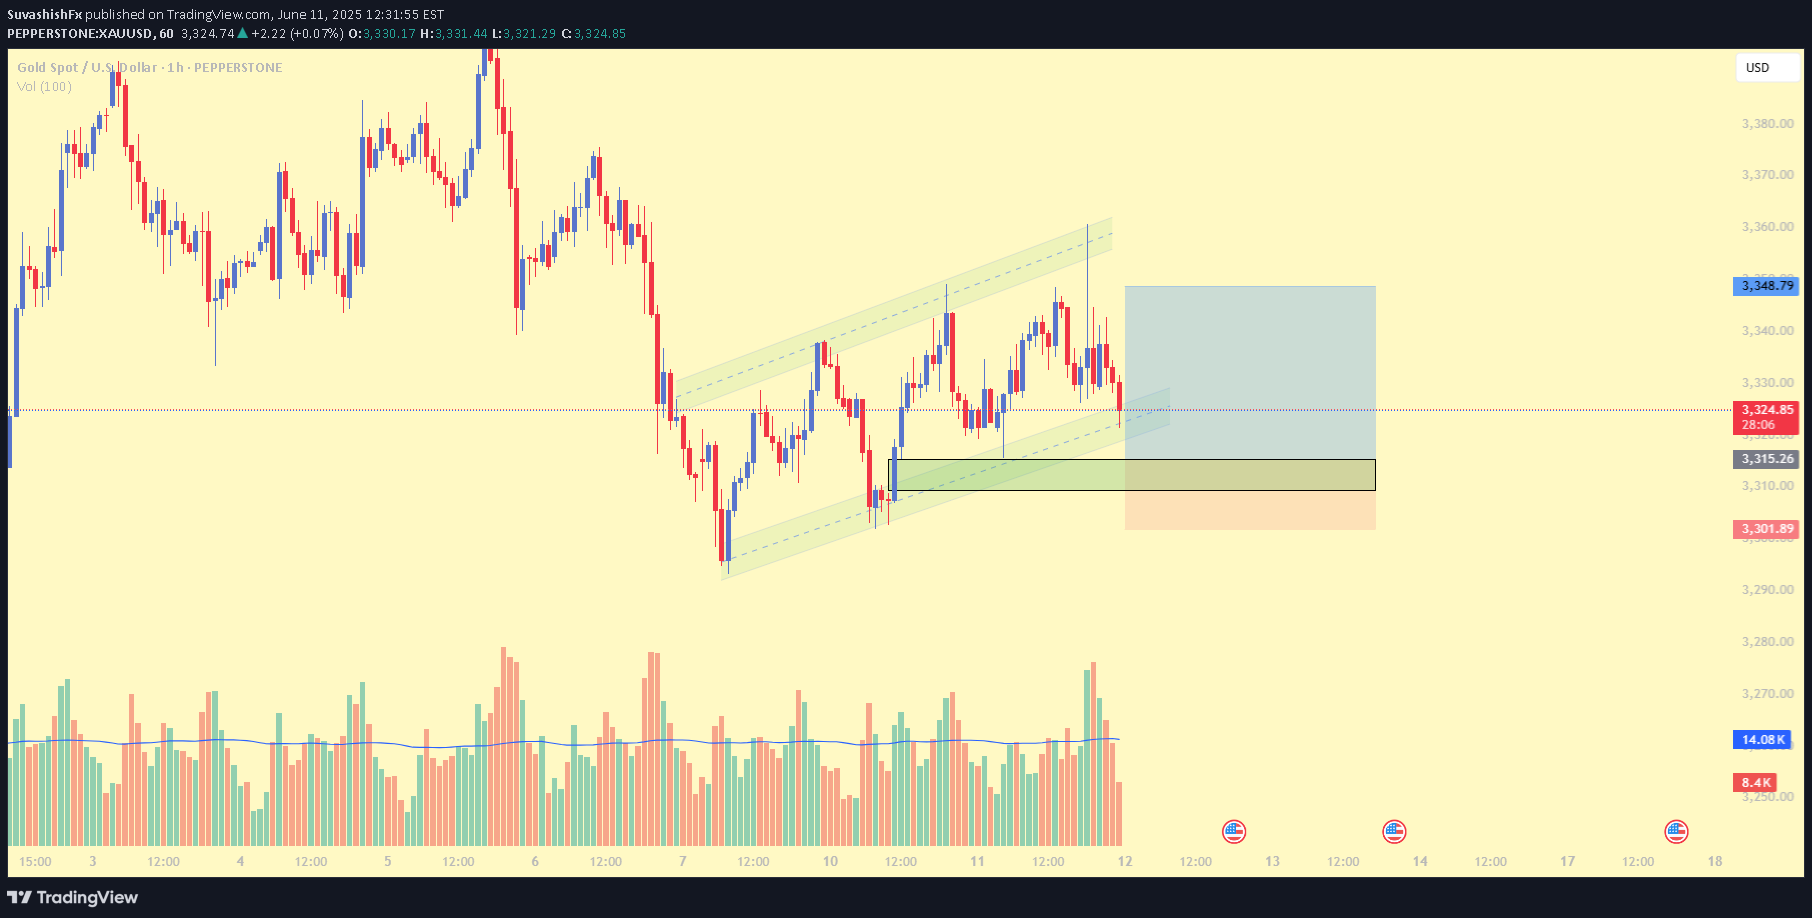
Gold Price Action (TRAP)
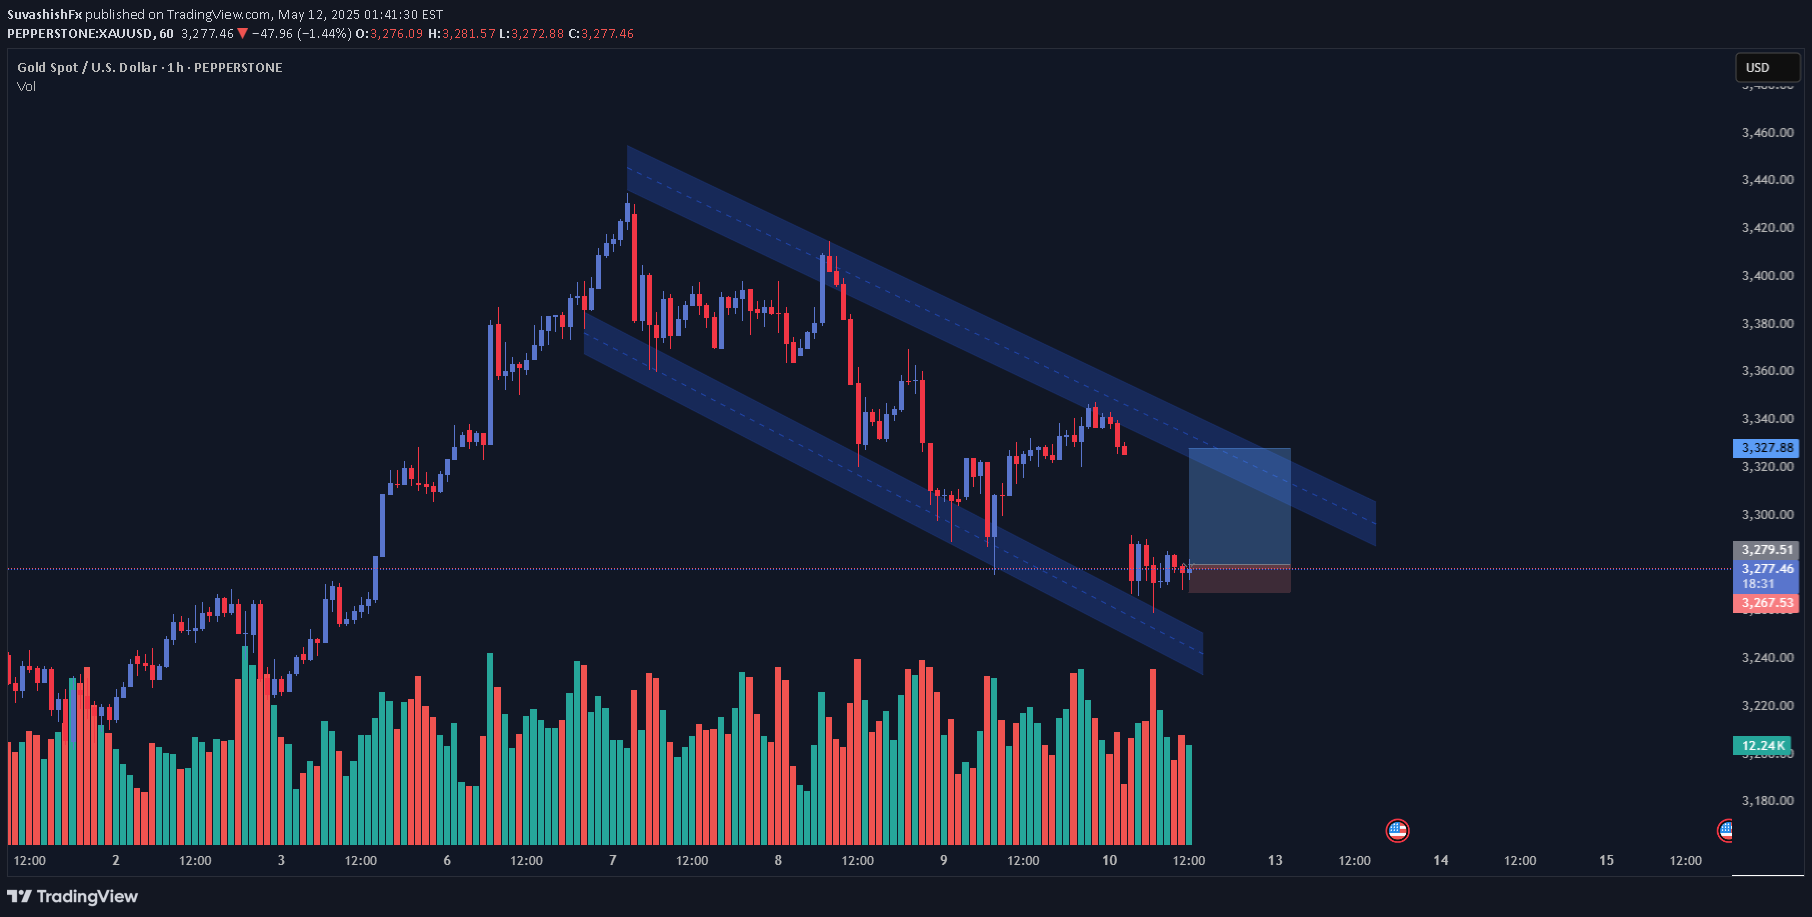
Gold has been respecting a clear descending channel on the 1H timeframe. After a strong bullish impulse, price has been consolidating within this structured decline, showing lower highs and lower lows. But something interesting is happening now... 🔍 Current Observations: Price remains within the lower boundary of the descending channel — showing signs of compression. Volume spike detected near recent lows while candles remain relatively small in range. This is a classic “Volume > Price” divergence, often associated with smart money absorption or hidden accumulation. 💡 What This May Mean: Despite the bearish structure: The increase in volume without new strong lows could indicate that institutional players (smart money) are absorbing sell orders from retail traders. These setups can often lead to a sharp upward breakout, especially if the price closes above the channel midline or recent swing high. 📌 What to Watch: A confirmed break above the channel (preferably with strong volume) would validate a potential reversal. Support remains fragile around the lower boundary. Failure to hold may trigger a final flush or fake-out before reversal. 🔔 Strategy Ideas: ⚠️ Don't jump in early — wait for a clean breakout candle with follow-through. ✅ Look for confirmation like: Bullish engulfing at key support Volume spike + breakout of last 1–2 candle highs Break of descending trendline with a close 🧠 Final Thought: This may be a smart money trap setup — where institutions accumulate just before the trend turns. Keep your eyes on volume + structure for the clearest signals.
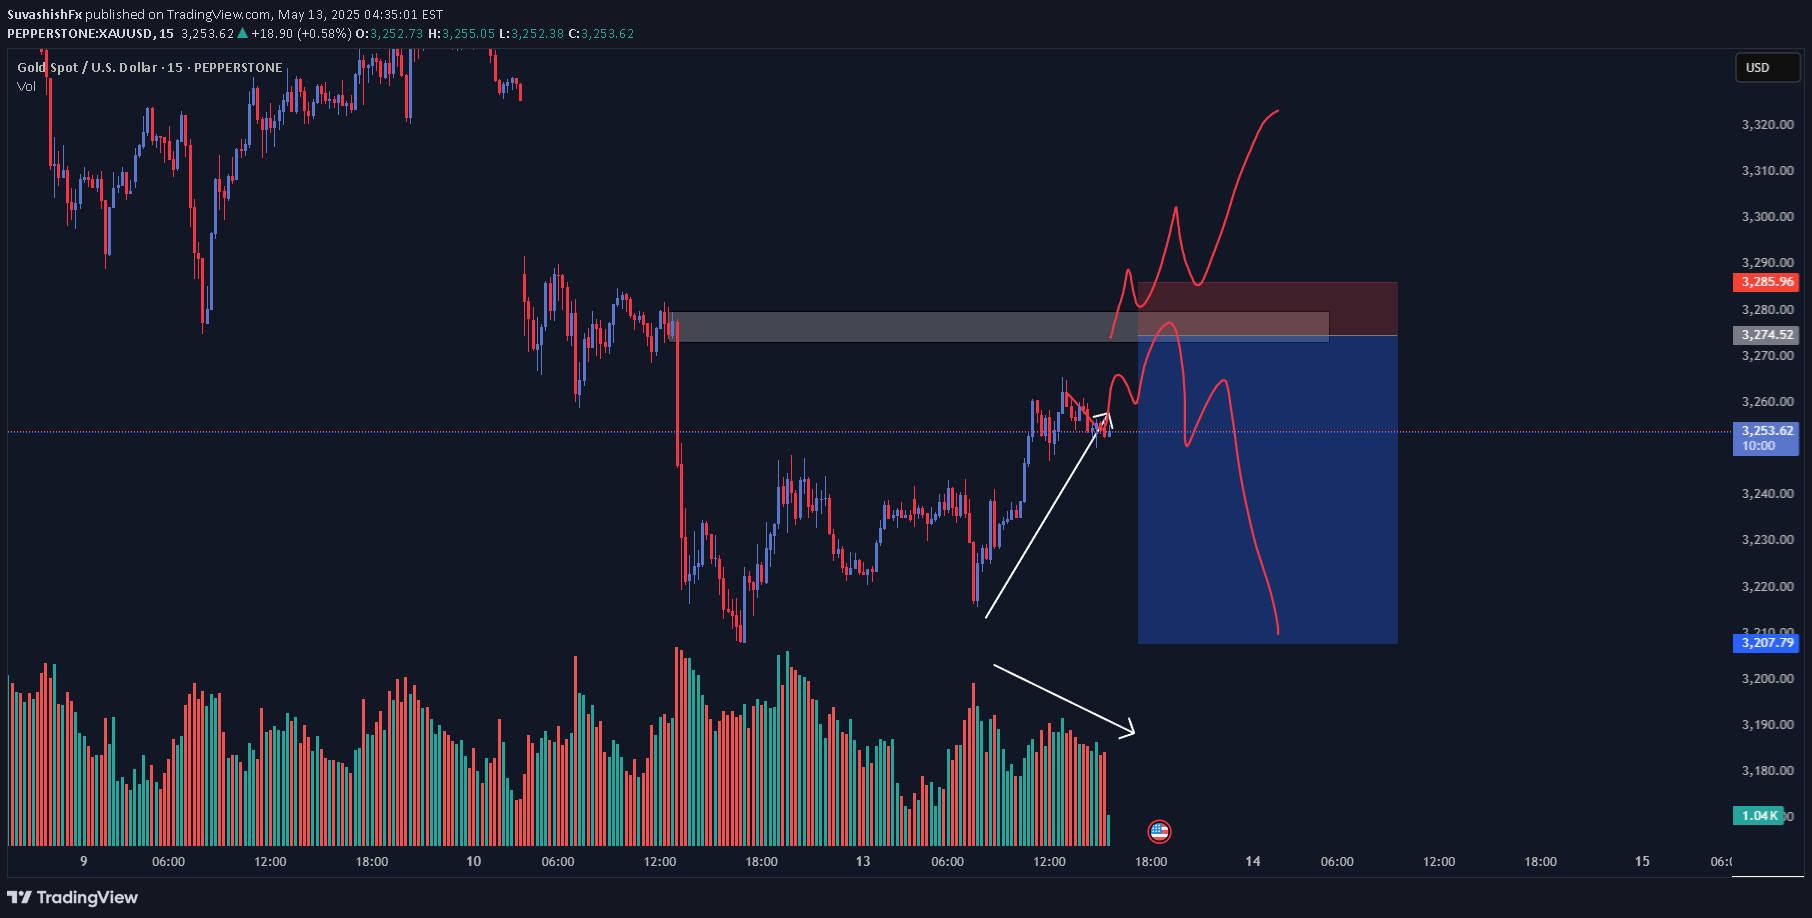
Gold Price Action

Hello traders! This is almost same setup or pattern as BTCUSD https://www.tradingview.com/chart/BTCUSD/I1L2nF7s-BTCUSD-Price-Action/ If you look closely at the left side of the chart, you’ll notice multiple rejections from the same zone — forming a head-and-shoulders-style distribution. This area has now become a strong supply zone. 📌 What to Expect: This is a high-probability short setup. If price taps into the supply zone again, it could trigger a strong move down, especially with liquidity already swept.
Disclaimer
Any content and materials included in Sahmeto's website and official communication channels are a compilation of personal opinions and analyses and are not binding. They do not constitute any recommendation for buying, selling, entering or exiting the stock market and cryptocurrency market. Also, all news and analyses included in the website and channels are merely republished information from official and unofficial domestic and foreign sources, and it is obvious that users of the said content are responsible for following up and ensuring the authenticity and accuracy of the materials. Therefore, while disclaiming responsibility, it is declared that the responsibility for any decision-making, action, and potential profit and loss in the capital market and cryptocurrency market lies with the trader.