
Smart_Scalping_OSM
@t_Smart_Scalping_OSM

What symbols does the trader recommend buying?
Purchase History
پیام های تریدر
Filter
تحليل شارت عملة cfx
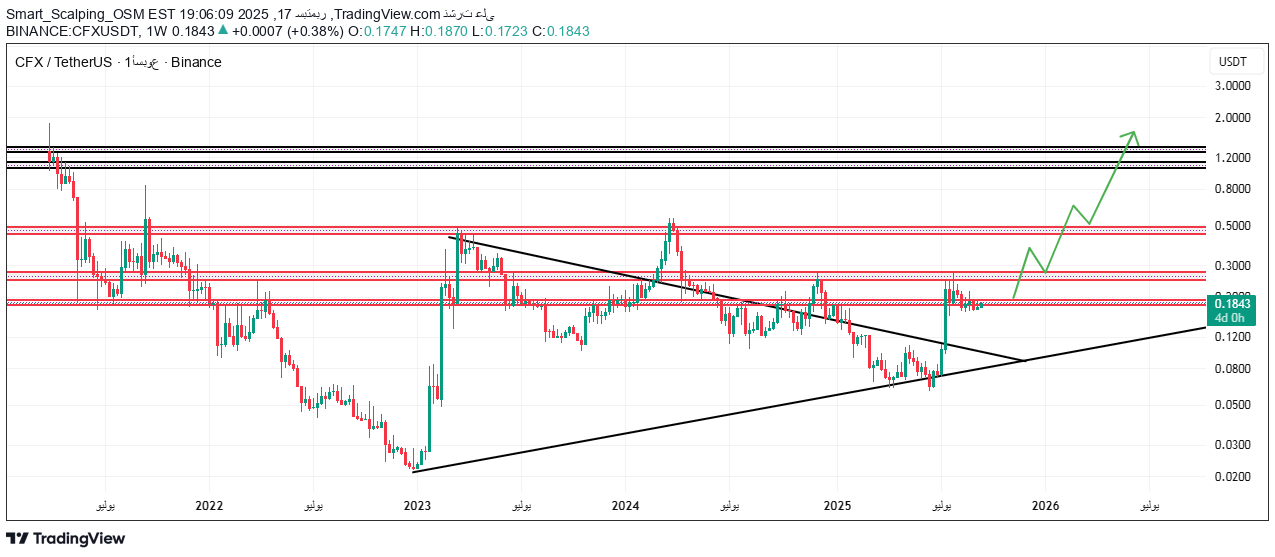
The current situation: Current price: $ 0.1841 The currency in the Triangle Pattern Since 2022 Recently broken the Trend Line - positive signal 📈 The first possibility: the rising scenario 🟢 (green arrow) After breaking the triangle style up: The first goal: $ 0.3000 The second goal: $ 0.5000 The third goal: $ 0.8000 The maximum goal: $ 1.2,000 (historical resistance level) Important points: Triangle style: a positive composition usually explodes up Breaking the trend line: The lining of the resistance is successfully broken Current support area: About $ 0.1200 Fracture confirmation level: $ 0.3000 Positive indicators: ✅ Break the long -term descending trend ✅ Gradually forming the bottoms ✅ Getting pattern for a long time (3 years) ✅ Trading volume shows increasing attention Recommendation: The currency looks at the beginning of a strong upward wave after a long assembly period. The greatest possibility is the rise towards the mentioned goals, especially with the breakdown of the triangle style and the downward trend line. The appropriate entry level: the current region or at any decline of about $ 0.1500
تحليل شارت عملة wld
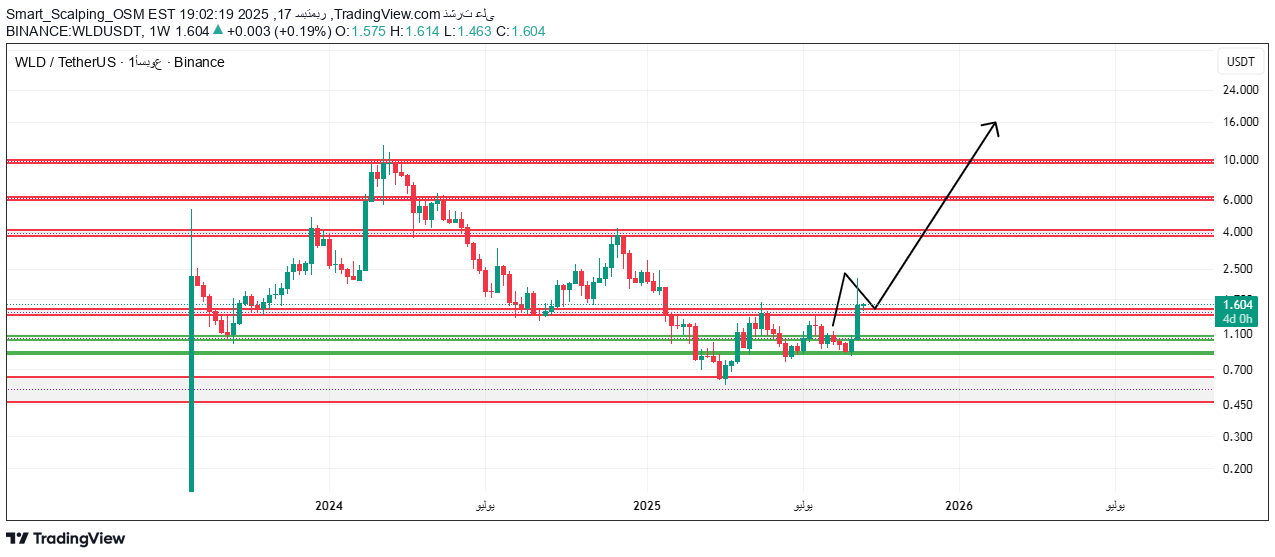
Based on a WLD/USDT, a simplified analysis: The current situation: Current price: $ 1.601 The currency trades in a strong support area between $ 1.100 - $ 1.463 There is a clear stability in this region The first possibility: the rising scenario 🟢 If the price breaks the resistance level of $ 1.463 strongly: The first goal: $ 2.500 The second goal: $ 4,000 The third goal: $ 6,000 The maximum goal: $ 10,000 (historical summit) The second possibility: the landing scenario 🔴 If the price breaks the support level of $ 1.100 down: The first goal: $ 0.700 The possibility of decline to lower levels Important indicators: Critical Support area: $ 1.100 - $ 1.463 Important fracture level: $ 1.463 to ascend Trading style: Bottom formation composition The general trend: accumulation in the lower area Recommendation: Waiting for a clear break of one of the aforementioned levels with a strong trading volume to confirm the direction. The current region is an important decision area for the currency
تحليل شارت عملة portal
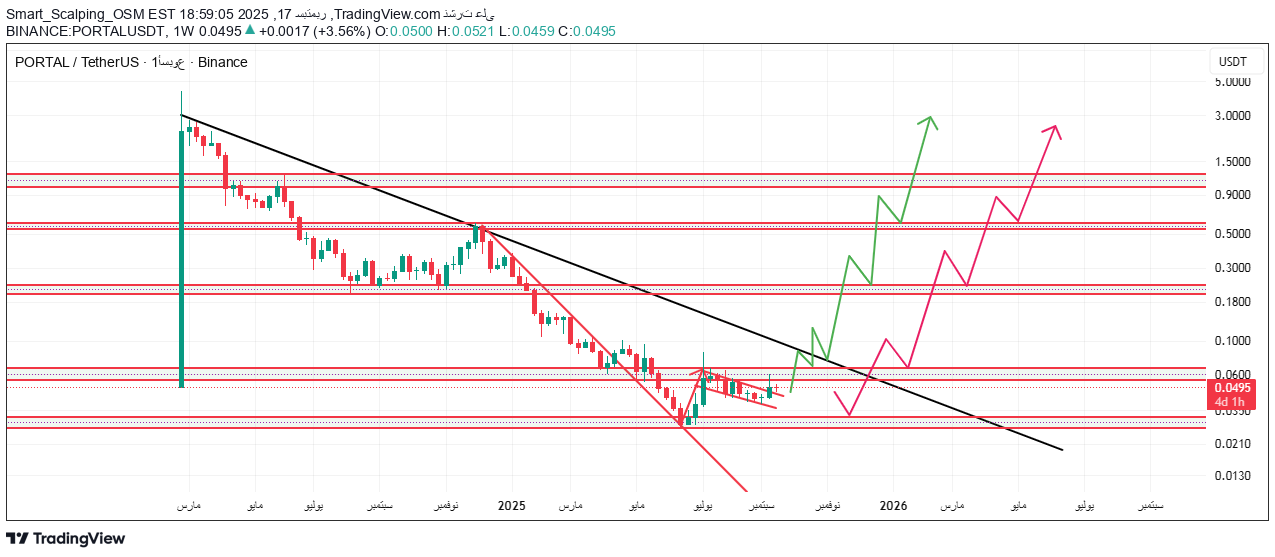
The first possibility: the rising trend (green arrow) The price is currently moving around the strong support area at $ 0.0600 If the apostasy is from this region, we expect to rise towards the following resistance levels: The first goal: $ 0.1800 The second goal: $ 0.3000 The third goal: $ 0.5600 The second possibility: the downward trend (red arrow) If the price is broken the current support area of $ 0.0600 strongly We expect a decline towards the following levels: $ 0.0350 (historical support zone) Then lower levels around $ 0.0200 Important points: The price in a critical area at $ 0.0600 Breaking or reversing from this level will determine the next direction The presence of a long -term descending trend (black line) needs to be broken to ascend Trading volume will be an important indicator to confirm the direction Recommendation: Waiting for a clear fracture of $ 0.0600 or a strong bounce from it before making any investment decision
تحليل شارت عملة one
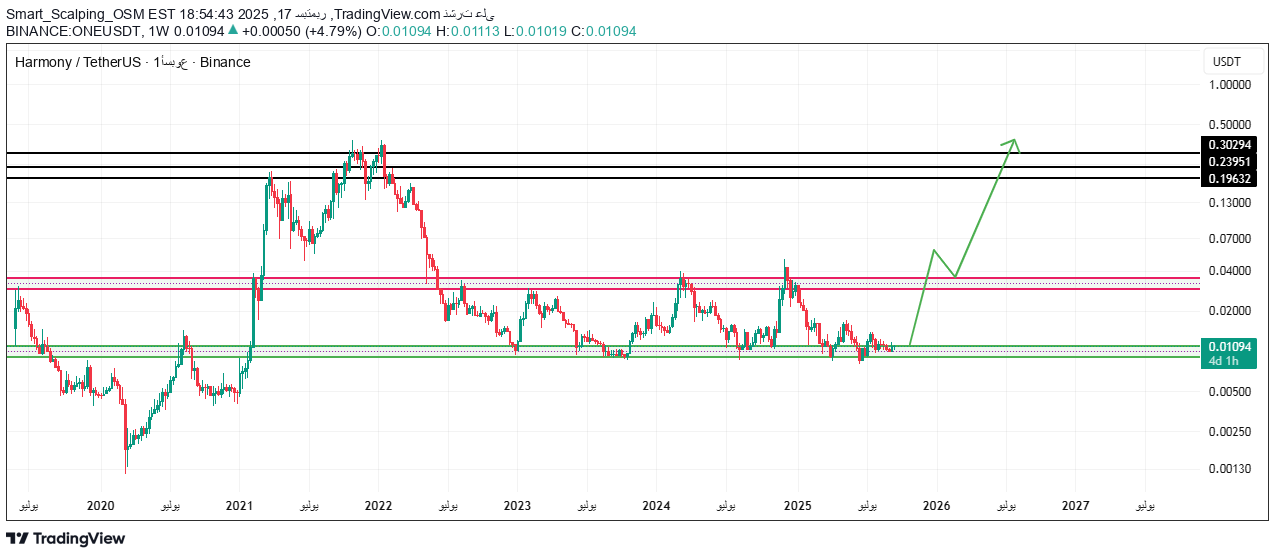
Simple technical analysis: The current situation: Current price: $ 0.01093 (decrease -0.27%) The currency is currently trading at an important support level around $ 0.01093 Main points: The general trend: the currency in a declining direction since the peak of 2021 at $ 0.40 Support and resistance levels: Strong support: About $ 0.007 (Green Line) First Resistance: About $ 0.04 (Red Line) Main resistance: $ 0.30+ (upper black lines) Current style: The price has been moving in a narrow range since early 2022 There are repeated attempts to break the resistances, but they failed Future expectations (based on the green arrow): There is a possibility for a gradual rise towards $ 0.30+ levels But this requires breaking several important resistances Recommendation: The currency is in a strong support area, but you need to break $ 0.04 first to confirm the beginning of the upward trend
تحليل شارت عملة fil
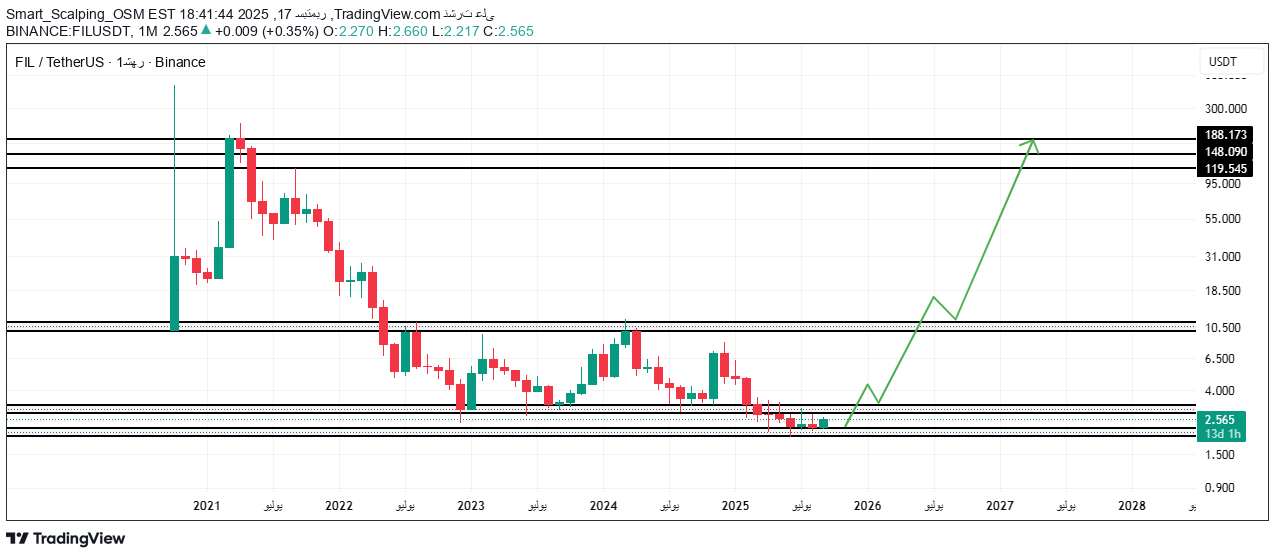
The current situation: Current price: $ 2.572 Performance: a decrease of 13.30% The general trend: currently down Technical analysis: Important levels: Strong Resistance: About $ 10 (horizontal black line) Current support: about $ 2.5 (lower green line) Higher residences: 18, 30, 50 dollars Main notes: Great down Important support zone: The price is currently testing a strong support level around $ 2.5 Future expectation: The scheme shows the possibility of a strong bounce (oblique green line) about 148-188 dollars by 2027-2028 Recommendation: The currency in an important support zone and may be an opportunity to buy long -term But be careful not to break the level of $ 2.5 Suitable for long -term investment than short -term trading Remember: This is a technical analysis, not an investment advice, and the financial markets are fraught with risk.
شارت الاثيريوم فريم الاسبوعي
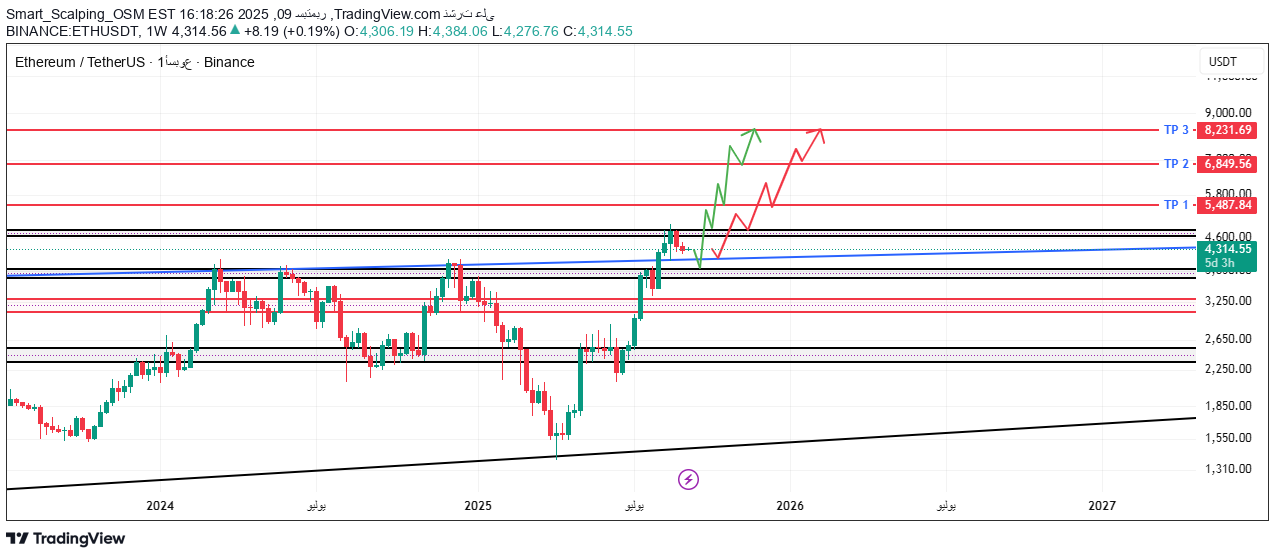
Main points 📈 The general trend: A clear rising trend since the end of 2024 The price broke several important resistance levels Forming ascending bottoms and ascending peaks 🎯 Support and Resistance levels: Close support: about 3,750-4,000 dollars Next Resistance: $ 5,487 (TP1) Top goals: $ 6,847 (TP2) and $ 8,731 (TP3) 📊 Technical notes: Trading volume seems strong during the height The price exceeds the moving averages clearly Forming an average rising model ⚠️ Warnings: The price in a relatively high area We may witness a natural correction before continuing Monitor the level of $ 4,000 as important support 💡 Conclusion: The general trend is positive with the possibility of continued ascension, but it is recommended to be careful and accurate monitoring of support levels.
البيتكوين يقترب من القمة التاريخية: هل ننتظر كسر قمة 120000
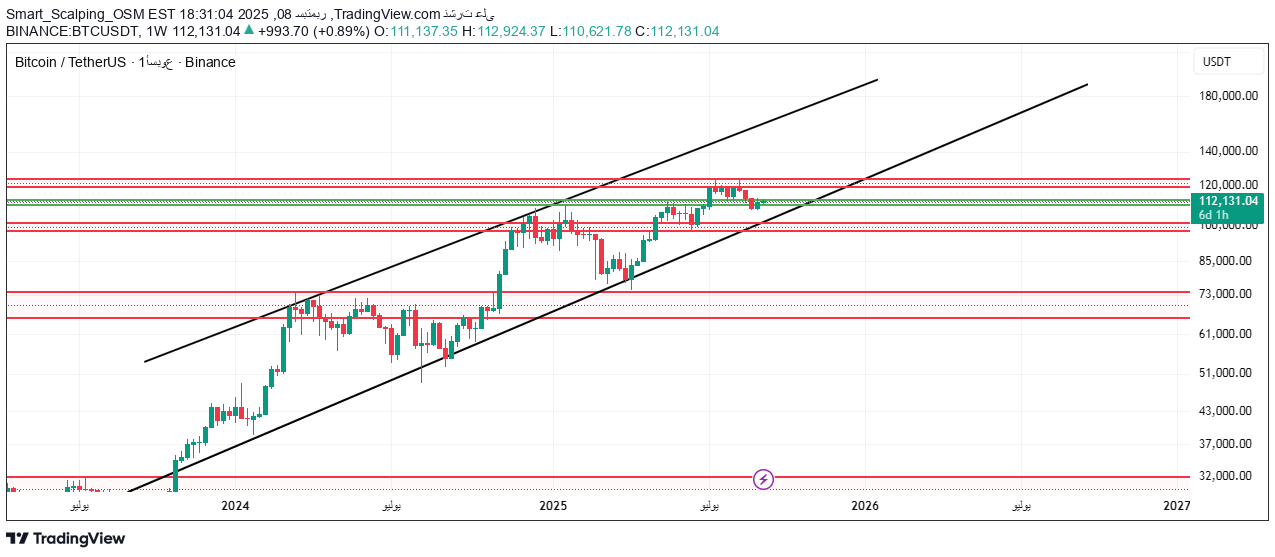
Bitcoin technical analysis - weekly framework The current situation: The current price: approximately 112,200 The general trend: a strong rising within a rising channel Main points: 1. The emerging canal: Bitcoin has been moving within a clear emerging channel since 2023 The price is currently approaching the upper limit of the channel at $ 120,000-125,000 2. Support and Resistance levels: Strong Resistance: $ 120,000 (the top of the channel) Important support: $ 100,000 (important psychological level) Secondary support: $ 85,000-90,000 (previous support zone) 3. The direction: Long -term trend: rising strongly Breaking the level of $ 100,000 successfully and turning to support Expected scenarios: Positive scenario: Breaking the level of $ 120,000 may pay the price about 140,000-150,000 $ The continuation of the rising momentum within the channel Correct scenario: A $ 120,000 bounce towards a region of 100,000-105,000 $ This will be a healthy correction of the upward direction Recommendation: The general trend remains ascending, but it is recommended to be cautious at $ 120,000, as we may witness a temporary correction before completing the rise. Note: This analysis of educational purposes, not an investment advice
Disclaimer
Any content and materials included in Sahmeto's website and official communication channels are a compilation of personal opinions and analyses and are not binding. They do not constitute any recommendation for buying, selling, entering or exiting the stock market and cryptocurrency market. Also, all news and analyses included in the website and channels are merely republished information from official and unofficial domestic and foreign sources, and it is obvious that users of the said content are responsible for following up and ensuring the authenticity and accuracy of the materials. Therefore, while disclaiming responsibility, it is declared that the responsibility for any decision-making, action, and potential profit and loss in the capital market and cryptocurrency market lies with the trader.